
Nyheter
Time to glean profits from grains


![WisdomTree, en global finansiell innovatör, meddelade idag att deras europeiska ETF[3] och ETP-sortiment har nått 50 miljarder dollar i förvaltat kapital, vilket markerar en viktig milstolpe i deras tillväxtbana. Prestationen understryker styrkan i WisdomTrees UCITS-plattform, deras ledarskap inom guld och råvaror, och deras position som en pionjär inom krypto-ETPer. Globalt förvaltar WisdomTree över 140 miljarder dollar, över olika tillgångsslag, för investerares räkning.](https://media.etfmarknaden.se/2025/10/50-400x240.jpg)
![WisdomTree, en global finansiell innovatör, meddelade idag att deras europeiska ETF[3] och ETP-sortiment har nått 50 miljarder dollar i förvaltat kapital, vilket markerar en viktig milstolpe i deras tillväxtbana. Prestationen understryker styrkan i WisdomTrees UCITS-plattform, deras ledarskap inom guld och råvaror, och deras position som en pionjär inom krypto-ETPer. Globalt förvaltar WisdomTree över 140 miljarder dollar, över olika tillgångsslag, för investerares räkning.](https://media.etfmarknaden.se/2025/10/50-80x80.jpg)


![36% of 800 professional investors surveyed by WisdomTree noted ‘diversification’ as their primary reason for holding gold[1]. Our analysis shows that gold has a low correlation with both equities and bonds and, thus, should contribute strongly to a diversification effort.](https://media.etfmarknaden.se/2025/01/Wisdomtree-400x240.jpg)
![36% of 800 professional investors surveyed by WisdomTree noted ‘diversification’ as their primary reason for holding gold[1]. Our analysis shows that gold has a low correlation with both equities and bonds and, thus, should contribute strongly to a diversification effort.](https://media.etfmarknaden.se/2025/01/Wisdomtree-80x80.jpg)


KBC Asset Management utökar sitt europeiska ETF-utbud i trippellansering, med säkringsalternativ för ungerska forinter (HUF) och tjeckiska korunor (CZK).
- KBC Asset Management har utökat sitt europeiska ETF-utbud med lanseringen av bluesphere US Equity UCITS ETF (ticker: BSUE), bluesphere European Equity UCITS ETF (ticker: BSEU) och bluesphere US Technology UCITS ETF (ticker: BSTE).
- Var och en av ETFerna finns också tillgängliga i både HUF- och CZK-säkrade andelsklasser, vilket gör dem till ett unikt erbjudande i ETF-landskapet.
- HANetf har byggt upp en exklusiv ICAV för KBC för sina produkter.
- ETFerna är noterade på Euronext Amsterdam.
HANetf, Europas första och ledande white-label UCITS ETF och ETC-plattform, [1] är glada att kunna meddela att KBC Asset Management har utökat sitt europeiska ETF-utbud:
- bluesphere° US Equity UCITS ETF (ticker: BSUE)
- bluesphere° European Equity UCITS ETF (ticker: BSEU)
- bluesphere° US Technology UCITS ETF (ticker: BSTE)
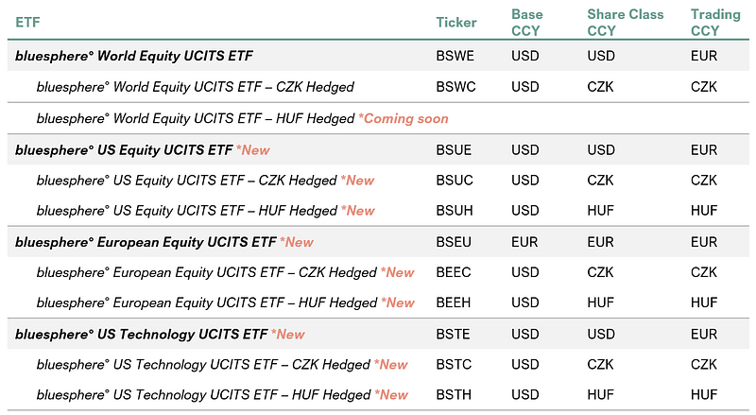
Var och en av de tre nya ETFerna finns även tillgängliga med säkringsalternativ för ungerska forinter (HUF) och tjeckiska korunor (CZK). Hela utbudet och tillgängliga säkringsalternativ finns nedan:
KBC Group är en integrerad bank- och försäkringsgrupp som bildades 1998 genom sammanslagningen av två belgiska banker, Kredietbank och CERA Bank, och det belgiska försäkringsbolaget ABB Insurance. Idag betjänar KBC cirka 13 miljoner kunder och fokuserar på sina kärnmarknader i Belgien, Tjeckien, Slovakien, Ungern och Bulgarien, samtidigt som de upprätthåller en mer begränsad närvaro i utvalda andra länder.
Koncernen driver ett omfattande distributionsnätverk med cirka 1 090 bankkontor, kompletterat med försäkringsförsäljning via egna ombud och andra kanaler, samt ett brett utbud av digitala och elektroniska plattformar. Med cirka 40 000 anställda kombinerar KBC bank- och försäkringsexpertis för att förse kunderna med integrerade finansiella tjänster skräddarsydda efter deras behov.
De nya ETFerna är utformade för att ge investerare en rad globala exponeringar, förstärkta av en mycket eftertraktad funktion i lokal valuta. Varje ETF finns tillgänglig i en CZK-säkrad andelsklass, med ett växande antal även tillgängliga i HUF-säkrade andelsklasser, vilket skapar ett differentierat erbjudande inom ETF-marknaden och skräddarsytt för tjeckiska och ungerska investerares behov.
ETFerna är byggda kring transparenta och disciplinerade regelbaserade metoder, vilket ger tydlig insyn i portföljsammansättning och marknadsexponering utan onödig komplexitet. Genom att följa etablerade index syftar ETFerna till att ge en pålitlig grund för investerare som vill fortsätta investera på aktiemarknaderna på lång sikt.
KBC anser att det finns en tydlig möjlighet att differentiera sig på den globala aktie-ETF-marknaden genom en stark lokal fördel. Djup marknadsinsikt, regulatorisk expertis och långvariga kundrelationer kan alla spela en viktig roll för att stödja investerare vid sidan av det breda universum av standard ETF-erbjudanden som redan finns tillgängliga på marknaden.
Viktiga risker
- ETFernas resultat kan påverkas av förändringar i ekonomiska och marknadsmässiga förhållanden.
- ETFerna kan också påverkas av osäkerheter såsom politisk utveckling, förändringar i regeringens politik, införandet av restriktioner för kapitalöverföring och i juridiska, regulatoriska och skattemässiga krav.
- Sekundärmarknader kan vara föremål för oregelbunden handelsaktivitet, breda köp-/säljspreadar och förlängda avvecklingsperioder i tider av marknadsstress.
Johan Lema, VD på KBC Asset Management, säger: ”Den mycket framgångsrika lanseringen av vår globala CZK-säkrade ETF bekräftade ett starkt kundintresse för erbjudanden från aktörer som verkligen förstår den lokala marknadsdynamiken. Detta gav oss förtroendet att fortsätta genomföra våra ambitiösa planer. Dessa nya ETF:er markerar nästa steg i vår resa för att få alla investerade, hela tiden. Genom att utnyttja vår starka närvaro på våra kärnmarknader fortsätter vi att erbjuda enkla, värdefulla och pålitliga investeringslösningar till både befintliga och nya KBC-kunder.”
Hector McNeil, medgrundare och VD för HANetf, kommenterade: ”Vi är glada över att KBC Asset Management utökar sitt utbud av europeiska UCITS-ETFer. Som ett av Belgiens ledande finansinstitut, med djupa rötter i sina europeiska kärnmarknader, bidrar KBC Group med betydande skala, trovärdighet och distributionsstyrka till lanseringarna.”
[1] Som visas i ETF-databasen.


KBC Asset Management utökar sitt europeiska ETF-utbud i trippellansering

HEDL ETF använder en covered call strategi för att ge månadsvisa utdelningar

Sprott ser starka långsiktiga silverutsikter trots den senaste tidens prisvolatilitet

MD4C ETF spårar spårar tyska mid cap aktier

Fastställd utdelning i MONTDIV juni 2026

QQCC ETF följer företag världen över som är aktiva inom kvantberäkning

Extrema skillnader: Varför presterar Europas kvantdator-ETFer så olika?

Den osynliga flaskhalsen i AI-boomen: Varför elinfrastruktur är nästa stora megatrend

Varför Plus500 är en dröm för finans-affiliate

ETFer för fotbolls-VM 2026
-
 Nyheter4 veckor sedan
QQCC ETF följer företag världen över som är aktiva inom kvantberäkning
-
 Nyheter3 veckor sedan
Extrema skillnader: Varför presterar Europas kvantdator-ETFer så olika?
-
 Nyheter2 veckor sedan
Den osynliga flaskhalsen i AI-boomen: Varför elinfrastruktur är nästa stora megatrend
-
 Nyheter4 veckor sedan
Varför Plus500 är en dröm för finans-affiliate
-
 Nyheter4 veckor sedan
ETFer för fotbolls-VM 2026
-

 Nyheter4 veckor sedan
Olja och Hormuzsundet fick flest sökningar i maj 2026
-
 Nyheter4 veckor sedan
Hyperliquid – The Everything Exchange
-

 Nyheter4 veckor sedan
ETFerna som ger exponering mot STOXX Europe 600