Tax Reform Adds Fuel to Gold’s Engine a Gold Commentary July by Joe Foster, Portfolio Manager/Strategist
Gold’s Yearend Pattern Repeated: Oversold Ahead of Rate Increase Then Rebound
The Federal Reserve (the ”Fed”) raised rates for the third time in 2017 following the Federal Open Market Committee (FOMC) meeting on December 12. Since 2015, gold has established a yearend pattern where it becomes oversold ahead of the December Fed rate decision. This pattern repeated again this year as the gold price trended to a five-month low of $1,236 per ounce on the day of the Fed meeting and then promptly rebounded from the Fed-induced low to end December with a $28.11 gain (2.2%) at $1,303.05 per ounce. Commodity price strength also aided gold as copper and crude oil both made multi-year highs in the last week of the year.
Gold stocks also tested their second half lows on December 12 and, like gold bullion, staged a comeback to end December with the NYSE Arca Gold Miners Index 1 (GDMNTR) rising 4.6% and the MVIS Global Junior Gold Miners Index2 (MVGDXJTR) gaining 8.1% for the month.
Strong 2017 Performance on Geopolitical Risk, U.S. Dollar Weakness, and Commodities Strength
Gold and gold stocks performed well in 2017. The gold price advanced $150.78 per ounce (13.1%), the GDMNTR was up 12.2%, and the MVGDXJTR gained 6.2%. These gains were impressive for a market in which investors generally showed little interest in gold while being preoccupied with new records in the stock market, bitcoin, and ancient art. Gold also did not receive much help from the physical markets, as Indian demand remained near the lows of 2016 and China’s central bank refrained from purchasing gold. The resilience in the price of gold came from a global sense of geopolitical risk and uncertainty, overall strength in commodities, and unexpected weakness in the U.S. dollar. Gold stocks typically outperform gold bullion in a positive gold market. However, this year was one of mean reversion after a strong 2016 (GDMNTR up 55%), along with a lack of sizzle that investors are seeing elsewhere. Healthy earnings and increased guidance among gold companies were not enough to capture much investor interest in 2017.
Tax Reform Adds to Deficit, Increases Systemic Risk
Anyone hoping that Washington D.C. would become fiscally responsible under Republican Party rule has seen their hopes go up in flames, as new tax rules appear likely to drive the U.S. deeper into debt. Some say economic growth created by tax cuts will likely generate more government revenue. In a recent Wall Street Journal article, ex-Congressional Budget Office (CBO) director Douglas Holtz-Eakin stated that he believes tax policy can partially offset costs if it is well designed. We believe the new tax code is not well designed, as it is nearly as complicated as the old one, widely unpopular, and contains many provisions set to expire in 2025. The tax windfall corporations will receive comes at a time when profits are high and cheap credit is plentiful. If companies were inclined to spend more on capital expansions, they would have done so already, but instead many companies have used cash to buy back stock and pay dividends. We believe it is too late in the cycle for tax stimulus to have a lasting effect. In addition, fiscal stimulus has limited effects when debt levels are high, as they are today. None of the federal income tax cuts since 1980 have succeeded in shrinking the deficit through growth. The Reagan tax cuts of 1981 could not forestall a recession that started in July of that year, caused by tighter Fed policy. Similarly, any growth resulting from Trump’s tax cuts could give the Fed more latitude to raise rates.
Tax reform will add an estimated $1.5 trillion to the deficit over ten years, according to the Joint Committee on Taxation (JCT). In October, the U.S. Treasury Department reported the budget shortfall increased 14% in 2017 to $666 billion, which is equal to 3.3% of GDP. At $16 trillion, public federal debt is 85% of GDP and Harvard University economist Jason Furman estimates debt escalating to 98% of GDP by 2028. The CBO figures interest charges will consume 15% of federal revenues in 2027, up from 8% currently. The annual report from the trustees of the nation’s largest entitlement programs show the trust funds running out for Medicare in 2029 and for Social Security in 2034. The new tax law only piles more onto this growing mountain of debt.
Total non-financial debt in the U.S. stands at $47 trillion, equal to 250% of GDP and $14 trillion more than at the peak of the last credit bubble when debt/GDP stood at 225%. Thanks to below market rates engineered by central banks, debt service has not yet become a problem. Low rates have forced investors to take on more risk in order to generate acceptable returns. Another side effect is the proliferation of European ”zombie companies”, meaning their interest cost exceeds earnings and kept on life support by banks fearful of losses if the companies declare bankruptcy. The Bank for International Settlements (BIS) estimates that 10% of publicly traded companies in six major European countries are zombies. As central banks embark on tighter policies, at some point higher rates could create debt service problems. Gluskin Sheff3 reckons every percentage point rise in the level of rates will ultimately drain 2.5% out of nominal GDP growth.
Looming Economic Downturn, Decline in Markets Supports Gold Allocation
It appears the only way to stop sovereign debt from growing is through tax increases or spending cuts. By now it should be clear that these options are politically impossible, which suggests that deficits will continue to grow until they cause a crisis severe enough to motivate change. ”Crypto-mania” and a stock market that goes nowhere but up indicates that a crisis is the last thing on investors’ minds. However, in our opinion, we are at a stage in the cycle when concerns should be high. The expansion is heading into its ninth year. The economy is at full employment and the personal savings rate has declined from 6% in 2015 to 2.9% in November. By now many have bought their first home, a new car, remodeled the kitchen, taken that overseas vacation, or bought a second home. Some are in a position to speculate on their favorite ETF, cryptocurrency, or FAANG stock (Facebook, Apple, Amazon, Netflix, and Google). There comes a point when investors are all-in and something happens that triggers a selloff – a geopolitical event, an economic downturn, or a black swan 4 emerges. Markets decline, but there are few investors with the capacity or desire to buy more, so markets decline more. Momentum kicks in and there’s more selling until sentiment turns for the worse. The selloff becomes a contagion that spreads uncontrollably. It has happened to tech stocks and it’s happened to instruments linked to mortgage securities. It is likely to happen again.
Based on the gold price strength following December rate increases in 2015 and 2016, we expect to see firmness in the gold price in the first quarter. However, headwinds may come for gold if economic growth enables the Fed to tighten more than expected. Also, the U.S. dollar might strengthen if the new tax code causes corporations to repatriate profits stockpiled overseas. We believe any weakness in gold during the first half of 2018 could be transitory. Moving through 2018 and into 2019, we believe the chance of an economic downturn increases, along with the probability of a significant decline in the markets. High levels of debt could cause a downturn to turn into a financial crisis. We now know that quantitative easing5 and below-market rates have failed to generate needed growth or inflation. In the next crisis, look for central banks to resort to even more radical policies, such as directly funding treasuries. It is conceivable that there could be global currency debasement on a scale never seen before. In such a scenario, hard assets, especially gold and gold stocks, could significantly outperform most, if not all, other asset classes in our opinion. There comes a time in every economic cycle when investors should seek portfolio insurance. We believe the time is now.
by Joe Foster, Portfolio Manager and Strategist
With more than 30 years of gold industry experience, Foster began his gold career as a boots on the ground geologist, evaluating mining exploration and development projects. Foster is Portfolio Manager and Strategist for the Gold and Precious Metals strategy.
Please note that the information herein represents the opinion of the author and these opinions may change at any time and from time to time.
IMPORTANT DISCLOSURE
1 NYSE Arca Gold Miners Index (GDMNTR) is a modified market capitalization-weighted index comprised of publicly traded companies involved primarily in the mining for gold.
2 MVIS Global Junior Gold Miners Index (MVGDXJTR) is a rules-based, modified market capitalization-weighted, float-adjusted index comprised of a global universe of publicly traded small- and medium-capitalization companies that generate at least 50% of their revenues from gold and/or silver mining, hold real property that has the potential to produce at least 50% of the company’s revenue from gold or silver mining when developed, or primarily invest in gold or silver.
3 Gluskin Sheff + Associates Inc., a Canadian independent wealth management firm, manages investment portfolios for high net worth investors, including entrepreneurs, professionals, family trusts, private charitable foundations, and estates.
4 A black swan is an event or occurrence that deviates beyond what is normally expected of a situation and is extremely difficult to predict; these events are typically random and are unexpected.
5 Quantitative Easing by a central bank increases the money supply engaging in open market operations in an effort to promote increased lending and liquidity.
Important Disclosures
This commentary originates from VanEck Investments Limited (“VanEck”) and does not constitute an offer to sell or solicitation to buy any security.
VanEck’s opinions stated in this commentary may deviate from opinions presented by other VanEck departments or companies. Information and opinions in this commentary are based on VanEck’s analysis. Any forecasts and projections contained in the commentary appear from the named sources. All opinions in this commentary are, regardless of source, given in good faith, and may only be valid as of the stated date of this commentary and are subject to change without notice in subsequent versions of the commentary. Any projections, market outlooks or estimates in this material are forward-looking statements and are based upon certain assumptions that are solely the opinion of VanEck. Any projections, outlooks or assumptions should not be construed to be indicative of the actual events which will occur.


 Nyheter4 veckor sedan
 Nyheter1 vecka sedan
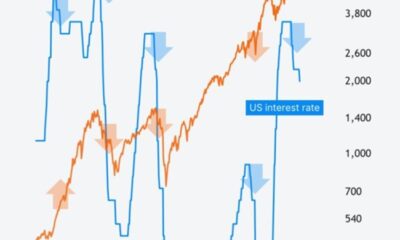
 Nyheter4 veckor sedan
 Nyheter4 veckor sedan