
Nyheter
Successfully navigate through Bitcoin & Cryptoasset Markets
• Market sentiment has stabilized as outflows from Grayscale’s Bitcoin Trust (GBTC) have slowed down
• Our in-house “Cryptoasset Sentiment Index” declined to levels that signal a short-term tactical bottom last week
• We expect the influence of macro factors on Bitcoin & Cryptoassets to reassert itself over the coming weeks
Chart of the Week
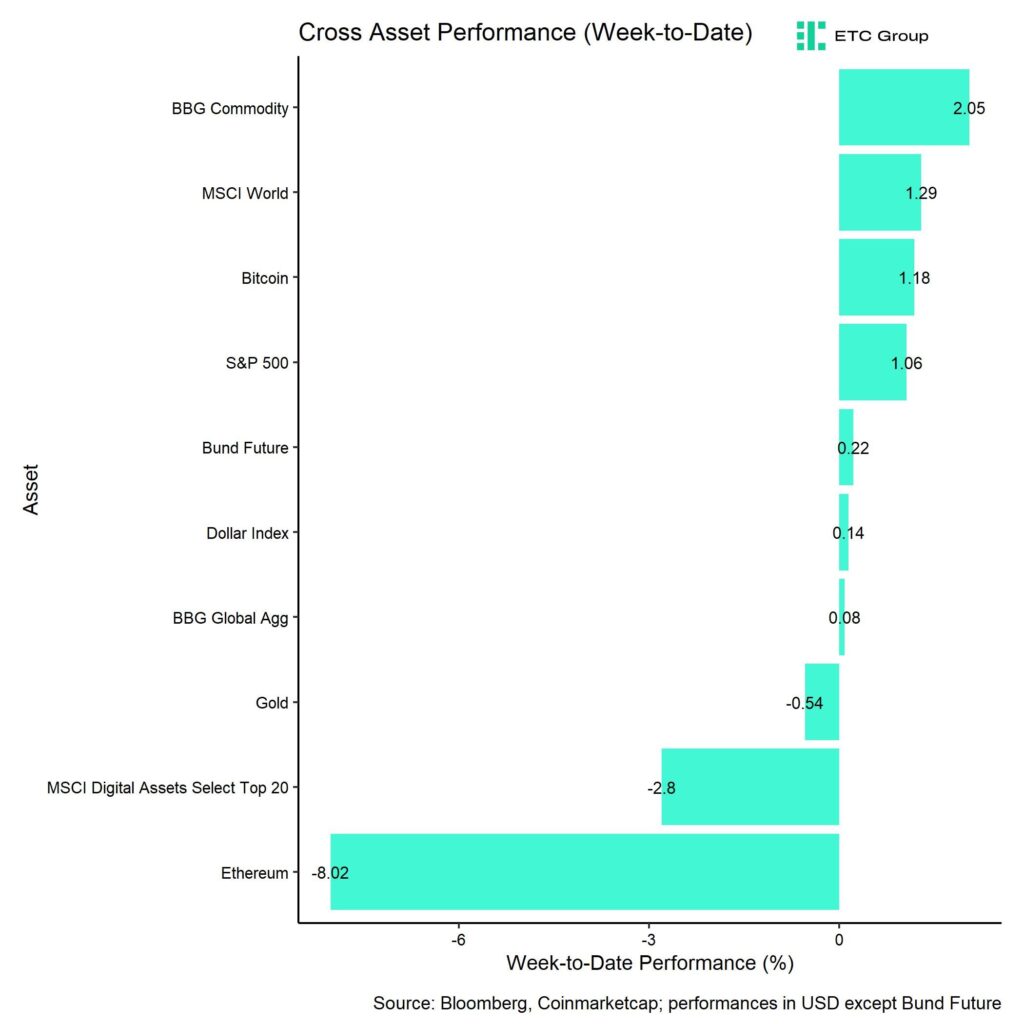
Performance
Last week, cryptoassets mostly recovered from the sell-off in the prior week. One of the main reasons for this recovery was that outflows from the biggest Bitcoin fund in the world – Grayscale Bitcoin Trust (GBTC) – have slowed down recently which has lifted market sentiment a bit.
Market sentiment was relatively bearish at the beginning of last week, with our in-house “Cryptoasset Sentiment Index” hitting the lowest level since March 2023 amid heightened fund outflows and increasing bitcoin exchange inflows.
The index has decreased to such low levels that at least a short-term tactical bottom appears to be quite likely.
Over the course of last week, we saw a significant reversal in sentiment from low levels amid reversals in spot bitcoin exchange inflows and bitcoin put-call volume ratios that had put pressure on the market.
Ethereum also came under pressure after a portion of the chain’s major operators were rendered inoperable on Sunday due to a problem in Ethereum’s Nethermind client software, which is used by blockchain validators to communicate with the network.
The incident has raised concerns about the centralization and high reliance on single dominant client softwares like Geth – a risk referred to as “supermajority client risk” – which has dampened market sentiment towards Ethereum last week.
Overall, although ETF fund flows in the US still appear to be relatively influential, the market clearly lacks some new catalysts in the short term. It is quite likely that the influence of macro factors such as global growth expectations or monetary policy could reassert itself over the coming months, at least until the Bitcoin Halving in April 2024.
In this context, the FOMC will convene to decide on US monetary policy on the 30th and 31st of January this week. The FOMC is expected to hold interest rates unchanged this week and only to cut rates later in March based on expectations priced into Fed Funds Futures.
However, interest rate cuts have recently been priced out which was also seen as a potential bearish macro catalyst for the latest sell-off in cryptoassets.
In this context, we are currently measuring a dominant influence of global growth expectations and general level of risk appetite on Bitcoin and only to a lesser extent an influence by other macro factors such as monetary policy or the US Dollar.
Our own measure of Cross Asset Risk Appetite (CARA) has also recovered last week which has likely supported the recovery in for Bitcoin and other cryptoassets as well.
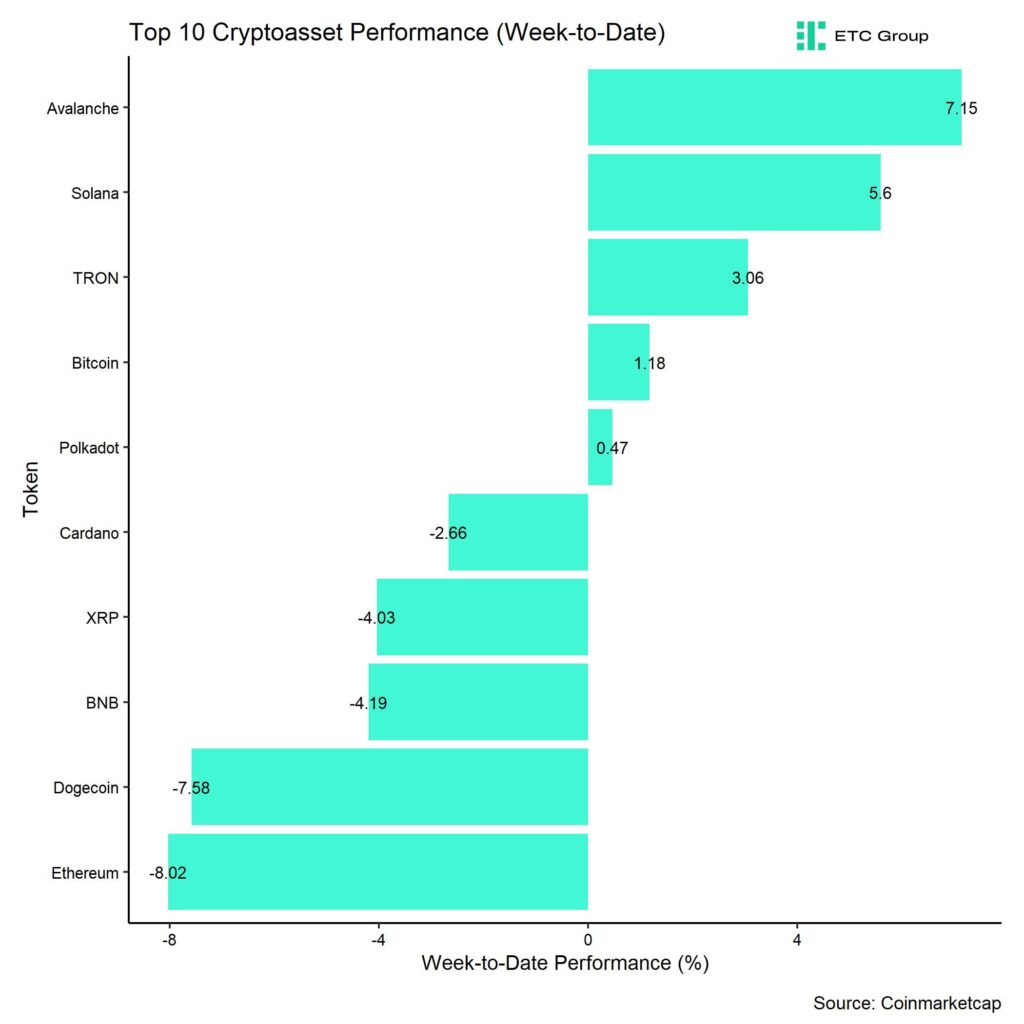
In general, among the top 10 crypto assets, Avalanche, Solana, and TRON were the relative outperformers.
Altcoin outperformance vis-à-vis Bitcoin was relatively weak compared to the week prior, with only 5% of our tracked altcoins managing to outperform Bitcoin on a weekly basis.
Sentiment
Market sentiment was relatively bearish at the beginning of last week, with our in-house “Cryptoasset Sentiment Index” hitting the lowest level since March 2023.
The index has decreased to such low levels that at least a short-term tactical bottom appears to be quite likely.
At the moment, only 6 out of 15 indicators are above their short-term trend.
Compared to last week, we saw major reversals to the upside in BTC exchange inflows and BTC put-call volume ratios.
The Crypto Fear & Greed Index has swung back to ”Greed” territory as of this morning.
Meanwhile, our own measure of Cross Asset Risk Appetite (CARA) has recently increased. Overall, this is signalling a return in risk appetite in traditional financial markets.
Performance dispersion among cryptoassets has recently remained elevated.
In general, high-performance dispersion among cryptoassets implies that correlations among cryptoassets have decreased, which means that cryptoassets are trading more on coin-specific factors and that diversification among cryptoassets is high.
At the same time, altcoin outperformance vis-à-vis Bitcoin has declined considerably amid an underperformance of Ethereum vis-à-vis Bitcoin. Only 5% of our tracked altcoins have outperformed Bitcoin on a weekly basis.
In general, low altcoin outperformance tends to be a sign of low risk appetite within cryptoasset markets.
Fund Flows
In aggregate, we saw weekly net fund outflows from all types of cryptoassets in the amount of -500.1 mn USD (week ending Friday) based on Bloomberg data.
Global Bitcoin ETPs saw significant outflows of -491.5 mn USD of which -417.0 mn were related to US spot Bitcoin ETFs. This was mostly related to continuing outflows from the Grayscale Bitcoin Trust (GBTC) which amounted to -2,234.3 mn USD last week alone. This was partially counteracted by net inflows into other US spot Bitcoin ETFs that were able to attract 1,818.0 mn USD in net inflows.
On a positive note, the outflows from GBTC have slowed down over the past 5 trading days which has also improved market sentiment as well.
Note that some fund flows data for US major issuers are still lacking in the abovementioned numbers due to T+2 settlement.
Apart from Bitcoin, we saw comparatively small flows into other cryptoassets last week.
Ethereum ETPs also saw net outflows in the amount of -37.3 mn USD while other altcoin ETPs ex Ethereum managed to attract +1.1 mn USD.
Thematic & basket crypto ETPs also managed to attract net inflows of +27.6 mn USD, based on our calculations.
Besides, the beta of global crypto hedge funds to Bitcoin over the last 20 trading still remains low at below 0.8, implying that global crypto hedge funds still remain under-exposed to Bitcoin market risks. It appears as if crypto hedge funds are still waiting on the sidelines for new catalysts.
On-Chain Data
Last week, in- and outflows related to spot Bitcoin ETFs continued to exert a significant influence on Bitcoin on-chain data as well.
High outflows from the Grayscale Bitcoin Trust (GBTC) led to increased exchange inflows into crypto exchanges, in particular Coinbase.
More particularly, last Monday GBTC transfers to Coinbase accounted from approximately 76% of overall whale exchange deposits to Coinbase on that day. That percentage has declined gradually throughout the past week and was at around 30% last Friday.
We have analysed the effect of the GBTC selling on the price of Bitcoin in more detail here.
However, although GBTC percentage in whale exchange inflows has somewhat declined, whale exchange inflows still remain relatively high from a structural point of view. This could put a lid on any significant price advances in the short term.
Besides, the average coin dormancy also remains relatively high which tends to be a bearish signal.
Dormancy, defined as the ratio of coin days destroyed to total transfer volume, is the average number of days destroyed per coin traded. The higher the coin days destroyed, the longer a coin has been dormant. It usually signals whether older coins are on the move.
On a positive note, Bitcoin miners have ceased to sell their BTC reserves – a process which had started around November 2023 already. Aggregate BTC miner balances have moved sideways over the past week.
It is also positive to observe that the number of BTC whale has increased significantly over the past week.
Whales are defined as unique entities holding at least 1k BTC. This increase implies that, on aggregate, whales might be accumulating coins again.
In fact, we are observing an increase in BTC holdings in wallets that hold between 1k BTC and 100k BTC.
Futures, Options & Perpetuals
BTC futures open interest declined somewhat last week while perpetual open interest was mostly unchanged. There were no significant futures long or short liquidations last week.
The 3-months annualized BTC futures basis has stabilized at around 9.7% p.a. and perpetual funding rates have been positive throughout the week.
There were more significant developments in the BTC option space, which saw a massive expiry last week on Friday that led to a decrease of around -86k BTC in option open interest. Put-call open interest ratio remains relatively low implying that most traders have relatively low put exposure.
That being said, last Thursday saw a significant spike in put buying as put-call volume ratios spiked to the highest level since October 2023. The BTC 25-delta 1-month option skew had also increased before that amid the sell-off but has recently declined from high levels.
There is generally a declining trend in implied volatilities since early January 2024 that continued last week as well. BTC option traders have generally been pricing out the uncertainty around the ETF approvals.
Bottom Line
• Market sentiment has stabilized as outflows from Grayscale’s Bitcoin Trust (GBTC) have slowed down
• Our in-house “Cryptoasset Sentiment Index” declined to levels that signal a short-term tactical bottom last week
• We expect the influence of macro factors on Bitcoin & Cryptoassets to reassert itself over the coming weeks
To read our Crypto Market Compass in full, please click the button below:

GENERAL DISCLAIMER
The information provided in this advertising material is for informative purposes only and does not constitute investment advice, a recommendation or solicitation to conclude a transaction.
This document (which may be in the form of a press release, social media post, blog post, broadcast communication or similar instrument – we refer to this category of communications generally as a “document” for purposes of this disclaimer) is issued by ETC Issuance GmbH (the “issuer”), a limited company incorporated under the laws of the Germany. This document has been prepared in accordance with applicable laws and regulations (including those relating to financial promotions). If you are considering investing in any securities issued by ETC Group, including any securities described in this document, you should check with your broker or bank that securities issued by ETC Group are available in your jurisdiction and suitable for your investment profile.
Exchange-traded commodities/cryptocurrencies, or ETCs, are a highly volatile asset and performance is unpredictable. Past performance is not a reliable indicator of future performance. The market price of ETCs will vary and they do not offer a fixed income. The value of any investment in ETCs may be affected by exchange rate and underlying price movements. This document may contain forward looking statements including statements regarding ETC Group’s belief or current expectations with regards to the performance of certain asset classes. Forward looking statements are subject to certain risks, uncertainties and assumptions, and there can be no assurance that such statements will be accurate and actual results could differ materially. Therefore, you must not place undue reliance on forward-looking statements.
This document does not constitute investment advice nor an offer for sale nor a solicitation of an offer to buy any product or make any investment. An investment in an ETC that is linked to cryptocurrency, such as those offered by ETC Group, is dependent on the performance of the underlying cryptocurrency, less costs, but it is not expected to match that performance precisely. ETCs involve numerous risks including among others, general market risks relating to underlying adverse price movements and currency, liquidity, operational, legal and regulatory risks.
ETC Issuance GmbH, incorporated under the laws of Germany, is the issuer of any securities described in this document, under the base prospectus dated 23 November 2021, and previously the the base prospectus dated 14th January 2021 and prospectus dated 4 June 2020,, and various sets of final terms (in relation to BTCE, ZETH and other series of securities issued under that base prospectus), in each case as supplemented from time to time, and approved by BaFin. Any decision to invest in securities offered by ETC Group (including products and amounts) should take into consideration your specific circumstances after seeking independent investment, tax and legal advice. You should also read the latest version of the prospectus and/or base prospectus before investing and in particular, refer to the section entitled ‘Risk Factors’ for further details of risks associated with an investment. These prospectuses and other documents are available under the “Resources” section at etc-group.com. When visiting this website, you will need to self-certify as to your jurisdiction and investor type in order to access these documents, and in so doing you may be subject to other disclaimers and important information.
IF YOU ARE IN THE UK, US, OR CANADA
Information contained in this document is not, and under no circumstances is to be construed as, an advertisement or any other step in furtherance of a public offering in the United States or Canada, or any state, province or territory thereof, where neither the issuer nor its products are authorised or registered for distribution or sale and where no prospectus of the issuer has been filed with any securities regulator. Neither this document nor information in it should be taken, transmitted or distributed (directly or indirectly) into the United States.
PUBLICATIONS & SOCIAL MEDIA DISCLOSURE
Social media posts (including, but not limited to, LinkedIn and Twitter) of ETC Group and its subsidiaries (“Social Media”) are not, and should not be considered to be recommendations, solicitations or offers by ETC Group or its affiliates to buy or sell any securities, futures, options or other financial instruments or other assets or provide any investment advice or service. ETC Group makes all reasonable efforts to ensure that the information contained on Social Media is accurate and reliable; however, errors sometimes occur. You should note that the materials on Social Media are provided “as is” without any express or implied warranties. ETC Group does not warrant or represent that the materials on Social Media are accurate, valid, timely or complete.
RISKS OF CRYPTOCURRENCIES
Cryptocurrencies are highly volatile assets and are known for their extreme fluctuations in prices. While there is potential for significant gains, you are at risk of losing parts or your entire capital invested. The value of the ETCs is affected by the price of its underlying cryptocurrency. The price of cryptocurrencies can fluctuate widely and, for example, may be impacted by global and regional political, economic or financial events, regulatory events or statements by regulators, investment trading, hedging or other activities by a wide range of market participants, forks in underlying protocols, disruptions to the infrastructure or means by which crypto assets are produced, distributed, stored and traded. The price of cryptocurrencies may also change due to shifting investor confidence in future outlook of the asset class. Characteristics of cryptocurrencies and divergence of applicable regulatory standards create the potential for market abuse and could lead to high price volatility. Amounts received by Bondholders (i) upon redemption of the Bonds in USD, in cases where Bondholders are prevented from receiving cryptocurrency for legal or regulatory reasons; or (ii) upon sale on the stock exchange depend on the price performance of the relevant cryptocurrency and available liquidity.
For a detailed overview of risks associated with cryptocurrencies and specifically associated with the ETCs, please refer to the prospectus and base prospectus available at the issuer’s website at www.etc-group.com.


Nya ETF- och ETP-noteringar den 18 juni 2026 på Deutsche Börse

HYHE ETF följer utvecklingen av högavkastande företagsobligationer

Middlefield ser möjligheter inom kanadensisk energi, fastigheter och finans

WDAF ETF investerar i Asiens försvarsindustri
BlackRock utökar tillgången till systematisk aktiv investering för europeiska investerare

USA satsar 2 miljarder dollar på kvantdatorer – så kan investerare dra nytta av utvecklingen

Extrema skillnader: Varför presterar Europas kvantdator-ETFer så olika?

Fastställd utdelning i MONTDIV maj 2026

QQCC ETF följer företag världen över som är aktiva inom kvantberäkning

Varför Plus500 är en dröm för finans-affiliate
-
 Nyheter4 veckor sedan
USA satsar 2 miljarder dollar på kvantdatorer – så kan investerare dra nytta av utvecklingen
-
 Nyheter2 veckor sedan
Extrema skillnader: Varför presterar Europas kvantdator-ETFer så olika?
-
 Nyheter4 veckor sedan
Fastställd utdelning i MONTDIV maj 2026
-
 Nyheter3 veckor sedan
QQCC ETF följer företag världen över som är aktiva inom kvantberäkning
-
 Nyheter3 veckor sedan
Varför Plus500 är en dröm för finans-affiliate
-

 Nyheter3 veckor sedan
ETFer för fotbolls-VM 2026
-

 Nyheter3 veckor sedan
21shares produkter nu finns tillgängliga hos Revolut
-

 Nyheter3 veckor sedan
Olja och Hormuzsundet fick flest sökningar i maj 2026