
Nyheter
Singapore Dollar Tested on Polygon, Silk Road’s Stolen 50K Bitcoins Seized, and More!
Markets entered another week of resistance, with Bitcoin closing at $20.6K on Monday, close to where it started a week before. Despite a brief jump over the $21K and $1.6K marks that lasted for three days, Bitcoin and Ethereum barely moved over the past week, increasing by 0.5% and decreasing by 0.2% respectively. The biggest winner of last week’s rally was Polygon, which increased in returns by 43% after getting monumental institutional recognition as JPMorgan traded tokenized cash deposits on the Polygon blockchain last week, which we’ll delve deeper into in the DeFi section. Other winners, as seen in the figure below were Binance Coin and Lido which increased in returns by nearly 4% and 13% respectively.
Figure 1: TVL and price development of major crypto sectors
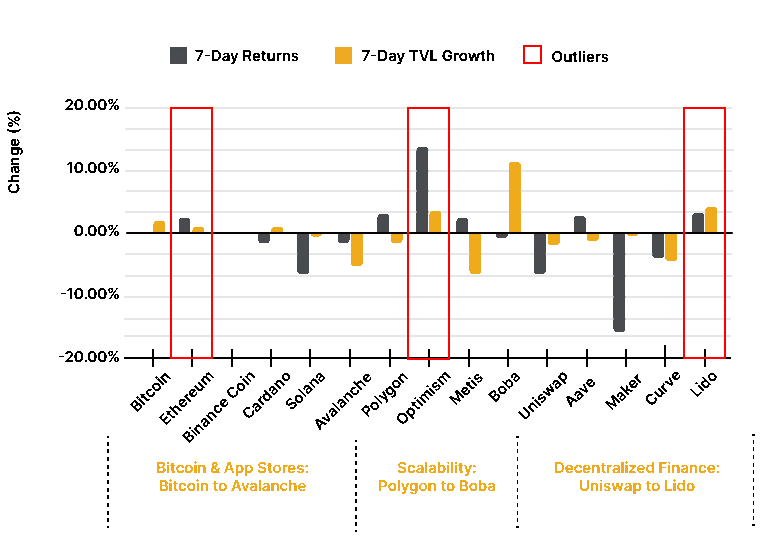
Source: 21Shares, Coingecko, DeFi Llama
Key takeaways
• Binance Acquires FTX
• The Fed seized more than $3B in Bitcoin stolen from the Silk Road in 2012.
• Hetzner kicks one-fifth of Solana validators off the cloud hosting platform
• JPMorgan and Singapore’s Central Bank testing DeFi’s Infrastructure
Spot and Derivatives Markets
Figure 2
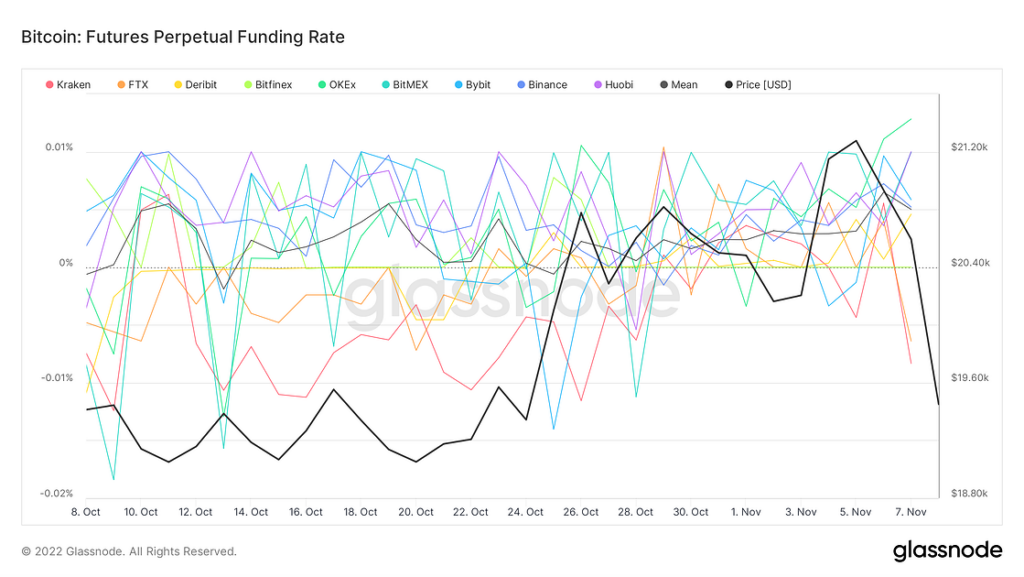
Source: Glassnode
The chart above plots the average funding rate (in %) set by exchanges for perpetual futures contracts. A negative funding rate means that short positions have to pay long positions periodically and usually indicates a bearish sentiment since more short traders are dominant, and vice versa. As seen in Figure 2, the funding rates of most exchanges have risen above the zero mark over the past week, except for those of Kraken and FTX, who are currently at a down downtrend, with the latter getting acquired by Binance.
On-chain Indicators
Figure 3
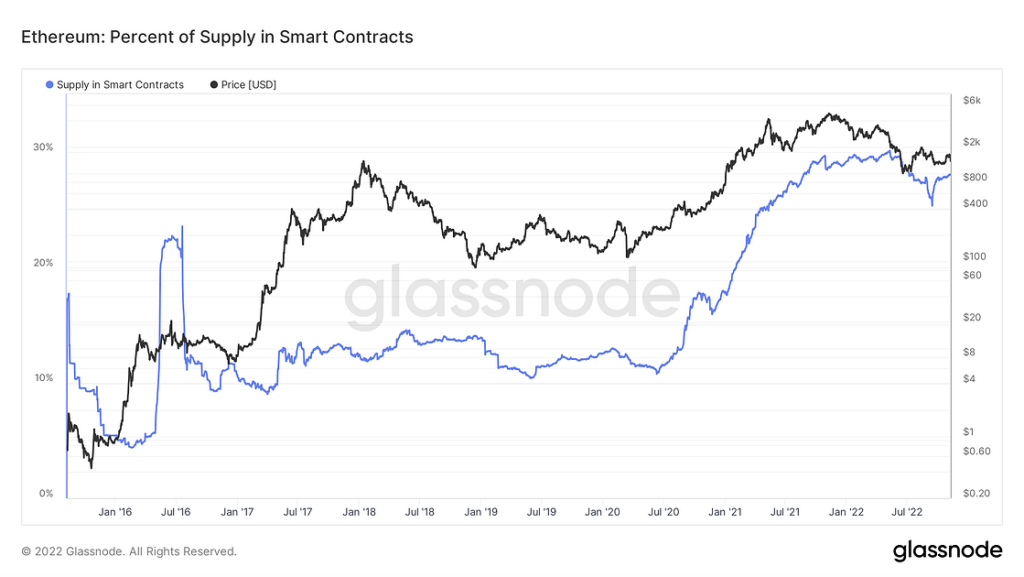
Source: Glassnode
The amount of Ethereum powering smart contracts are on the rise, as shown in Figure 3. Nearly 30% of the total supply of Ethereum is held in smart contracts. This indicates that the utility behind Ethereum’s value is intensifying, which means that the cryptoasset’s dollar figure will in turn follow suit.
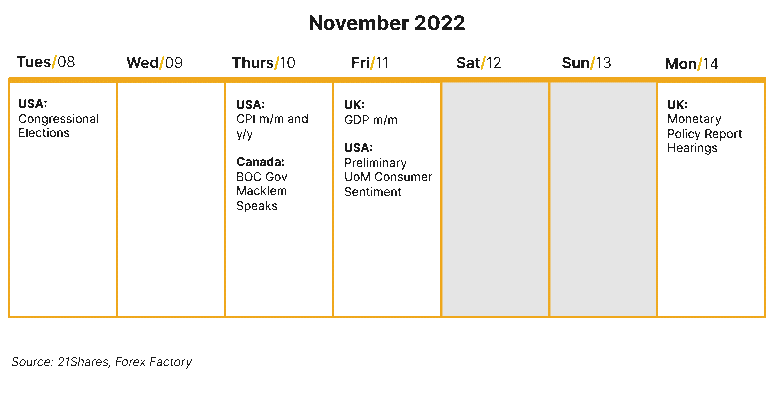
Next Week’s Calendar
Read full report here
Research Newsletter
Each week the 21Shares Research team will publish our data-driven insights into the crypto asset world through this newsletter. Please direct any comments, questions, and words of feedback to research@21shares.com
Disclaimer
The information provided does not constitute a prospectus or other offering material and does not contain or constitute an offer to sell or a solicitation of any offer to buy securities in any jurisdiction. Some of the information published herein may contain forward-looking statements. Readers are cautioned that any such forward-looking statements are not guarantees of future performance and involve risks and uncertainties and that actual results may differ materially from those in the forward-looking statements as a result of various factors. The information contained herein may not be considered as economic, legal, tax or other advice and users are cautioned to base investment decisions or other decisions solely on the content hereof.


Vilken typ av sektor ETFer finns det?

LVLD ETF investerar i ett urval av företag världen över med låg volatilitet

Den europeiska ETF-revolutionen: Skiftet som ritar om kartan för kapitalförvaltning
EEAK ETF investerar i eurodenominerade statsobligationer från eurozonen

HEQQ ETF mål är att ge långsiktig kapitaltillväxt

USA satsar 2 miljarder dollar på kvantdatorer – så kan investerare dra nytta av utvecklingen

Extrema skillnader: Varför presterar Europas kvantdator-ETFer så olika?

QQCC ETF följer företag världen över som är aktiva inom kvantberäkning

Fastställd utdelning i MONTDIV maj 2026

Varför Plus500 är en dröm för finans-affiliate
-
 Nyheter4 veckor sedan
USA satsar 2 miljarder dollar på kvantdatorer – så kan investerare dra nytta av utvecklingen
-
 Nyheter3 veckor sedan
Extrema skillnader: Varför presterar Europas kvantdator-ETFer så olika?
-
 Nyheter3 veckor sedan
QQCC ETF följer företag världen över som är aktiva inom kvantberäkning
-
 Nyheter4 veckor sedan
Fastställd utdelning i MONTDIV maj 2026
-
 Nyheter3 veckor sedan
Varför Plus500 är en dröm för finans-affiliate
-

 Nyheter1 vecka sedan
Den osynliga flaskhalsen i AI-boomen: Varför elinfrastruktur är nästa stora megatrend
-

 Nyheter3 veckor sedan
ETFer för fotbolls-VM 2026
-

 Nyheter4 veckor sedan
21shares produkter nu finns tillgängliga hos Revolut