Följ oss

Nyheter

Omsättning ETFer Nasdaq Stockholm juni 2021
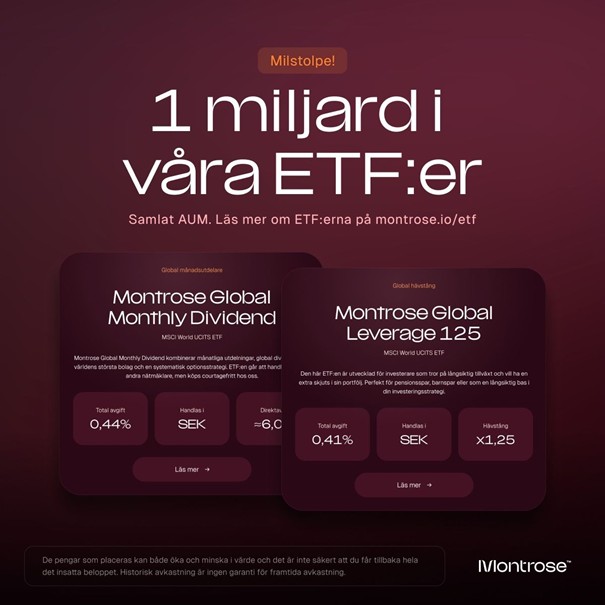
Publicerad

den

Vi tittar på hur det ser ut med omsättning ETFer Nasdaq Stockholm juni 2021. Notera att dessa siffror kan komma att förändras kraftigt varje månad.

Nyfiken på vilken bank eller kommissionär som står för den största delen av handeln med börshandlade fonder på Stockholmsbörsen? Vi tittar på hur det ser ut med omsättning ETFer Nasdaq Stockholm juni 2021. Notera att dessa siffror kan komma att förändras kraftigt varje månad.

TurnoverTrades
MemberSEK%No%
Svenska Handelsbanken AB3 506 816 45035,80%3 3875,65%
Virtu Financial Ireland Ltd1 108 631 14911,32%7 32312,22%
Avanza Bank AB1 046 237 51710,68%17 24228,78%
Flow Traders B.V.956 117 0869,76%5 9249,89%
Nordnet Bank AB679 434 4416,94%7 93113,24%
Skandinaviska Enskilda Banken AB450 357 2224,60%2 4364,07%
HRTEU Limited436 333 4184,45%3 6346,07%
Nordea Bank Abp342 157 3223,49%1 1891,98%
DRW Europe B.V.301 795 1833,08%1 2042,01%
Swedbank AB175 558 4091,79%1 3432,24%
SSW Market Making Gmbh151 109 9351,54%2 6444,41%
Carnegie Investment Bank AB132 059 4941,35%1080,18%
Alnair AB83 703 6070,85%5500,92%
Morgan Stanley Europe SE82 061 7100,84%5260,88%
Barclays Bank Ireland Plc76 660 5060,78%6221,04%
DNB Bank ASA72 366 7460,74%6471,08%
UBS Europe SE57 699 2060,59%1 2182,03%
J.P. Morgan AG44 830 6020,46%1 1301,89%
Danske Bank A/S22 111 2670,23%2000,33%
Pareto Securities13 159 2610,13%500,08%
Susquehanna International Securities Ltd12 424 1050,13%460,08%
Goldman Sachs Bank Europe SE8 467 7530,09%360,06%
Jyske Bank A/S6 366 0880,06%330,06%
Credit Suisse Sec. Soc. de Valores, S.A4 939 0880,05%390,07%
SkandiaBanken AB4 198 6070,04%1090,18%
Erik Penser Bank AB3 804 8570,04%660,11%
Aktieinvest FK AB3 286 8960,03%460,08%
Virtu Financial Ireland Limited2 611 3590,03%1230,21%
Instinet Germany GMBH2 424 1040,02%130,02%
ABN AMRO Clearing Bank N.V.2 149 0890,02%340,06%
Kepler Cheuvreux SA1 453 2370,01%90,02%
Sydbank A/S1 266 9410,01%50,01%
BofA Securities Europe SA1 099 6790,01%50,01%
Société Générale S.A.834 8250,01%70,01%
Deutsche Bank AG610 3300,01%80,01%
IBKR Financial Services AG385 9110,00%120,02%
Citigroup Global Markets Europe AG143 7380,00%20,00%
Mangold Fondkommission AB100 4070,00%10,00%
ABG Sundal Collier ASA
Ålandsbanken Abp
Bank Vontobel AG
Nyenburgh Holding B.V.
Arctic Securities AS
Jump Trading Europe B.V.
Länsförsäkringar Bank AB
BNP Paribas Arbitrage SNC
MMX Trading B.V
RBC Capital Markets (Europe) GmbH
DRW Global Markets Ltd.
Goldman Sachs International
Tower Research Capital Europe BV
Instinet Europe Limited
Barclays Capital Securities Limited Plc
HSBC Bank plc
RBC Europe Limited
9 795 767 544 59 902 

Källa: Nasdaq OMX Nordic

”Obs! Dubbelräknade siffror. Siffrorna baseras på börshandel i respektive marknadssegment. ”

Fortsätt läsa
Annons
Klicka för att kommentera

Skriv en kommentar

Din e-postadress kommer inte publiceras. Obligatoriska fält är märkta *

Nyheter

Concerned about rising government debt? Bitcoin’s got you covered

Publicerad

den

Amid soaring US debt and Gold’s steady gains, Bitcoin has continued to deliver strong returns over the past 15 years. Its scarcity and decentralization make it a hedge that investors can’t ignore, providing new ways to pursue growth, security, and opportunity in an evolving financial landscape.

Amid soaring US debt and Gold’s steady gains, Bitcoin has continued to deliver strong returns over the past 15 years. Its scarcity and decentralization make it a hedge that investors can’t ignore, providing new ways to pursue growth, security, and opportunity in an evolving financial landscape.

Investors can’t ignore the corporate world’s big bet on Ethereum

Ethereum is stealing the spotlight, as public companies have accumulated over 4.4 million ETH, worth nearly $19 billion, in the past few months. This treasury boom is outpacing Bitcoin’s early adoption and redefining how Wall Street approaches digital assets.

The rise of Hyperliquid: DeFi’s record-breaking powerhouse

Hyperliquid is making waves in DeFi perpetuals by setting new records, leading trading volumes, and propelling its token to all-time highs. Backed by market volatility, high-performance infrastructure, and concentrated liquidity, the platform continues to draw investors and assert its market dominance.

Research Newsletter

Each week the 21Shares Research team will publish our data-driven insights into the crypto asset world through this newsletter. Please direct any comments, questions, and words of feedback to research@21shares.com

Disclaimer

The information provided does not constitute a prospectus or other offering material and does not contain or constitute an offer to sell or a solicitation of any offer to buy securities in any jurisdiction. Some of the information published herein may contain forward-looking statements. Readers are cautioned that any such forward-looking statements are not guarantees of future performance and involve risks and uncertainties and that actual results may differ materially from those in the forward-looking statements as a result of various factors. The information contained herein may not be considered as economic, legal, tax or other advice and users are cautioned to base investment decisions or other decisions solely on the content hereof.

Fortsätt läsa

Nyheter

N100 ETF följer det amerikanska Nasdaq 100 indexet

Publicerad

den

iShares NASDAQ 100 Swap UCITS ETF USD (Acc) (N100 ETF) med ISIN IE0001ZFMLN7, försöker följa Nasdaq 100®-indexet. Nasdaq 100®-indexet spårar ett urval av 100 aktier valda bland icke-finansiella aktier noterade på NASDAQ-börsen.

iShares NASDAQ 100 Swap UCITS ETF USD (Acc) (N100 ETF) med ISIN IE0001ZFMLN7, försöker följa Nasdaq 100®-indexet. Nasdaq 100®-indexet spårar ett urval av 100 aktier valda bland icke-finansiella aktier noterade på NASDAQ-börsen.

Den börshandlade fondens TER (total cost ratio) uppgår till 0,20 % p.a. ETFen replikerar det underliggande indexets prestanda syntetiskt med en swap. Utdelningarna i ETFen ackumuleras och återinvesteras.

iShares NASDAQ 100 Swap UCITS ETF USD (Acc) är en mycket liten ETF med 4 miljoner euro under förvaltning. Denna ETF lanserades den 3 oktober 2024 och har sin hemvist i Irland.

Varför N100?

Exponering mot 100 av de största amerikanska och internationella icke-finansiella aktierna noterade på NASDAQ-börsen.

Exponering för företag inom stora industrigrupper inklusive hårdvara och mjukvara, telekommunikation, detaljhandel/grossisthandel och bioteknik.

Använd i din portfölj för att söka tillväxt på medellång till lång sikt även om fonden också kan vara lämplig för kortsiktig exponering mot index.

Investeringsmål

Fonden strävar efter att uppnå avkastning på din investering, genom en kombination av kapitaltillväxt och inkomst på fondens tillgångar, vilket återspeglar den totala nettoavkastningen för NASDAQ 100-indexet (”Indexet”).

Handla N100 ETF

iShares NASDAQ 100 Swap UCITS ETF USD (Acc) (N100 ETF) är en börshandlad fond (ETF) som handlas på London Stock Exchange.

London Stock Exchange är en marknad som få svenska banker och nätmäklare erbjuder access till, men DEGIRO gör det.

Börsnoteringar

BörsValutaKortnamn
Euronext AmsterdamUSDNASQ
London Stock ExchangeGBPN100

Största innehav

KortnamnNamnSektorVikt (%)ISINValuta
XNSXNASDAQ 100 GROSS INDEX IN USDOther99.34USD
FTNTFORTINET INCInformationsteknologi4.92US34959E1091USD
AMZNAMAZON COM INCSällanköpsvaror3.95US0231351067USD
EPAMEPAM SYSTEMS INCInformationsteknologi3.81US29414B1044USD
TSLATESLA INCSällanköpsvaror3.79US88160R1014USD
GDDYGODADDY INC CLASS AInformationsteknologi3.49US3802371076USD
PYPLPAYPAL HOLDINGS INCFinans3.32US70450Y1038USD
ADSKAUTODESK INCInformationsteknologi3.31US0527691069USD
NFLXNETFLIX INCKommunikation3.30US64110L1061USD
CDNSCADENCE DESIGN SYSTEMS INCInformationsteknologi3.28US1273871087USD

Innehav kan komma att förändras

Fortsätt läsa

Nyheter

IncomeShares Monthly Investor Update – August 2025

Publicerad

den

IncomeShares passed three milestones in August. Assets under management climbed to almost $66 million, cumulative fund flows topped $72 million, and turnover across London and Xetra listings reached over $27 million. Palantir paid the highest annualised distribution yield at 57.11%. The sections below break the numbers down in more detail.

IncomeShares passed three milestones in August. Assets under management climbed to almost $66 million, cumulative fund flows topped $72 million, and turnover across London and Xetra listings reached over $27 million. Palantir paid the highest annualised distribution yield at 57.11%. The sections below break the numbers down in more detail.

Cumulative fund flows

Fund flows track how much money investors put into or take out of IncomeShares ETPs (exchange-traded products). Positive flows mean more money coming in than going out – a sign of demand for the products.

Flows have risen every month this year. In January, they stood at $13.7 million. By the end of August, they reached $72.4 million. That’s over $8 million of new money added in August alone – the biggest increase since May.

Trading turnover

Turnover is the total dollar value of IncomeShares ETPs bought and sold on the exchanges. Higher turnover means more activity and liquidity for investors.

Turnover reached $27.3 million in August – the highest on record and more than double January’s $13.0 million. London listings (USD and GBP combined) made up $14.2 million, with Xetra listings close behind at $13.1 million. Both exchanges have seen steady increases through 2025, showing rising interest in income options strategies across the board.

Note: Figures use IDC FX rates as of the August month-end to convert GBP and EUR into USD. We apply the same August rates to all prior months to compare turnover on a like-for-like basis.

Assets under management (AUM)

AUM is the total value of assets held across all IncomeShares ETPs. It grows when new investors buy in, or when the underlying assets rise in value.

AUM grew from $13.8 million in January to $65.8 million at the end of August. It was also $8 million more than in July. Steady inflows and consistent income distributions are helping the product range build scale.

Distribution yields

Distribution yields represent the annualised income paid to investors as a percentage of the current NAV (net asset value), based on the latest month’s yield. IncomeShares ETPs aim to generate this income from selling options. Yields change each month depending on strategy performance and market volatility.

Annualised August yields (ranked highest to lowest):

• Palantir Options ETP (PLTY): 57.11%

• Nasdaq 100 Options ETP (QQQY): 46.44%

• Coinbase Options ETP (COIY): 43.60%

• AMD Options ETP (AMDY): 41.43%

• Tesla Options ETP (TSLI): 40.97%

• Broadcom Options ETP (AVGY): 40.96%

• MicroStrategy Options ETP (MSTY): 37.61%

• Alibaba Options ETP (BABY): 35.90%

• S&P 500 Options ETP (SPYY): 32.95%

NVIDIA Options ETP (NVDI): 28.42%

Alphabet Options ETP (GOOI): 18.15%

Magnificent 7 Options ETP (MAGO): 16.87%

Apple Options ETP (AAPPY): 15.55%

20+ Year Treasury Options ETP (TLTY): 12.38%

Amazon Options ETP (AMZI): 12.00%

Silver+ Yield Options ETP (SLVY): 11.56%

Meta Options ETP (METY): 11.32%

Gold+ Yield Options ETP (GLDI): 6.74%

Microsoft Options ETP (MSFY): 6.54%

Our Palantir ETP topped the list with an annualised yield of 57.11% for August, up from 30.57% in July. The stock was volatile in August, trading between $142 and $190. That wider range increased option premiums, which boosted the ETP’s yield. The ETP sells put options on Palantir stock and holds shares – the strategy used for all our single stock ETPs and the Magnificent 7 product.

The Nasdaq 100 ETP paid an annualised yield of 46.44% in August, up slightly from 44.52% in July. At the other end, Gold+ and Microsoft stayed below 7%, reflecting relatively calmer conditions in their underlying assets.

The table below shows the annalised distribution yields for all IncomeShares ETPs so far this year. Note that the bottom eight ETPs launched in late June, so they only have yields for July and August.

Key takeaways

• Fund flows climbed to $72.4 million, with August adding more than $8 million.

• Turnover hit a record $27.3 million, split almost evenly between London and Xetra.

• Palantir topped the yield table at 57%, with Nasdaq 100 and Coinbase also paying above 40%.

Fortsätt läsa

21Shares

Prenumerera på nyheter om ETFer

* indicates required

21Shares

21Shares

Populära