
Nyheter
Oljesektorn är inte billig trots prisfallet på olja


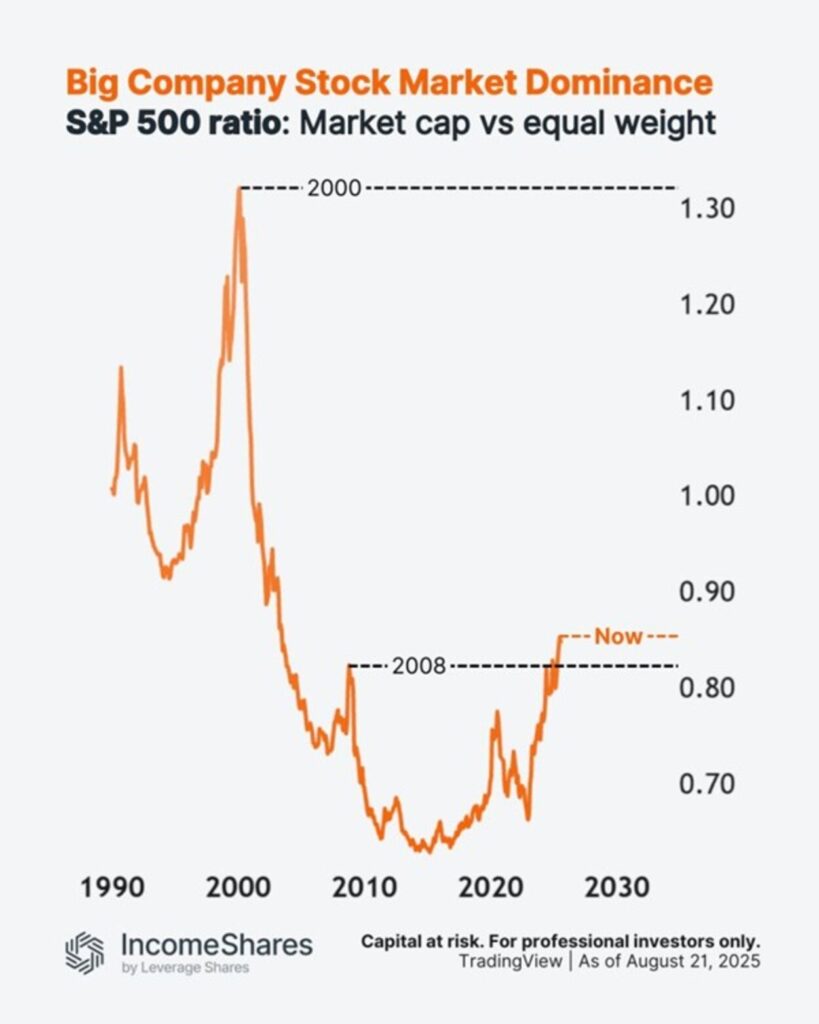
Stora företag dominerar den amerikanska aktiemarknaden mer än 2008 – men mindre än under dotcom-dagarna.
Detta diagram delar S&P 500-indexet (viktat efter börsvärde) med dess likaviktade version.
När kvoten stiger bär större aktier (större börsvärden) indexet mer.
Kvoten är nu högre än 2008 – men mycket lägre än toppen år 2000.
Då var ledarskapet en blandning av teknikjättar som Microsoft, Cisco och Intel, plus tungviktare från gamla ekonomier som General Electric och Walmart.
Idag är ledarskapet mer tekniktungt – med Mag 7-aktierna som utgör över 30 % av S&P 500.
Följ IncomeShares EU för marknadsinsikter.


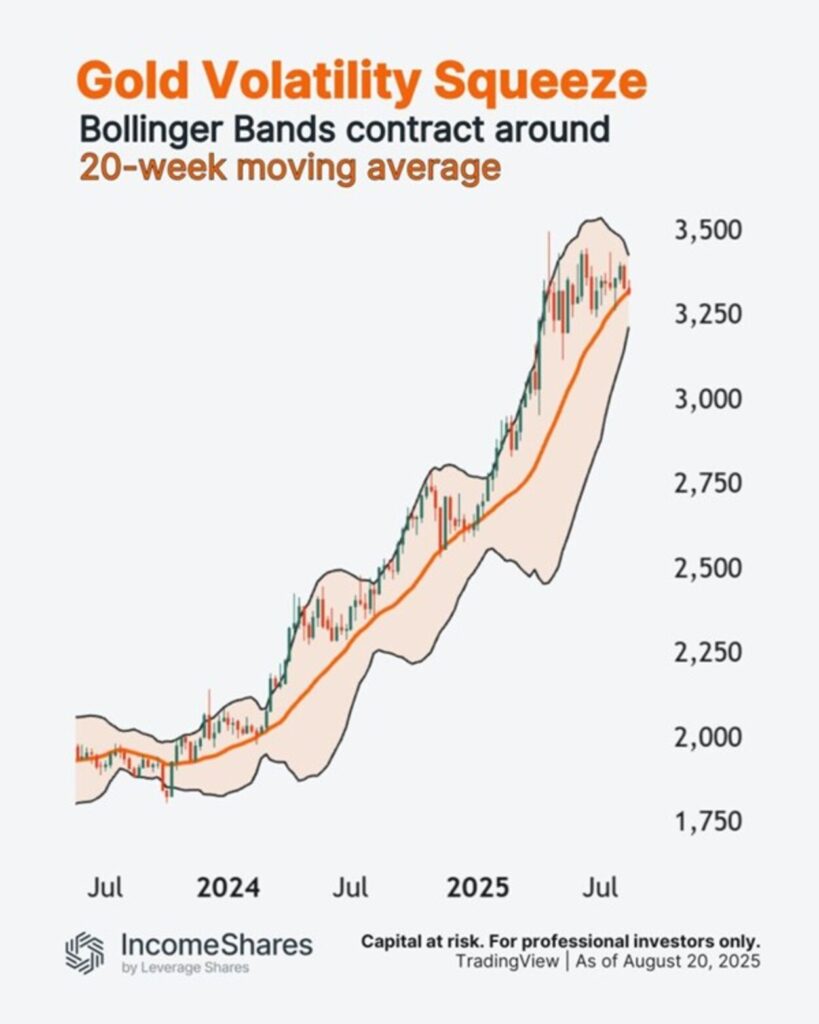
Under hela denna period har guldpriset konsekvent funnit stöd i det mellersta Bollingerbandet – det 20-veckors glidande medelvärdet. Varje gång volatiliteten sjönk, pressades de yttre banden samman, och nästa ben högre följde (när volatiliteten återvände).
Vi ser nu samma upplägg igen.
Trenderna håller i sig tills de inte gör det längre.
IncomeShares Gold+ Yield Options ETP (YGLD) innehar guld och säljer köpoptioner mot det. Strategin syftar till att generera månatliga intäkter från köpoptionerna, samtidigt som man behåller en viss exponering mot guldpriset.
Följ IncomeShares EU för marknadsinsikter.


Stora företag dominerar den amerikanska aktiemarknaden

FESE ETF investerar i hållbara obligationer från emerging markets

Guldpriset har stigit med cirka 70 % under de senaste två åren.

ZINS ETF köper och förvaltar statsobligationer aktivt

Nasdaq Stockholm välkomnar Xtrackers by DWS som ny ETF-leverantör

Vilken ETF för Europas försvarsindustri är bäst?

De börshandlade fonderna som lockade mest i sommarvärmen

ETFer som ger exponering mot börsintroduktioner

Fastställd utdelning i MONTDIV juli 2025

Månadsutdelande ETFer uppdaterad med två börshandlade fonder från AXA
-
 Nyheter4 veckor sedan
Vilken ETF för Europas försvarsindustri är bäst?
-
 Nyheter3 veckor sedan
De börshandlade fonderna som lockade mest i sommarvärmen
-
 Nyheter3 veckor sedan
ETFer som ger exponering mot börsintroduktioner
-
 Nyheter4 veckor sedan
Fastställd utdelning i MONTDIV juli 2025
-
 Nyheter3 veckor sedan
Månadsutdelande ETFer uppdaterad med två börshandlade fonder från AXA
-
 Nyheter4 veckor sedan
Bitcoin + Gold: The power couple for smarter portfolios
-

 Nyheter3 veckor sedan
Bitcoin likes to dance to its own beat, not to tech stock tunes
-

 Nyheter3 veckor sedan
TMX VettaFis Jane Edmondson om nya försvars-ETFer