Följ oss

Nyheter

Nordiska ETFmarknaden mars 2016

Publicerad

den

drygt 20 Mdr SEK i februari), varav ca 10,6 Mdr SEK omsattes i den svenska marknaden. Av den totala nordiska ETF-omsättningen

Nordiska ETFmarknaden mars 2016 Under mars uppgick ETF-handeln till ca 13,7 Mdr SEK (drygt 20 Mdr SEK i februari), varav ca 10,6 Mdr SEK omsattes i den svenska marknaden. Av den totala nordiska ETF-omsättningen var Xacts marknadsandel ca 97%. Av den totala börsomsättningen i Sverige i mars svarade ETF-handeln för ca 3,4%.

Läs mer här

XACT1

(Klicka på bilden för att göra den större)

XACT2

(Klicka på bilden för att göra den större)

Viktig information

Xacts börshandlade fonder är juridiskt och skattemässigt klassade som fonder. Xacts börshandlande fonder med säte i Sverige förvaltas av Handelsbanken Fonder AB och står under Finansinspektionens tillsyn. De fonder som har sitt säte i Norge förvaltas av Handelsbanken Kapitalforvaltning AS och står under tillsyn av Finanstilsynet.

En fonds historiska avkastning är ingen garanti för framtida avkastning. De pengar som placeras i en fond kan både öka och minska i värde och det är inte säkert att du får tillbaka hela det insatta kapitalet. På www.xact.se finner du informationsbroschyrer och faktablad.

Hävstångsfonder uppför sig annorlunda jämfört med fonder utan hävstång. Hävstångsfonder är därför endast lämpliga som investering om du förstår egenskaperna hos hävstångsprodukter, förstår effekterna av daglig ombalansering samt arbetar aktivt med och kontinuerligt ser över din placeringsportfölj, då hävstången gör att värdet ändras snabbare än i motsvarande placeringar utan hävstång.

Källor: Bloomberg, NasdaqOMX, Burgundy, Oslo Börs, Fondbolagens Förening samt respektive utgivares hemsida.

Total omsättning avser handelsplatserna NasdaqOMX för både Stockholm och Helsingfors, Burgundy och Oslo Börs.

Att en ETF är korsnoterad innebär att den har sin primärnotering på en annan börs.

AUM står för Assets under Management.

Xacts ETF:er rapporteras in under kategorin Aktiefonder i statistiken hos Fondbolagens Förening.

Licensvillkor:

XACT OMXS30™, XACT OMXSB™ och XACT Norden 30, (the “Products”) are not sponsored, endorsed, sold or promoted by the NASDAQ OMX Group, Inc. or its affiliates (NASDAQ OMX, with its affiliates, are referred to as the “Corporations”). The Corporations have not passed on the legality or suitability of, or the accuracy or adequacy of descriptions and disclosures relating to, the Products. The Corporations make no representation or warranty, express or implied to the owners of the Products or any member of the public regarding the advisability of investing in securities generally or in the Products particularly, or the ability of the OMXS30™, OMXSB™ and VINX30™ (the “Index”) to track general stock market performance. The Corporations’ only relationship to the party which has, or parties which have, obtained a license to use the Indices in respect of the Products (“Licensee”) is in the licensing of the NASDAQ®, NASDAQ OMX®, OMX® and VINX30™ registered trademarks, and certain trade names of the Corporations and the use of the Index which is determined, composed and calculated by NASDAQ OMX without regard to Licensee or the Products. NASDAQ OMX has no obligation to take the needs of the Licensee or the owners of the Products into consideration in determining, composing or calculating the Index. The Corporations are not responsible for and have not participated in the determination of the timing of, prices at, or quantities of the Products to be issued or in the determination or calculation of the equation by which the Products is to be converted into cash. The Corporations have no liability in connection with the administration, marketing or trading of the Products. THE CORPORATIONS DO NOT GUARANTEE THE ACCURACY AND/OR UNINTERRUPTED CALCULATION OF THE INDICES (AS DEFINED) OR ANY DATA INCLUDED THEREIN. THE CORPORATIONS MAKE NO WARRANTY, EXPRESS OR IMPLIED, AS TO RESULTS TO BE OBTAINED BY LICENSEE, OWNERS OF THE PRODUCTS, OR ANY OTHER PERSON OR ENTITY FROM THE USE OF THE INDICES OR ANY DATA INCLUDED THEREIN. THE CORPORATIONS MAKE NO EXPRESS OR IMPLIED WARRANTIES, AND EXPRESSLY DISCLAIM ALL WARRANTIES OF MERCHANTABILITY OR FITNESS FOR A PARTICULAR PURPOSE OR USE WITH RESPECT TO THE INDICES OR ANY DATA INCLUDED THEREIN. WITHOUT LIMITING ANY OF THE FOREGOING, IN NO EVENT SHALL THE CORPORATIONS HAVE ANY LIABILITY FOR ANY LOST PROFITS OR SPECIAL, INCIDENTAL, PUNITIVE, INDIRECT, OR CONSEQUENTIAL DAMAGES, EVEN IF NOTIFIED OF THE POSSIBILITY OF SUCH DAMAGES.

XACT Norden 30 är inte i något avseende garanterad, godkänd, emitterad eller understödd av OMX AB (publ) (”OMX”) eller Oslo Børs ASA (”OB”) och OMX eller OB lämnar inga, vare sig uttryckliga eller implicita, garantier med avseende på de resultat som användningen av VINX30™ index kan ge upphov till eller med avseende på värdet av VINX30™ index vid viss tidpunkt. VINX30™ index sammanställs och beräknas av en indexberäknare på uppdrag av OMX och OB. OMX eller OB respektive indexberäknaren skall i intet fall vara ansvarig för fel i VINX30™ index. OMX eller OB respektive indexberäknaren skall ej heller vara skyldig att meddela eller offentliggöra eventuella fel i VINX30™ index. VINX™ och VINX30™ index är varumärken tillhörande OMX och OB och används enligt licens från OMX eller OB.

XACT OBX är inte i något avseende garanterad, godkänd, emitterad eller understödd av Oslo Børs ASA (”Oslo Børs”) och Oslo Børs lämnar inga, vare sig uttryckliga eller implicita, garantier med avseende på de resultat som användningen av Oslo Børs index kan ge upphov till eller med avseende på värdet av nämnda index vid viss tidpunkt. Vidare ger Oslo Børs inga garantier för handeln eller användarvänlighet för ett bestämt ändamål eller användning vad gäller Oslo Børs index eller Oslo Børs varumärken. Oslo Børs index sammanställs och beräknas av en indexproducent som beräknar indexen på Oslo Børs vägnar och Oslo Børs ger inga garantier för noggrannheten och/eller fullständigheten av Oslo Børs index eller data som ingår i dessa. Oslo Børs och den som beräknar index skall i intet fall (varken vid oaktsamhet eller annat) vara ansvarig för fel i Oslo Børs index, och skall inte heller vara skyldig att meddela eller offentliggöra eventuella fel i dessa index. OBX®, OSEBX®, OSEFX®, OSEAX® och GFBX® är varumärken tillhörande Oslo Børs och används av Handelsbanken Fondforvaltning AS enligt licens från Oslo Børs.
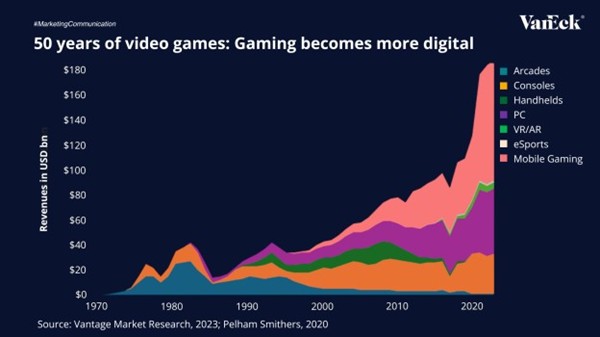
Fortsätt läsa
Annons
Klicka för att kommentera

Skriv en kommentar

Din e-postadress kommer inte publiceras. Obligatoriska fält är märkta *

Nyheter

Valour lanserar Internet Computer (ICP) och Toncoin (TON) ETP i Norden

Publicerad

den

Valour lanserar tre banbrytande börshandlade produkter (“ETPs”) inklusive Valour Internet Computer (ICP) ETP, Valour Toncoin (TON) ETP och Valour Chainlink (LINK) ETP, som markerar betydande milstolpar i det nordiska investeringslandskapet.

Valour lanserar tre banbrytande börshandlade produkter (“ETPs”) inklusive Valour Internet Computer (ICP) ETP, Valour Toncoin (TON) ETP och Valour Chainlink (LINK) ETP, som markerar betydande milstolpar i det nordiska investeringslandskapet.

  • Nordens första i sitt slag: Valour Internet Computer (ICP) ETP och Valour Toncoin (TON) ETP är de första erbjudandena i sitt slag i Norden, som ger investerare oöverträffad tillgång till innovativa ekosystem.
  • Förenklad tillgång till banbrytande tillgångar: Handel med alla tre ETPer påbörjades den 10 maj 2024, med en förvaltningsavgift på 1,9 %. Dessa ETPer möjliggör sömlös tillgång till banbrytande digitala tillgångar, och erbjuder investerare förenklade möjligheter att engagera sig i den transformativa potentialen hos ICP, TON och LINK.
  • Toncoin (TON) Analystäckning: DeFi Technologies dotterbolag, Reflexivity Research, ett ledande forskningsföretag som specialiserat sig på att skapa högkvalitativa, djupgående forskningsrapporter för bitcoin- och kryptovalutaindustrin för att ge investerare värdefulla insikter, har initierat analystäckning om TON.

Valour som ger förenklad tillgång till digitala tillgångar, har lanserat tre ETPer. Bland dessa erbjudanden finns Valour Internet Computer (ICP) ETP och Valour Toncoin (TON) ETP, den första i sitt slag i Norden. Dessa åtföljs av Valour Chainlink (LINK) ETP, som ger förenklad tillgång till avancerade digitala tillgångar.

Handeln med alla tre ETPerna inleddes den 10 maj 2024, med en förvaltningsavgift på 1,9 %.

Valour Internet Computer (ICP) ETP

Valour Internet Computer (ICP) SEK ETP (ISIN: CH1213604510) erbjuder investerare oöverträffad tillgång till framtiden för webbutveckling genom att spåra priset på ICP, den infödda token som driver Internetdatorns ekosystem. Med sitt unika fokus på enkelhet och säkerhet kan investerare sömlöst engagera sig med ICP genom sina traditionella bank- eller mäklarkonton. ICP har ett börsvärde på 5,5 miljarder dollar och rankas tjugofjärde bland alla kryptovalutor globalt.

Internetdatorprojektet banar väg för en ny era av webbutveckling genom att skapa en decentraliserad och skalbar internetinfrastruktur. Genom att göra det möjligt för smarta kontrakt att köras direkt på sitt nätverk, eliminerar Internetdatorn behovet av traditionella serverbaserade arkitekturer, vilket inleder ett paradigmskifte inom webbutveckling. Detta innovativa tillvägagångssätt säkerställer större säkerhet, effektivitet och tillgänglighet för både utvecklare och användare.

Valour Toncoin (TON) ETP

Valour Toncoin (TON) SEK ETP (ISIN: CH1161139600) gör det möjligt för investerare att få tillgång till Toncoin, TONs infödda token, sömlöst och säkert via deras traditionella bank- eller mäklarkonto. Toncoin, med sitt fokus på snabba transaktionshastigheter och låga avgifter, ger en effektiv lösning för både inhemska och internationella betalningar, vilket gör det till ett attraktivt alternativ för olika finansiella tillämpningar. TON har ett börsvärde på $23,25 miljarder och rankas som nionde bland alla kryptovalutor globalt.

Toncoin, den infödda symbolen för TON, erbjuder ett robust och effektivt sätt att utbyta värde, som syftar till att effektivisera betalningsprocesser över olika finansiella landskap. Med sin betoning på snabba transaktionshastigheter och minimala transaktionsavgifter står Toncoin som en lovande lösning för både individer och företag som söker sömlösa betalningsupplevelser.

Företaget är också glada att meddela att dess dotterbolag, Reflexivity Research, ett ledande forskningsföretag som specialiserat sig på att skapa högkvalitativa, djupgående forskningsrapporter för bitcoin- och kryptovalutaindustrin för att ge investerare värdefulla insikter, har initierat forskningstäckning om TON. Rapporten finns här.

Valour Chainlink (LINK) ETP

Valour Chainlink (LINK) SEK (ISIN: CH1161139592) ETP kommer att göra det möjligt för investerare att få exponering mot LINK, enkelt och säkert, via sin bank eller mäklare. LINK har ett börsvärde på 13,63 miljarder dollar och rankas som artonde bland alla kryptovalutor globalt.

Chainlink, känt som ett decentraliserat orakelnätverk, spelar en avgörande roll för att möjliggöra smarta kontrakt på blockchain-plattformar för att säkert interagera med verklig data. Genom att fungera som en brygga mellan blockchain-baserade smarta kontrakt och externa datakällor, underlättar Chainlink genomförandet av förtroendefria och manipuleringssäkra avtal. Dess decentraliserade karaktär säkerställer tillförlitligheten och integriteten hos data, vilket förbättrar effektiviteten och säkerheten för blockchain-transaktioner.

”Valour förblir orubbligt i vårt åtagande att erbjuda investerare ett brett utbud av investeringsmöjligheter för digitala tillgångar”, säger Olivier Roussy Newton, VD för DeFi Technologies. ”Inkluderingen av dessa banbrytande ETPer i vår produktlinje understryker vårt engagemang för att leverera innovativa lösningar som uppfyller de växande behoven hos investerare i det digitala tillgångsområdet Vi är glada över att få täckning från vårt nyligen förvärvade dotterbolag, Reflexivity Research, för att sammanfalla med produktlanseringarna, vilket ger investerare värdefulla insikter och förbättrar deras förståelse för marknadslandskapet.

”Våra unika ETP-erbjudanden i Norden befäster vår ledande position som emittenten med det bredaste utbudet av produkter”, säger Johanna Belitz, Valours försäljningschef, Norden. ”När efterfrågan på altcoins ökar, förväntar vi oss ivrigt mottagandet av våra tre nya erbjudanden i regionen.”

Valour fortsätter att leda ansvaret för att driva innovation inom det digitala tillgångsområdet och utöka sitt produktutbud för att tillgodose de växande behoven hos investerare i Norden. Utöver Valour Toncoin (TON), Internet Computer (ICP) och Chainlink (LINK) ETPerna planerar Valour att introducera ett brett utbud av digitala tillgångsinvesteringsprodukter under de kommande månaderna, vilket ytterligare förbättrar tillgängligheten och bekvämligheten för traditionella investerare.

Handla Valours produkter

Valours produkter är europeiska börshandlade produkter som handlas på bland annat Nordic Growth Market.

Det betyder att det går att handla andelar i dessa ETPer genom de flesta svenska banker och Internetmäklare, till exempel DEGIRONordnet, Aktieinvest och Avanza

Fortsätt läsa

Nyheter

INSU ETF ger exponering mot amerikanska försäkringsbolag

Publicerad

den

Invesco Dow Jones US Insurance UCITS ETF Acc (INSU ETF), med ISIN-nummer IE0007UJ6IE0, försöker spåra Dow Jones U.S. Select Insurance-index. Dow Jones U.S. Select Insurance-index följer den amerikanska försäkringssektorn.

Invesco Dow Jones US Insurance UCITS ETF Acc (INSU ETF), med ISIN-nummer IE0007UJ6IE0, försöker spåra Dow Jones U.S. Select Insurance-index. Dow Jones U.S. Select Insurance-index följer den amerikanska försäkringssektorn.

Denna börshandlade fonds TER (total cost ratio) uppgår till 0,35 % p.a. Invesco Dow Jones US Insurance UCITS ETF Acc är den enda ETF som följer Dow Jones U.S. Select Insurance-index. ETFen replikerar det underliggande indexets prestanda genom full replikering (köper alla indexbeståndsdelar). Utdelningarna i ETFen ackumuleras och återinvesteras i den börshandlade fonden.

Denna ETF lanserades den 10 juli 2023 och har sin hemvist i Irland.

Produktbeskrivning

Invesco Dow Jones US Insurance UCITS ETF Acc syftar till att uppnå den totala nettoavkastningen för Dow Jones U.S. Select Insurance Index (”Referensindexet”), minus påverkan av avgifter.

Referensindex är ett börsvärdevägt index som representerar resultatet för stora, medelstora och små försäkringsbolag på den amerikanska marknaden. Referensindexet är konstruerat från Dow Jones U.S. Broad Stock Market Index (”Moderindex”) genom att använda indexleverantörens kriterier för att inkludera värdepapper som klassificeras som Full Line Insurance, Property & Casualty Insurance och Livförsäkringsbolag enligt S&P Dow Jones industriklassificeringssystem. Värdepapper måste också ha ett floatjusterat börsvärde på minst 500 miljoner USD för att komma in i referensindexet och minst 250 miljoner USD för att vara kvar i referensindexet.

Fonden strävar efter att uppnå sitt mål genom att köpa och hålla, så långt det är möjligt och praktiskt, alla värdepapper i referensindex i sina respektive vikter. Fonden kommer att sträva efter att balansera om sina innehav i linje med förändringar i referensindexet, som ombalanseras på kvartalsbasis.

Denna ETF hanteras passivt.

Handla INSU ETF

Invesco Dow Jones US Insurance UCITS ETF Acc (INSU ETF) är en börshandlad fond (ETF) som handlas på London Stock Exchange.

London Stock Exchange är en marknad som få svenska banker och nätmäklare erbjuder access till, men DEGIRO gör det.

Börsnoteringar

BörsValutaKortnamn
London Stock ExchangeGBXINSX
London Stock ExchangeUSDINSU

Största innehav

NamnISINVikt %
CHUBB LTD CHF24.15CH004432874511.56%
PROGRESSIVE CORP USD1US743315103910.28%
ARTHUR J GALLAGHER & CO USD1US36357610976.65%
AMERICAN INTERNATIONAL GROUP USD2.5US02687478496.06%
TRAVELERS COS INC/THE NPVUS89417E10915.36%
METLIFE INC USD0.01US59156R10864.93%
PRUDENTIAL FINANCIAL INC USD0.01US74432010224.75%
AFLAC INC USD0.1US00105510284.75%
ALLSTATE CORP USD0.01US02000210144.16%
ARCH CAPITAL GROUP LTD USD0.01BMG0450A10534.14%

Innehav kan komma att förändras

Fortsätt läsa

Nyheter

Crypto Market Compass | 13. May 2024

Publicerad

den

Crypto Market Compass | 13. May 2024 Bitcoin continues to consolidate above 60k USD as the market is gradually entering dull seasonality from June onwards

• Bitcoin continues to consolidate above 60k USD as the market is gradually entering dull seasonality from June onwards

• Our in-house “Cryptoasset Sentiment Indicator” continues to hover around neutral levels in sentiment

• Unprofitable BTC miners are coming under pressure following the Halving judging by the recent decline in network hash rate

Chart of the Week

Performance

Last week, cryptoassets underperformed traditional financial assets like equities or Gold as Bitcoin continued to consolidate above 60k USD.

It appears as if the market is currently lacking new positive catalysts after the US and Hong Kong spot ETF approvals and the Bitcoin Halving. Moreover, we are gradually entering dull seasonality from June onwards as the summer months have historically shown below-average returns for Bitcoin in the past.

Moreover, increasing US recession risks towards the summer as outlined in our latest monthly report could provide a temporary headwind for Bitcoin and cryptoassets as our own analyses still imply that Bitcoin’s performance continues to be dominated by global growth expectations.

Our base case is that the market continues to consolidate until macro risks have cleared/materialized and the positive performance effects from the Halving start to kick in around August 2024 as outlined in our special report about the Halving.

In the meantime, unprofitable BTC miners could come under pressure and there seems to be first evidence of that happening judging by the recent decline in network hash rate (Chart-of-the-Week). More specifically, the 7-day moving average of
Bitcoin’s hash rate has already declined by around -8% since the Halving took place on the 20 th of April.

In addition, last week also saw the 4th negative difficulty adjustment this year as it took BTC miners on average longer than 10 minutes to find the correct hash for a block. This is additional evidence that the network hash rate has been reduced.

In fact, the average BTC miner’s revenue has declined significantly as both the block subsidy and transaction fees have declined significantly since the Halving. Daily aggregate miner revenues have dropped to around ~28 mn USD, down from ~72 mn USD at the time of the Halving. That being said, there is no sign of significant distribution of bitcoins by BTC miners yet based on aggregate BTC miner balances.

There have been no significant transfers from miner wallets to exchange wallets either more recently.

Increasing selling pressure by BTC miners could be a headwind in the short term.

Furthermore, selling pressure could also materialize via fund outflows from crypto ETPs as traditional investors could distribute some of their crypto holdings for liquidity reasons in case of increasing US recession risks mentioned above.

This is something that we will continue to monitor over the coming weeks.

On a positive note, overall exchange inflows that are usually a good barometer for overall selling pressure have abated more recently and neither short- nor long-term holders are currently distributing coins in a significant way. Besides, global crypto ETPs still saw net inflows overall over the past week despite ongoing GBTC outflows in the US.

In general, among the top 10 crypto assets, Toncoin, BNB, and Solana were the relative outperformers.

However, overall altcoin outperformance vis-à-vis Bitcoin remained relatively low, with only around 40% of our tracked altcoins managing to outperform Bitcoin on a weekly basis.

Sentiment

Our in-house “Cryptoasset Sentiment Index” continues to hover around neutral levels in sentiment. The more recent correction has only led to a slight decrease in sentiment so far.

At the moment, 5 out of 15 indicators are above their short-term trend.

Last week, there were significant reversals to the downside in global crypto ETP fund flows and the Crypto Fear & Greed Index.

That being said, the Crypto Fear & Greed Index still signals ”Greed” again as of this morning.

Performance dispersion among cryptoassets has continued to remain low.

Altcoin outperformance vis-à-vis Bitcoin was still subdued, with around 40% of our tracked altcoins that have outperformed Bitcoin on a weekly basis. At the same time, Ethereum continued to underperform Bitcoin last week.

In general, increasing (decreasing) altcoin outperformance tends to be a sign of increasing (decreasing) risk appetite within cryptoasset markets.

Meanwhile, sentiment in traditional financial markets remains relatively elevated, judging by our own measure of Cross Asset Risk Appetite (CARA).

Fund Flows

Last week, we saw a slight reversal in global crypto ETPs with around +25.7 mn USD in net inflows, up from around -372.4 mn USD the week prior based on Bloomberg data.

Global Bitcoin ETPs saw net inflows of +92.5 mn USD of which +117.0 mn (net) were related to US spot Bitcoin ETFs alone. Hong Kong spot Bitcoin ETFs already experienced net outflows of around -40.9 mn USD last week according to data provided by Bloomberg.

The ETC Group Physical Bitcoin ETP (BTCE) also saw net outflows equivalent to -33.4 mn USD while the ETC Group Core Bitcoin ETP (BTC1) saw minor net inflows of +0.7 mn USD last week.

The Grayscale Bitcoin Trust (GBTC) continued to experience net outflows of approximately -171.1 mn USD last week while other major US spot Bitcoin ETFs were able to attract new capital, e.g. iShares’ IBIT with net inflows of around +48.2 mn USD.

In contrast to Bitcoin ETPs, Global Ethereum ETPs saw a decline in ETP flows last week, with net outflows of around -63.5 mn USD. This was mostly due to significant outflows from Hong Kong spot Ethereum ETFs that saw -46.5 mn USD in net outflows last week, according to data provided by Bloomberg.

In general, there seems to be an emerging pattern in crypto ETP fund flows that while global Bitcoin ETP flows continue to be dominated by US spot Bitcoin ETF flows, global Ethereum ETP fund flows are increasingly dominated by Hong Kong spot Ethereum ETF flows.

Meanwhile, the ETC Group Physical Ethereum ETP (ZETH) saw neither in- nor outflows (+/- 0 mn USD). The ETC Group Ethereum Staking ETP (ET32) experienced some net outflows (-1.5 mn USD) last week.

Besides, Altcoin ETPs ex Ethereum experienced only minor net inflows of around +5.7 mn USD last week.

Besides, Thematic & basket crypto ETPs experienced some net outflows of -9.0 mn USD, based on our calculations. The ETC Group MSCI Digital Assets Select 20 ETP (DA20) did experience neither in- nor outflows last week (+/- 0 mn USD).

Besides, the beta of global crypto hedge funds to Bitcoin over the last 20 trading days continued to increase to around 1.06. This implies that global crypto hedge funds have significantly increased their market exposure and have currently a slightly more than neutral exposure to Bitcoin.

On-Chain Data

As the market has rebounded from oversold levels at the beginning of May, on-chain data for Bitcoin remain somewhat mixed.

As mentioned above, unprofitable BTC miners could come under pressure and there seems to be first evidence of that happening judging by the recent decline in network hash rate (Chart-of-the-Week).

More specifically, the 7-day moving average of Bitcoin’s hash rate has already declined by around -8% since the Halving took place on the 20th of April.

In this context, the decline in active addresses to year-to-date lows appears to be somewhat concerning. On a positive note, overall network activity based on a variety of metrics still implies that Bitcoin’s network activity is still near all-time highs as the transaction count remains relatively high. This is not related to high inscription demand but related to genuine transaction demand.

Coming to Bitcoin’s hash rate, last week also saw the 4th negative difficulty adjustment this year as it took BTC miners on average longer than 10 minutes to find the correct hash for a block. This is additional evidence that the network hash rate has been reduced.

In fact, the average BTC miner’s revenue has declined significantly as both the block subsidy and transaction fees have declined significantly since the Halving. Daily aggregate miner revenues have dropped to around ~28 mn USD, down from ~72 mn USD at the time of the Halving.

That being said, there is no sign of significant distribution of bitcoins by BTC miners yet based on aggregate BTC miner balances. There have been no significant transfers from miner wallets to exchange wallets either more recently.

Increasing selling pressure by BTC miners could be a headwind in the short term.
Meanwhile, the increase in accumulation activity observed last week has started to decelerate a bit but is still comparatively high. Furthermore, whales continue to take coins off exchange on a net basis.

However, intraday net buying minus selling volumes on spot Bitcoin exchanges remained negative over the past week largely due to the deceleration in US spot Bitcoin ETF net inflows since March.

A renewed improvement in net buying volumes on spot exchanges is highly dependent on a resumption of higher flows into US and global Bitcoin ETP flows.

Futures, Options & Perpetuals

Last week, both BTC futures and perpetual open interest saw a slight increase in BTC-terms which seems to be related to a net increase in short open interest. In other words, BTC futures traders have started building up more downside exposure over the past week.

Meanwhile, both BTC short and long futures liquidations remained relatively low last week. The Bitcoin futures basis continued to move sideways last week. At the time of writing, the Bitcoin futures annualized basis rate stands at around 8.7% p.a.
Perpetual funding rates also remained slightly positive throughout the week.

Bitcoin options’ open interest decreased slightly last week as BTC option traders seem to have reduced their exposure of puts relative to calls. Relative put-call volume ratios remained well behaved last week.

However, the 25-delta BTC 1-month option skew increased slightly implying an increased demand for puts relative to calls.

BTC option implied volatilities have decreased slightly compared to the prior week. Implied volatilities of 1-month ATM Bitcoin options are currently at around 51.9% p.a., down from 53.1% p.a. the week prior.

Bottom Line

• Bitcoin continues to consolidate above 60k USD as the market is gradually entering dull seasonality from June onwards

• Our in-house “Cryptoasset Sentiment Indicator” continues to hover around neutral levels in sentiment

• Unprofitable BTC miners are coming under pressure following the Halving judging by the recent decline in network hash rate

To read our Crypto Market Compass in full, please click the button below:

This is not investment advice. Capital at risk. Read the full disclaimer

© ETC Group 2019-2024 | All rights reserved

Fortsätt läsa

Populära