Nyheter
Några av de bästa guldfonderna
Publicerad
9 månader sedanden
I och med att guldpriset stigit över 2 000 dollar per troy ounce har intresset för denna råvara ökat kraftigt i år. Addera en ökad volatilitet och en inflation som visserligen har sjunkit, men historiskt sett fortfarande ligger högt så finns det anledning att titta på denna råvara. Här tittar vi på några av de bästa guldfonderna på marknaden då dessa kan erbjuda ett sätt att skydda portföljer.
Att investera i ädelmetallen har länge setts som ett proaktivt skydd mot hög inflation och ekonomisk osäkerhet, och det finns gott om det just nu.
Inflationstakten har avtagit men är fortfarande högre än de flesta centralbankers mål. Dessa fortsätter att tackla inflationen genom att höja räntorna bromsar också ekonomin. Analytiker förutspår att tillväxten under 2024 kommer att bli trög på grund av den försenade effekten av räntehöjningarna.
Dessa händelser, såväl som ett fåtal finansinstituts fall under 2023 och i år, har fått försiktiga investerare att ompröva hur väl deras portföljer är skyddade mot risker inom banksektorn, vilket pressar upp priset på den gula metallen.
Uppåtgående rörelser i guldpriset indikerar att investerare, oroade över händelserna över Atlanten och i Europa, söker skydd av tillgångar i fristad när de försöker skydda sina portföljer från kursfall.
The Pure Gold Companys VD Josh Saul säger: ”Investerare är redan oroade över de ekonomiska utsikterna inför en fortsatt levnadskostnadskris, inflation, rädsla för lågkonjunktur och den obönhörliga geopolitiska situationen. En bankkollaps kan bara vara vändpunkten för vissa investerare som letar efter en fristad i stormen.”
Dessa faktorer har drivit guldpriserna högre, enligt det brittiska myntverket The Royal Mint. Den förutspår att efterfrågan på fysiskt guld kommer att fortsätta. Som sådan kan ägande av en eller två av de bästa guldfonderna hjälpa till att skydda din portföljavkastning.
Dzmitry Lipski, chef för fondanalys på Interactive Brokers, säger: ”Guldets historiska roll har varit en värdebevarare under den ekonomiska krisen. Det är allmänt accepterat att guld också kan användas som en inflationssäkring och därför är stigande inflation nödvändigt för att kostnaden för guld ska öka. Det beror på att guld prissätts i amerikanska dollar, så när varje dollar blir mindre värd krävs det fler av dem för att köpa samma mängd guld.
”Omvänt bör låg inflation och en stärkande US-dollar ses som negativt för guldpriserna”, tillägger han.
Hur investera i de bästa guldfonderna?
Så hur ska du lägga till guld till din portfölj? Ett alternativ är att fylla på med smycken eller köpa guldtackor, i form av fysiska mynt eller tackor. Det kommer att ge dig några fina glänsande prydnadssaker att hålla och beundra, men det kan vara dyrt och det finns oron för att förvara dem säkert.
Om du känner dig äventyrlig kan du köpa aktier i guldproducenter, företag som driver guldgruvor. Men dessa spårar ofta inte guldpriset så noga så att du inte får den bästa exponeringen, plus att du behöver oroa dig för att välja de bästa aktie- och handels- och plattformsavgifterna. Gruvdrift är en mycket cyklisk verksamhet som regelbundet går från högkonjunktur till högkonjunktur så den kan vara mycket volatil.
Josh Saul, VD för The Pure Gold Company säger, ”Guldfonder är lätta att investera i och mycket likvida, men de är hälften av en transaktion med en bank eller investeringsinstrument, så de kommer med motpartsrisk. Samtidigt är gruvaktier i sig kopplade till varandra, till företagets verksamhet och lönsamhet snarare än guldpriset.”
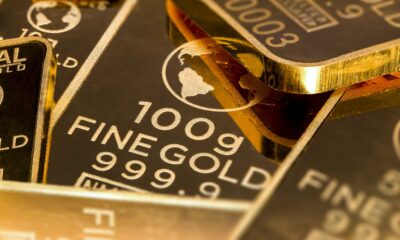
”I en tid då människor är oroliga för motparternas styrka eller integritet, minskar fysisk guldtackor den risken eftersom den ligger utanför banksystemet. Den kan också ha skatteförmåner (moms- och CGT-fri beroende på individuella omständigheter) som ökar dess värde som en investering”, tillägger Saul.
Guldfonder, det enkla sättet att investera i guld
Ett alternativ är att investera i en guldbörshandlad fond (ETF), vilket i Europa ofta blir en börshandlad råvara, en så kallad ETC. Det är en fond som syftar till att spåra guldpriset. EU tillåter inte ETFer som spårar en enskild råvara. Fonder som gör detta kallas ”exchange-traded commodities” (ETC). Skillnaden mellan en ETF och en ETC är försumbar, men ETFer som backas upp av fysiskt guld är ETCer, inte ETFer.
De mest enkla guldfonderna backas upp av fysiskt guld – de köper guldtackor och lagrar det i säkra valv. De mest komplicerade ETFerna använder derivat eller optioner för att ”hävstånga” din investering och förstora vinster. Men de kommer också att förstora förlusterna, så var försiktig. Hävstångsbaserade ETFer tenderar också att ha högre avgifter än de som backas upp av fysiskt guld. Så om du köper guld för att ge säkerhet bör du hålla dig borta från hävstångsfinansierade fonder. När du investerar i guldfonder är enkelhet nyckeln.
Förutom fonder som spårar priset på guld, finns det också fonder som investerar i guldproducenter, företag som driver guldgruvor. Men som nämnts ovan följer de inte priset på guld särskilt noga. Det fina med fysiska guldfonder är deras enkelhet och låga kostnad.
Namn | Kortnamn | Förvaltningskostnad | Summering |
Gold Bullion Securities | GG9B | 0.40% | Fysiskt uppbackad guldfond |
WisdomTree Physical Gold | VZLD | 0.39% | Fysiskt uppbackad guldfond denominerade i GBP |
WisdomTree Physical Gold | PHAU | 0.39% | Fysiskt uppbackad guldfond denominerade i USD |
WisdomTree Physical Swiss Gold | GZUR | 0.25% | Fysiskt uppbackad guldfond som förvarar sitt guld i Schweiz |
HANetf Royal Mint Responsibly Sourced Physical Gold | RM8U | 0,22% | Guldfond som drivs av det brittiska myntverket som dessutom förvarar guldet i sina valv i Wales. |
Observera att detta är enbart en handfull av alla de guldfonder som finns på marknaden. Det finns såväl fysiska som syntetiska fonder, och dess guld förvaras på olika ställen vilket ger den enskilde investeraren möjligheten att anpassa riskerna med sin guldfond ytterligare.
Några av alla guldfonderna
Ett av de största problemen med guld är dess miljöavtryck. Det kräver mycket energi att gräva upp, förädla och lagra guld. Det finns också problem kring potentiella arbetskraftsmissbruk i leverantörskedjan.
HANetf Royal Mint Responsibly Sourced Physical Gold (RM8U) försöker hantera dessa frågor för investerare. De guldtackor som denna guldfond äger är alla producerade efter 2019, och består av LBMA-godkända guldtackor. Dessa är tackor kommer från raffinaderier som ”har befunnits, när de ursprungligen testades, uppfylla den erforderliga standarden för acceptans på Londons ädelmetallmarknad.”
Myntverket bygger också världens första anläggning för att återvinna guld från elektroniskt avfall, vilket skapar guld med cirkulär ekonomi med lågt miljöavtryck. Den handlas på Xetra och London Stock Exchange och tar bara 0,25 % per år.
Wisdom Tree Physical Gold är en fysiskt uppbackad guld-ETC som finns i två smaker. Den är denominerad i sterling och backas upp av fysiskt guld som innehas av HSBC Bank. Den har en löpande avgift på 0,39 %. WisdomTree Physical Gold Individual Securities ETC är i huvudsak samma fond denominerad i amerikanska dollar och har samma löpande avgift på 0,39%.
Om du hellre vill ha ditt guld lagrat i Schweiz, lagrar WisdomTree Physical Swiss Gold ETC (GZUR) sitt guld i säkra valv i Zürich på uppdrag av JPMorgan Chase Bank. Den löpande avgiften är 0,15 %.
iShares Physical Gold ETC (PPFB) investerar i fysiskt guld som förvaras av JPMorgan Chase Bank i London. Den löpande avgiften är 0,12 %.
Du kanske gillar
-
How are investors using gold?
-
AuAg Funds siktar på ett guldpris mellan 3 000-3 300 dollar under 2025
-
HANetf fortsätter sin tillväxt och når fem miljarder USD AUM
-
Om du köpte Bitcoin för 100 dollar varje gång media kallade den för ”död”….
-
Bitcoin slår rekord – ”Byggt för att efterlikna guld”
-
Innovativa guld ETCer för miljömedvetna investerare
Nyheter
Två ETFer från WisdomTree med tillgång till metaller för energiomställningen
Publicerad
4 timmar sedanden
15 januari, 2025Sedan i tisdags har två nya börshandlade fonder utgivna av WisdomTree kunnat handlas på Xetra och Börse Frankfurt. Dessa två ETFer från WisdomTree ger tillgång till metaller för energiomställningen.
WisdomTree Strategic Metals UCITS ETF erbjuder investerare tillgång till en korg med råvaror som består av börshandlade metaller relaterade till energiomställningen. Denna korg av råvaror består för närvarande av terminskontrakt på aluminium, plåt, kobolt, koppar, litium, nickel, platina, silver, zink och tenn. Dessa varor är relaterade till energiomställningen, särskilt i samband med elfordon, kraftöverföring, laddning, energilagring, sol- och vindenergi samt väteproduktion.
Valet och viktningen av varje metall baseras på en intensitetsklassificering som mäter mätvärden för engagemang och tillväxt för varje vara relaterad till energiomställningsteknologier. Den maximala vikten för en vara är 20 procent.
Investerare kan också köpa ETFen i den valutasäkrade andelsklassen.
Namn | Kortnamn | ISIN | Avgift | Referens- index |
WisdomTree Strategic Metals UCITS ETF – USD Acc | WENU | IE0007UE04X9 | 0,55 % | WisdomTree Energy Transition Metals Commodity UCITS Index |
WisdomTree Strategic Metals UCITS ETF – EUR Hedged Acc | WENH | IE000611IJM3 | 0,55 % | WisdomTree Energy Transition Metals Commodity UCITS Index |
Produktutbudet i Deutsche Börses XTF-segment omfattar för närvarande totalt 2 332 ETFer. Med detta urval och en genomsnittlig månatlig handelsvolym på cirka 18 miljarder euro är Xetra den ledande handelsplatsen för ETFer i Europa.
Nyheter
ESAB ETF köper företag från hela världen, men bara om de har höga ESG poäng
Publicerad
5 timmar sedanden
15 januari, 2025BNP Paribas Easy MSCI ACWI SRI S-Series PAB 5% Capped UCITS ETF EUR C (ESAB ETF) med ISIN IE0004HBJKG0, försöker följa MSCI ACWI SRI S-Series PAB 5% Capped-index. MSCI ACWI SRI S-Series PAB 5% Capped-index spårar globala aktiemarknaders prestanda (utvecklade och tillväxtmarknader) och tar endast hänsyn till företag med höga miljö-, sociala och styrningsbetyg (ESG) i förhållande till sina branschkollegor, för att säkerställa inkluderingen av de bästa klassföretag ur ett ESG-perspektiv. Dessutom är företag som är involverade i följande branscher exkluderade: Kolbrytning för kraftproduktion, konventionell och alternativ olje-/naturgasutvinning, kraftproduktion från fossila bränslen och kärnenergi. Vikten för varje företag är begränsad till 5 %.
Den börshandlade fondens TER (total cost ratio) uppgår till 0,20 % per år. BNP Paribas Easy MSCI ACWI SRI S-Series PAB 5% Capped UCITS ETF EUR C är den billigaste och största ETF som följer MSCI ACWI SRI S-serien PAB 5 % Begränsat index. ETFen replikerar det underliggande indexets prestanda genom samplingsteknik (köper ett urval av de mest relevanta indexbeståndsdelarna). Utdelningarna i ETF:n ackumuleras och återinvesteras.
BNP Paribas Easy MSCI ACWI SRI S-Series PAB 5% Capped UCITS ETF EUR C är en liten ETF med tillgångar på 28 miljoner euro under förvaltning. Denna ETF lanserades den 8 april 2024 och har sin hemvist i Irland.
Handla ESAB ETF
BNP Paribas Easy MSCI ACWI SRI S-Series PAB 5% Capped UCITS ETF EUR C (ESAB ETF) är en europeisk börshandlad fond. Denna fond handlas på flera olika börser, till exempel Deutsche Boerse Xetra och Borsa Italiana.
Det betyder att det går att handla andelar i denna ETF genom de flesta svenska banker och Internetmäklare, till exempel DEGIRO, Nordnet, Aktieinvest och Avanza.
Börsnoteringar
As the crypto market navigates recent bearish macro-led developments, it’s essential to explore key on-chain metrics that can signal whether we’ve reached a market cycle peak. Despite Bitcoin’s dominance dipping slightly to 58%, it remains the industry’s bellwether. Thus, by analyzing Bitcoin’s on-chain activity and investor behavior, we can gain valuable insights into the market’s overall health and potential trajectory, helping us determine whether we’ve reached a cycle peak or if there’s still room for growth.
That said, last week’s market downturn was fueled by a combination of macroeconomic and market-specific pressures that rattled investor confidence. The Federal Reserve’s hawkish stance, underpinned by stronger-than-expected U.S. economic data, raised doubts about rate cuts in 2025. Further exacerbating the sell-off, news of a U.S. court approving the potential $6.5B Bitcoin sale from seized Silk Road assets heightened oversupply concerns. This led Bitcoin to drop to the $97K range last week, with a brief dip below $90K earlier this Monday. However, on-chain data indicates the sell-off was largely driven by short-term traders, with 86% of moved assets coming from wallets holding BTC for less than a week.
With all of this in mind, let’s tackle the metrics that shed light on where we might be in the cycle:
1) MVRV-Z Score
Top Signal: Medium
The MVRV Z-Score is an on-chain metric that measures how far Bitcoin’s market value, representing its total capitalization, deviates from its realized value, which reflects the cumulative value of all coins at their last movement price, expressed in standard deviations from the historical mean.
The MVRV Z-Score is a key indicator for analyzing Bitcoin market cycles, where scores above 7 typically signal market tops and values below 0 suggest potential bottoms. At present, the score sits between 2.5 and 3, indicating a possible local top—reminiscent of patterns observed before previous halvings. While this points to the potential for a minor correction, major cycle tops are historically associated with scores near 7. To reach such levels, and assuming the realized price remains constant, Bitcoin would need to exceed $200K.
However, the current market dynamics, including the introduction of U.S. Spot Bitcoin ETFs and a high interest-rate environment, may shift the behavior of key metrics compared to previous cycles. This evolving regime—marked by increased institutional demand and continuous Bitcoin movement driven by Spot ETFs—could alter both components of these metrics, potentially creating new patterns in this cycle. Furthermore, the supportive stance of the incoming presidential administration, which has legitimized the asset through favorable policies, could accelerate growth and foster a more robust market environment for Bitcoin, pushing beyond what we have seen up until now.
Figure 1: Bitcoin MVRV Z-Score vs Bitcoin Price
Source: 21Shares, Glassnode
2) NUPL
Top Signal: Low
NUPL (Net Unrealized Profit and Loss) is an on-chain metric that evaluates the difference between Bitcoin’s current market value and the aggregate value at which all assets were last moved. In simpler terms, it indicates whether the market as a whole is in a state of profit or loss if all Bitcoin were sold at the current price.
If NUPL is greater than 0, it indicates that the market as a whole is in profit. Conversely, if NUPL is less than 0, it suggests that the market is operating at a loss.
Figure 2: Bitcoin Net Unrealized Profit & Loss (NUPL)
Source: 21Shares, Glassnode
The chart can be further broken down as described below:
Despite Bitcoin trading near $100K, its NUPL remains in the ’Belief’ stage rather than progressing to ’Euphoria.’ This suggests that while some profit-taking has occurred above $90K, the current rally still has momentum. The absence of a transition to the ’blue zone’ indicates that the recent selling pressure is likely temporary, with potential for further upside.
3) Bitcoin Terminal Price
Top Signal: Low
The Terminal Price indicator provides a unique perspective on Bitcoin’s market dynamics by incorporating the concept of Coin Days Destroyed (CDD). CDD measures economic activity within the Bitcoin network by analyzing the volume of coins moved relative to their dormancy period. This means coins that have remained untouched for longer periods carry more weight in the calculation, effectively highlighting the behavior of seasoned, long-term investors—often regarded as ”smart money.”
The Terminal Price takes this concept further by using the transferred price (a value derived from CDD and the current Bitcoin supply) and multiplying it by 21, creating a normalized terminal value. Historically, this indicator has proven to be a reliable tool for identifying Bitcoin’s price cycle peaks, offering a framework to assess market tops and overheated conditions.
As shown in Figure 3, the Terminal Price has historically served as a reliable price ceiling, marking market tops in early 2014, late 2017, and mid-2021. Currently, with the Terminal Price estimated at $180K, this suggests that Bitcoin retains significant growth potential before approaching levels historically associated with market cycle peaks.
Figure 3: Bitcoin Terminal Price
Source: Bitcoin Magazine Pro
4) Puell Multiple
Top Signal: Medium
The Puell Multiple, a key metric tracking miner behavior, evaluates their profitability by comparing the daily value of newly issued Bitcoin against its 365-day moving average. This indicator is instrumental in identifying periods of significant miner income fluctuations, which can influence their decision to sell.
Historically, high values (above 4) indicate above-average miner profitability, often triggering increased selling activity. Conversely, low values (below 0.5) signal miner income stress, typically aligning with market bottoms and presenting potential buying opportunities.
Bitcoin’s current Puell Multiple of 1.34 reflects a relatively low level, which could be attributed to earlier miner selling pressure during the pre-halving all-time high of $73K in March 2024—an unusual event typically seen in post-halving cycles. At that time, the indicator reached 2.3, indicating that a significant portion of miner profitability-driven selling may have already occurred.
This suggests that the Puell Multiple may have already peaked earlier this year, as it has consistently formed lower highs over time. As a result, this metric is quite insightful as it indicates that the expected surge in miner selling pressure may have already played out while signaling potential room for growth as selling overhang from miners diminishes, paving the way for a healthier market dynamic. The caveat here is the arrival of ETFs, which now hold over 5% of Bitcoin’s total supply at around 1.1M BTC, introduce a powerful new source of sustained buying pressure. This influx effectively offsets the selling pressure from miners, who collectively hold around 1.8M BTC, creating a more balanced market environment.
Figure 4: Bitcoin Puell Multiple
Source: Coinglass
5) Pi Cycle Top
Top Signal: Low
The Bitcoin Pi Cycle Top Indicator is a technical metric designed to identify potential market peaks by analyzing the relationship between the 111-day moving average (111DMA) and twice the 350-day moving average (350DMA x 2). Historically, when the 111DMA approaches or crosses the 350DMA x 2, it signals an overheated market state, often preceding the cycle’s peak. Notably, this indicator has accurately pinpointed the top of previous Bitcoin market cycles within three days.
Currently, the 350DMA stands at $137K, while the 111DMA is at $83K, suggesting the market still has substantial growth potential before entering the overheated phase. This implies that the cycle top is not yet imminent, providing room for further upward movement.
Figure 5: Bitcoin Pi Cycle Top Indicator
Source: 21Shares, Glassnode
However, it’s important to account for the evolving nature of the Bitcoin market. While the Pi Cycle Top Indicator has been a reliable tool during Bitcoin’s growth phase, its relevance may be shifting as the asset transitions into a broader adoption phase. This new era is defined by factors such as institutional involvement, widespread adoption, and an influx of capital through instruments like ETFs, which could reshape the dynamics of Bitcoin’s cyclical behavior.
6) Long-Term Holders Sell-Side Risk Ratio
Top Signal: Medium
This metric measures the ratio of total realized profits and losses to the realized market capitalization of Bitcoin’s long-term holders. Elevated values are typically observed during late-stage bull markets and are associated with heightened volatility and increased selling pressure from whales and long-term holders. Therefore, the market is considered to be entering an overheated state when this ratio approaches or exceeds 0.8%. As such, rising levels of distribution can serve as an early indicator of market exhaustion and potential trend reversals.
In March 2024, Bitcoin’s ratio reached 0.35%, aligning with the local cycle top at $73K. It climbed again to 0.43% as Bitcoin hit $106K in mid-December. However, when compared to previous cycles, these values remain below the levels typically seen at major market peaks. This suggests that Bitcoin has not yet entered the euphoric stage of the cycle, indicating that the peak of this bull market is likely still ahead.
Figure 6: Bitcoin Long-Term Holder Sell-Side Risk Ratio
Source: 21Shares, Glassnode
7) Altcoin Season Index
Top Signal: Low
Following the pullback in Bitcoin’s dominance throughout December, many expected altcoins to rally in the coming weeks. However, this hasn’t materialized yet, as over $400B was wiped from total market capitalization since the beginning of January. This broad decline underscores the negative sentiment currently gripping the crypto market.
Figure 7: Altcoin Season Index
Source: BlockchainCenter
The Altcoin Season Index measures whether altcoins have outperformed Bitcoin over a 90-day period. Historically, this phase aligns with euphoric market conditions when profits rotate from Bitcoin into other cryptoassets, driving significant gains across the latter tail. Currently, the index sits at 47, well below the threshold of 75 that signals Altcoin Season. While we briefly touched this level following the election, previous cycles have seen far more prolonged and intense dominance than the fleeting uptick observed in early December.
This underscores the continued underperformance of altcoins and their widespread participation in the market’s downturn. Nevertheless, there’s potential for a shift as conditions stabilize. As Bitcoin regains momentum, it could pave the way for altcoins to drive broader market growth, signaling the start of the latter stage of the cycle.
8) Google Trends Popularity
Top Signal: Medium
While not an on-chain indicator, Google Trends data offers valuable insights into retail interest in crypto. It tracks search interest on a scale from 0 to 100, with 100 representing peak popularity and 0 indicating minimal or no interest.
Figure 8: Google Trends Popularity for Crypto-Related Terms
Source: 21Shares, Google
Current Google Trends data for crypto-related searches reveals that retail interest remains far below the peaks of the 2021 bull market. Although there was a brief spike during the recent election—understandably so, given crypto’s unprecedented presence in political discourse—this uptick failed to sustain broader engagement.
Some might argue that retail investors onboarded during previous cycles explain the muted search activity. However, with crypto’s increasing mainstream adoption over the past year, we anticipate a wave of new retail investors entering the market. This surge of interest should drive search volumes higher, potentially exceeding the 2021 highs and a key precursor of heightened activity.
Given that current search interest is still well below prior levels, it’s reasonable to infer that this market has significant room for growth. However, to trigger this influx of retail participation, a strong catalyst is needed to reignite public enthusiasm.
9) Crypto Liquidity
Top Signal: Low
Stablecoin supply acts as a crypto-equivalent of deployable capital—a barometer of liquidity within the cryptoasset ecosystem. Historically, market tops are followed by a significant reduction in stablecoin liquidity as funds are withdrawn from the crypto space.
However, the current cycle presents a stark contrast. Despite recent market volatility, stablecoin supply is reaching all-time highs around $200B, reflecting robust liquidity and signaling a significant amount of dry powder still in play. In fact, the only notable contraction in the stablecoin market cap this cycle came from the implementation of MiCA regulations in Europe, which prompted the delisting of some stablecoins from EU-based exchanges, but ultimately led to reallocation to other stables across several jurisdictions.
This sustained growth in stablecoin supply suggests there is still considerable buying power on the sidelines. With liquidity remaining abundant, the stage could be set for another leg up in this cycle as capital flows back into the market.
Figure 9: Total Stablecoins Supply
Source: 21Shares, Artemis
Overall, while some of the metrics discussed are approaching elevated levels, most remain below the thresholds typically seen in the late stages of a bull cycle that precede significant market downturns. It’s also worth noting that during bull cycles, markets often remain in overheated conditions longer than expected. As such, investors should exercise caution but also recognize the unique dynamics at play, particularly as we enter what could be a landmark year for crypto, driven by the new administration and its anticipated second-order effects. Lastly, no single metric should be analyzed in isolation; a comprehensive assessment of market health requires combining multiple indicators to ensure sufficient confluence.
Figure 10: Signal Summary Table
What’s happening this week?
Research Newsletter
Each week the 21Shares Research team will publish our data-driven insights into the crypto asset world through this newsletter. Please direct any comments, questions, and words of feedback to research@21shares.com
Disclaimer
The information provided does not constitute a prospectus or other offering material and does not contain or constitute an offer to sell or a solicitation of any offer to buy securities in any jurisdiction. Some of the information published herein may contain forward-looking statements. Readers are cautioned that any such forward-looking statements are not guarantees of future performance and involve risks and uncertainties and that actual results may differ materially from those in the forward-looking statements as a result of various factors. The information contained herein may not be considered as economic, legal, tax or other advice and users are cautioned to base investment decisions or other decisions solely on the content hereof.
Två ETFer från WisdomTree med tillgång till metaller för energiomställningen
ESAB ETF köper företag från hela världen, men bara om de har höga ESG poäng
Have We Reached This Cycle’s Peak Yet?
B8TC ETF är en penningmarknadsfond som följer Fed Funds
WisdomTree lanserar Strategic Metals UCITS ETF
De mest eftersökta ETFerna i december 2024
AI, datacenter och Uranium Bull Market
De bästa ETFerna för värdeaktier
Which crypto assets will outperform Bitcoin in 2025?
Hector McNeil kommenterar Trumps krav på Natos försvarsutgifter
Populära
-
Nyheter2 veckor sedan
De mest eftersökta ETFerna i december 2024
-
Nyheter4 veckor sedan
AI, datacenter och Uranium Bull Market
-
Nyheter2 veckor sedan
De bästa ETFerna för värdeaktier
-
Nyheter4 veckor sedan
Which crypto assets will outperform Bitcoin in 2025?
-
Nyheter2 veckor sedan
Hector McNeil kommenterar Trumps krav på Natos försvarsutgifter
-
Nyheter2 veckor sedan
BlackRock slår rekord med lanseringen av bitcoin ETF
-
Nyheter1 vecka sedan
Post-election rally cools at year end
-
Nyheter2 veckor sedan
Buffertstrategin på Nasdaq-100 med december 2024/2025 som ny målperiod