
Nyheter
Morningstar Wide Moat Focus Index A History of Outperformance (Part 2/2)

Morningstar Wide Moat Focus Index A History of Outperformance (Part 2/2) is part two of a two-part series that examines the Morningstar® Wide Moat Focus IndexTM. The previous post described how the index is constructed.
Outperformance
The Morningstar Wide Moat Focus Index (MWMFTR or “U.S. Moat Index”) is designed to capture the performance of U.S. companies with a Morningstar Economic Moat Ranking of Wide that are trading at an attractive price. The strategy of combining quality and value has resulted in an index track record of generating significant excess returns relative to the overall U.S. equity market. With an appreciation of 203.66 percent since inception in February 2007, the U.S. Moat Index has outpaced the S&P 500 Index by a total of 95.24 percentage points. Looking at the annualized performance, the Morningstar index has outperformed the broader U.S. market by roughly four percentage points. (Data as of 31.05.2017).
This longer-term trend is also reflected in the more recent performance: Moat-companies in the US equity market have profited stronger from the Rally that started in the beginning of this year than the broader market. While the year-to-date-performance of the S&P is at 8.66 percent, the U.S. Moat Index posted returns of 10.68 percent (Data as of 31.05.2017).
Batting Average
Measured against the S&P 500 Index, the U.S. Moat Index also features an impressive batting average, particularly over long-term holding periods. Batting average is a sports metaphor that is used in finance to describe the level of relative success for an investment strategy. Specifically, it indicates how often an investment strategy has outperformed a benchmark through various periods over time. The batting average is measured by dividing the number of periods a portfolio or investment strategy outperforms a benchmark by the total number of periods. On a six-month rolling period, the performance of the MWMFTR outperformed the S&P 500 in 59 percent of all cases. For three years rolling period, this figure is as high as 78 percent (Data as of 31.05.2017).

Important Disclosures
This commentary is not intended as a recommendation to buy or to sell any of the named securities. Holdings will vary for the MOAT ETF and their corresponding Indices.


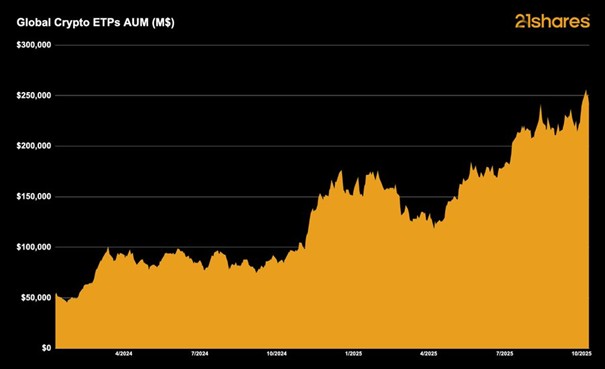
I början av året förutspådde 21shares att krypto-ETPer skulle driva ytterligare institutionell adoption och nå 250 miljarder dollar i förvaltat kapital globalt. Den milstolpen har just nåtts.
Research Newsletter
Each week the 21Shares Research team will publish our data-driven insights into the crypto asset world through this newsletter. Please direct any comments, questions, and words of feedback to research@21shares.com
Disclaimer
The information provided does not constitute a prospectus or other offering material and does not contain or constitute an offer to sell or a solicitation of any offer to buy securities in any jurisdiction. Some of the information published herein may contain forward-looking statements. Readers are cautioned that any such forward-looking statements are not guarantees of future performance and involve risks and uncertainties and that actual results may differ materially from those in the forward-looking statements as a result of various factors. The information contained herein may not be considered as economic, legal, tax or other advice and users are cautioned to base investment decisions or other decisions solely on the content hereof.


Globala krypto-ETPer förvaltade tillgångar når 250 miljarder dollar

YGLD ETP spårar priset på guld och ger en löpande avkastning

Investera i Stacks med en börshandlad produkt

VALOUR FLR SEK följer priset på kryptovalutan FLR
BlackRock utökar sitt utbud av iShares iBonds UCITS ETFer med sex nya lanseringar

HANetf och Infrastructure Capital Advisors samarbetar för att lansera aktivt förvaltad preferensavkastnings-ETF i Europa

IN0A ETF spårar S&P 500 med fokus på företag med höga ESG-betyg

De bästa lågvolatilitets ETFer på marknaden
PLTY ETP utfärdar optioner mot aktier i Palantir
Time in Bitcoin beats timing Bitcoin
-
 Nyheter4 veckor sedan
HANetf och Infrastructure Capital Advisors samarbetar för att lansera aktivt förvaltad preferensavkastnings-ETF i Europa
-
 Nyheter4 veckor sedan
IN0A ETF spårar S&P 500 med fokus på företag med höga ESG-betyg
-
 Nyheter3 veckor sedan
De bästa lågvolatilitets ETFer på marknaden
-

 Nyheter4 veckor sedan
PLTY ETP utfärdar optioner mot aktier i Palantir
-

 Nyheter4 veckor sedan
Time in Bitcoin beats timing Bitcoin
-

 Nyheter4 veckor sedan
HANetf kommenterar kopparuppgången
-

 Nyheter2 veckor sedan
Fokus mot en helt ny börshandlad produkt i september 2025
-

 Nyheter3 veckor sedan
M5TYs senaste utdelningstakt (55 %) belyser covered call-strategins inkomstpotential