
Nyheter
Let Us In and We’ll Let You In
MSCI to China Let Us In and We’ll Let You In. Chinese regulators have realized that mainland equity markets need to be more accommodating, transparent, and, in the case of Morgan Stanley Capital International (MSCI), more open. Inclusion of China A-shares in MSCI’s Emerging Markets Index, a benchmark with an estimated $1.5 trillion tracking it, may be pivotal in encouraging new investment in the country.
In 2014, MSCI first considered including China A-shares in its Emerging Market Index. At that time MSCI, in consultation with clients, opted not to include them, citing ”remaining investability constraints linked to the Qualified Foreign Institutional Investment (QFII) and Renminbi Qualified Foreign Institutional Investor (RQFII) quota systems”.1
MSCI Collaborated with China to Foster Inclusion
In 2015, despite having made ”substantial progress toward the opening of the Chinese equity market to institutional investors”,2 MSCI felt there was additional liberalization that needed to take place. Once again, it chose not to include China. MSCI did, however, form a collaborative working group with the China Securities Regulatory Commission (CSRC) in the hopes of resolving the remaining issues.
Since the beginning of 2016, China has taken steps to meet MSCI’s requirements for accessibility and transparency. In February, QFII quotas were increased from $1 billion to $5 billion and lock-up periods were shortened from one year to three months. This was followed more recently by rules restricting trading halts in stocks. Trading halts have been a major concern for MSCI and investors alike following the sharp selloff that began in the summer of 2015. Under the new rules, a stock can halt trading for up to three months for ”major asset restructuring”, and up to one month during ”private placement”.3
China Has Instituted Many Positive Changes
The changes made so far this year, along with the anticipated expansion of the Shanghai-Hong Kong Stock Connect program to include the Shenzhen Stock Exchange, have some investors speculating that this could be the year that China finally gets a spot in the MSCI Emerging Markets Index. In a recent report, Goldman Sachs estimated that there was a 70% likelihood that MSCI would add China A-shares to its flagship benchmark.4 Any inclusion of A-shares would likely be phased in over time with an initial allocation expected to be around 5%.5
As China transitions from a manufacturing-based economy to a services-based economy, being included in the premier emerging markets benchmark will likely be welcomed news to investors.
MSCI Emerging Markets Index – Country Weights
as of May 31, 2016

Source: MSCI.
Authored by James Duffy, Product Manager, VanEck Vectors ETFs
ETFs is authored by VanEck thought leaders. VanEck is the sponsor of VanEck Vectors ETFs and is currently among the largest providers of exchange traded funds (ETFs) in the U.S. and worldwide. VanEck Vectors ETFs empower investors to help build better portfolios with access to compelling investment themes and strategies. Our ETFs span many global asset classes, and are built to be transparent, liquid, and pure-play reflections of target markets.
IMPORTANT DISCLOSURES
1 2014 MSCI Market Classification Review
2 2015 MSCI Market Classification Review
3 Shanghai Stock Exchange
4 Reuters Goldman Sachs raises odds of China share inclusion in MSCI indexes to 70 percent
5 Reuters MSCI Consultation on China A-Share Index Inclusion Roadmap
This content is published in the United States for residents of specified countries. Investors are subject to securities and tax regulations within their applicable jurisdictions that are not addressed on this content. Nothing in this content should be considered a solicitation to buy or an offer to sell shares of any investment in any jurisdiction where the offer or solicitation would be unlawful under the securities laws of such jurisdiction, nor is it intended as investment, tax, financial, or legal advice. Investors should seek such professional advice for their particular situation and jurisdiction.
The information herein represents the opinion of the author(s), but not necessarily those of VanEck, and these opinions may change at any time and from time to time. Non-VanEck proprietary information contained herein has been obtained from sources believed to be reliable, but not guaranteed. Not intended to be a forecast of future events, a guarantee of future results or investment advice. Historical performance is not indicative of future results. Current data may differ from data quoted. Any graphs shown herein are for illustrative purposes only. No part of this material may be reproduced in any form, or referred to in any other publication, without express written permission of VanEck.
Van Eck Securities Corporation offers investment products that invest in the asset class(es) included in this material. For information regarding VanEck Funds, please visit vaneck.com.
Investors cannot invest directly in an index. Any indices listed are unmanaged indices and include the reinvestment of all dividends, but do not reflect the payment of transaction costs, advisory fees or expenses that are associated with an investment in a fund. An index’s performance is not illustrative of a fund’s performance. Indices are not securities in which investments can be made.
Investing involves substantial risk and high volatility, including possible loss of principal. An investor should consider the investment objective, risks, charges and expenses of the Fund carefully before investing. To obtain a prospectus and summary prospectus, which contains this and other information, call 800.826.2333 or visit vaneck.com/etfs. Please read the prospectus and summary prospectus carefully before investing.


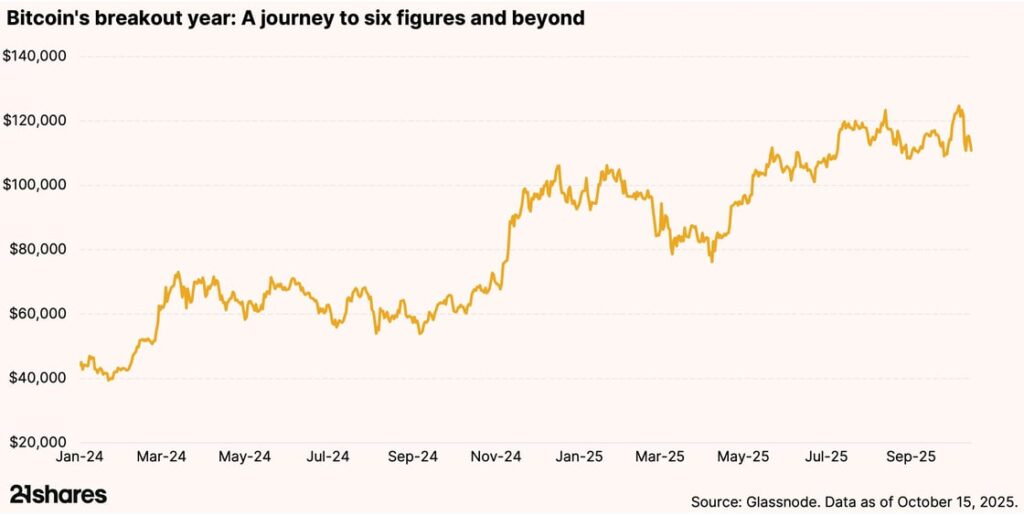
Bitcoin’s record-breaking rally and resilient investor base reveal a maturing market. Despite brief drawdowns, over 90% of holders remain in profit, and institutional inflows continue to absorb volatility. With downside risk compressing, even a modest Bitcoin allocation will meaningfully boost portfolio efficiency across cycles.

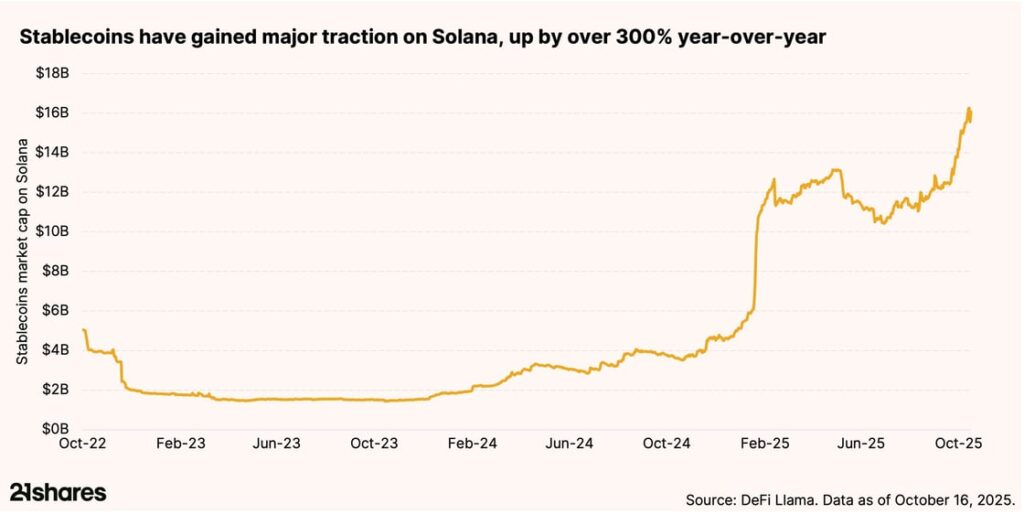
Why is retail finance booming on Solana?
Solana’s low fees and lightning-fast transactions are powering real-world payments. With $16 billion worth of stablecoins traded on the network, Solana is bridging crypto and commerce, driving retail adoption at an unprecedented scale. This is exactly why legacy companies like Shopify and PayPal have chosen to integrate the blockchain into their businesses.


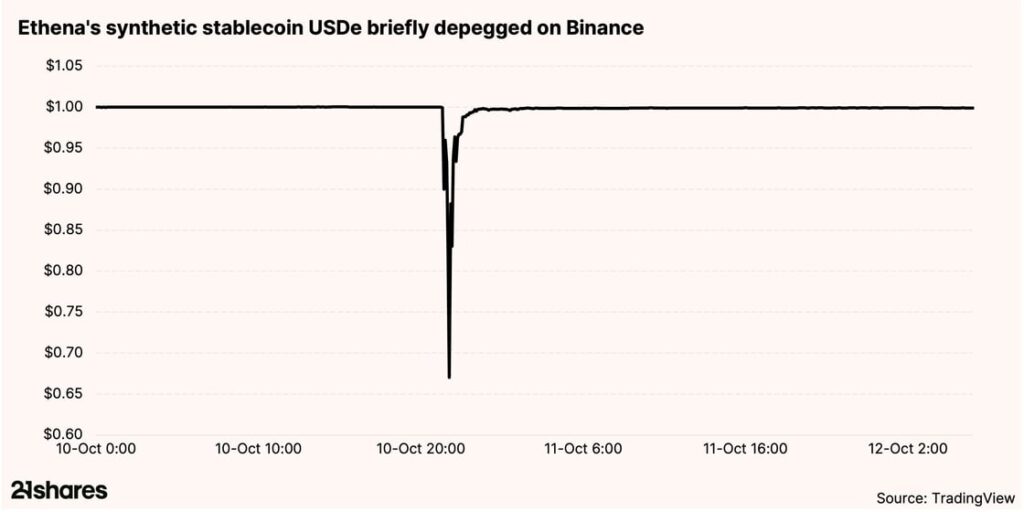
Why did Ethena’s stablecoin remain stable onchain but depegged on Binance?
On October 10, Ethena’s USDe saw a sharp depeg on Binance’s centralized exchange, plunging to $0.65, while staying stable across all decentralized finance platforms. The cause wasn’t a protocol flaw but thin centralized liquidity. The incident highlights how decentralized systems can better withstand volatility, offering transparency and resilience during market stress.

Research Newsletter
Each week the 21Shares Research team will publish our data-driven insights into the crypto asset world through this newsletter. Please direct any comments, questions, and words of feedback to research@21shares.com
Disclaimer
The information provided does not constitute a prospectus or other offering material and does not contain or constitute an offer to sell or a solicitation of any offer to buy securities in any jurisdiction. Some of the information published herein may contain forward-looking statements. Readers are cautioned that any such forward-looking statements are not guarantees of future performance and involve risks and uncertainties and that actual results may differ materially from those in the forward-looking statements as a result of various factors. The information contained herein may not be considered as economic, legal, tax or other advice and users are cautioned to base investment decisions or other decisions solely on the content hereof.


Tre nya börshandlade fonder från Xtrackers

Bitcoin within 15% of its all-time high: Should you still allocate?

HANetfs Hector McNeil förklarar hur ETFer genererar hög avkastning med covered calls

JPEY ETF högavkastande företagsobligationer vautasäkrade till Euro

AI minskar gapet mot försvaret då flödena av europeiska tematiska ETFer når 13,1 miljarder dollar hittills i år

De bästa lågvolatilitets ETFer på marknaden

Fokus mot en helt ny börshandlad produkt i september 2025

M5TYs senaste utdelningstakt (55 %) belyser covered call-strategins inkomstpotential
Could Bitcoin be the key to your dream house?

Börshandlade fonder för europeiska small caps
-
 Nyheter4 veckor sedan
De bästa lågvolatilitets ETFer på marknaden
-
 Nyheter3 veckor sedan
Fokus mot en helt ny börshandlad produkt i september 2025
-
 Nyheter4 veckor sedan
M5TYs senaste utdelningstakt (55 %) belyser covered call-strategins inkomstpotential
-

 Nyheter4 veckor sedan
Could Bitcoin be the key to your dream house?
-
 Nyheter3 veckor sedan
Börshandlade fonder för europeiska small caps
-

 Nyheter2 veckor sedan
Levler noterar ytterligare fyra börshandlade fonder i Sverige
-
 Nyheter4 veckor sedan
The Investment Case for TLT (Long-Dated Treasury Bonds)
-

 Nyheter3 veckor sedan
Miners Find Their Mojo as Gold Consolidates