
Nyheter
Is VIX the next market blunder?

ETF Securities Equity Research: Is VIX the next market blunder?
Highlights
- The VIX index is currently demonstrating a complete absence of fear. In the context of current world affairs and political instability, we believe this is demonstrating a worrying complacency amongst investors.
- Shorting the VIX is a dangerously crowded trade. The risk of market dislocation increases as interest rates rise.
- The VIX and equity valuations are unusually closely correlated, implying that investors are buying equities due to their low volatility, and are comfortable with high valuations as a result. As we believe the VIX is likely understating risk, this puts equity investors in a vulnerable position.
Changing course after failure
The VIX index, coined as the fear index, is currently demonstrating a complete absence of fear. Except for the occasional spike upwards this year it has been exceptionally low. The average level of VIX for this year sits in the lowest 5% in history (since 1991) with the current level being in the lowest 1%. Furthermore, the low of 9.75 this year was the 5th lowest in history, a level last achieved in late 1993. In the context of current world affairs and political instability, we believe this is demonstrating a worrying level of complacency amongst investors.

Recent spikes in the VIX highlight how this complacency can leave investors going short the VIX index vulnerable. The spike on 17th May is a good example. The VIX rose 46% from 10.6 to 15.6 overnight on the back of revelations that Donald Trump asked ex FBI Director James Comey to drop the FBI investigation into Russian involvement in the US Presidential elections.
From a superficial perspective, the low VIX suggests investors’ perception of future volatility is sanguine. We believe the VIX is understating risk. Our model of the VIX, which uses a combination of the Global Financial Stress Index (GFSI) and the US Economic Policy Uncertainty Index (detailed in VIX & Tax promises lulling equity investors into a false sense of security) highlights a widening deviation between our model results of the VIX and the actual VIX index. Our model suggests the VIX should be closer to 15, not its current level of 10.6. Thus, our model indicates that market perception of risk should be much higher. Perversely, we believe this disparity has been partly due to unstable macro events. A broad rise in the S&P500 is masking unusually low correlation between market sectors and individual stocks. This does not fully explain why the VIX has been deviating from our model, as this is a more recent phenomenon.
Since 2013 a worrying trend has arisen amongst a group of investors who are shorting the VIX. The subdued level of the VIX has likely been driven by investors, on the hunt for yield, motivated by years of loose monetary policy. The steep term structure gives these investors who are short the VIX a yield.

According to the CFTC (Commodity Futures Trading Commission), investors are holding record short positions – over 3x standard deviation from its historical range relative to long positions – suggesting shorting the VIX is an increasingly crowded trade.

We question how long this can last given the VIX is so low. We also remain concerned that an unwind of this trade will hurt, potentially prompting a VIX short squeeze and the resultant higher volatility prompting a risk asset sell-off. Timing a potential shift in sentiment is difficult although shorting the VIX will become increasingly less attractive every time the US Federal Reserve (FED) increases interest rates. The short VIX yield will therefore look increasingly less attractive as yields in other assets increase with rising interest rates. Conversely, an unexpected sharp move in equities or a significant political event could also precipitate an unwind in short VIX positioning.
On the other side of this trade are investors who see record lows in the VIX as an opportunity to buy long positions, fearing that volatility may rise. As illustrated by the shares outstanding from a selection of ETFs, short VIX ETF shares have been falling recently while long VIX ETF shares have risen sharply. This trend emerged not long after the first FED rate hike in December 2015.

The challenge in owning long VIX products is their ability to track the index. As the term structure is steep, it means as the products switch from one contract to the next, there is a cost incurred, meaning over time there is an increasing decay in relative performance.
The low measures of the VIX does have implications for the equity market. Historically there has been a poor relationship between the VIX and price/earnings (PE) valuations in the US, with a regression between of the two demonstrating an R-squared of 0.1 since 1990. However, over the last 2 years the R-squared his risen sharply to 0.58, suggesting a much closer correlation between the VIX and PEs.

The worrying aspect in the relationship is that the further the VIX falls, the higher valuations are, implying that investors are buying equities due to their low volatility, and are happy paying higher valuations to do so. As we believe the VIX is likely understating risk, this puts equity investors in a vulnerable position.
In short, we believe equity investors are becoming too complacent, valuations are high at a time when margins are likely to be squeezed further, whilst many promised corporate tax cuts may not come to fruition this year. Furthermore, we believe the VIX is lulling some investors into a false sense of security when holding equities. These factors leave equity markets vulnerable to a sell-off in the event of further interest rate rises and continued lack of clarity from the US political administration.
For more information contact:
ETF Securities Research team
ETF Securities (UK) Limited
T +44 (0) 207 448 4336
E info@etfsecurities.com
Important Information
This communication has been issued and approved for the purpose of section 21 of the Financial Services and Markets Act 2000 by ETF Securities (UK) Limited (“ETFS UK”) which is authorised and regulated by the United Kingdom Financial Conduct Authority (the “FCA”).


Nyheter
VettaFis Stacey Morris ser tillväxt i mellanströmssektorn framöver tack vare ökande efterfrågan på LNG och starkt fritt kassaflöde


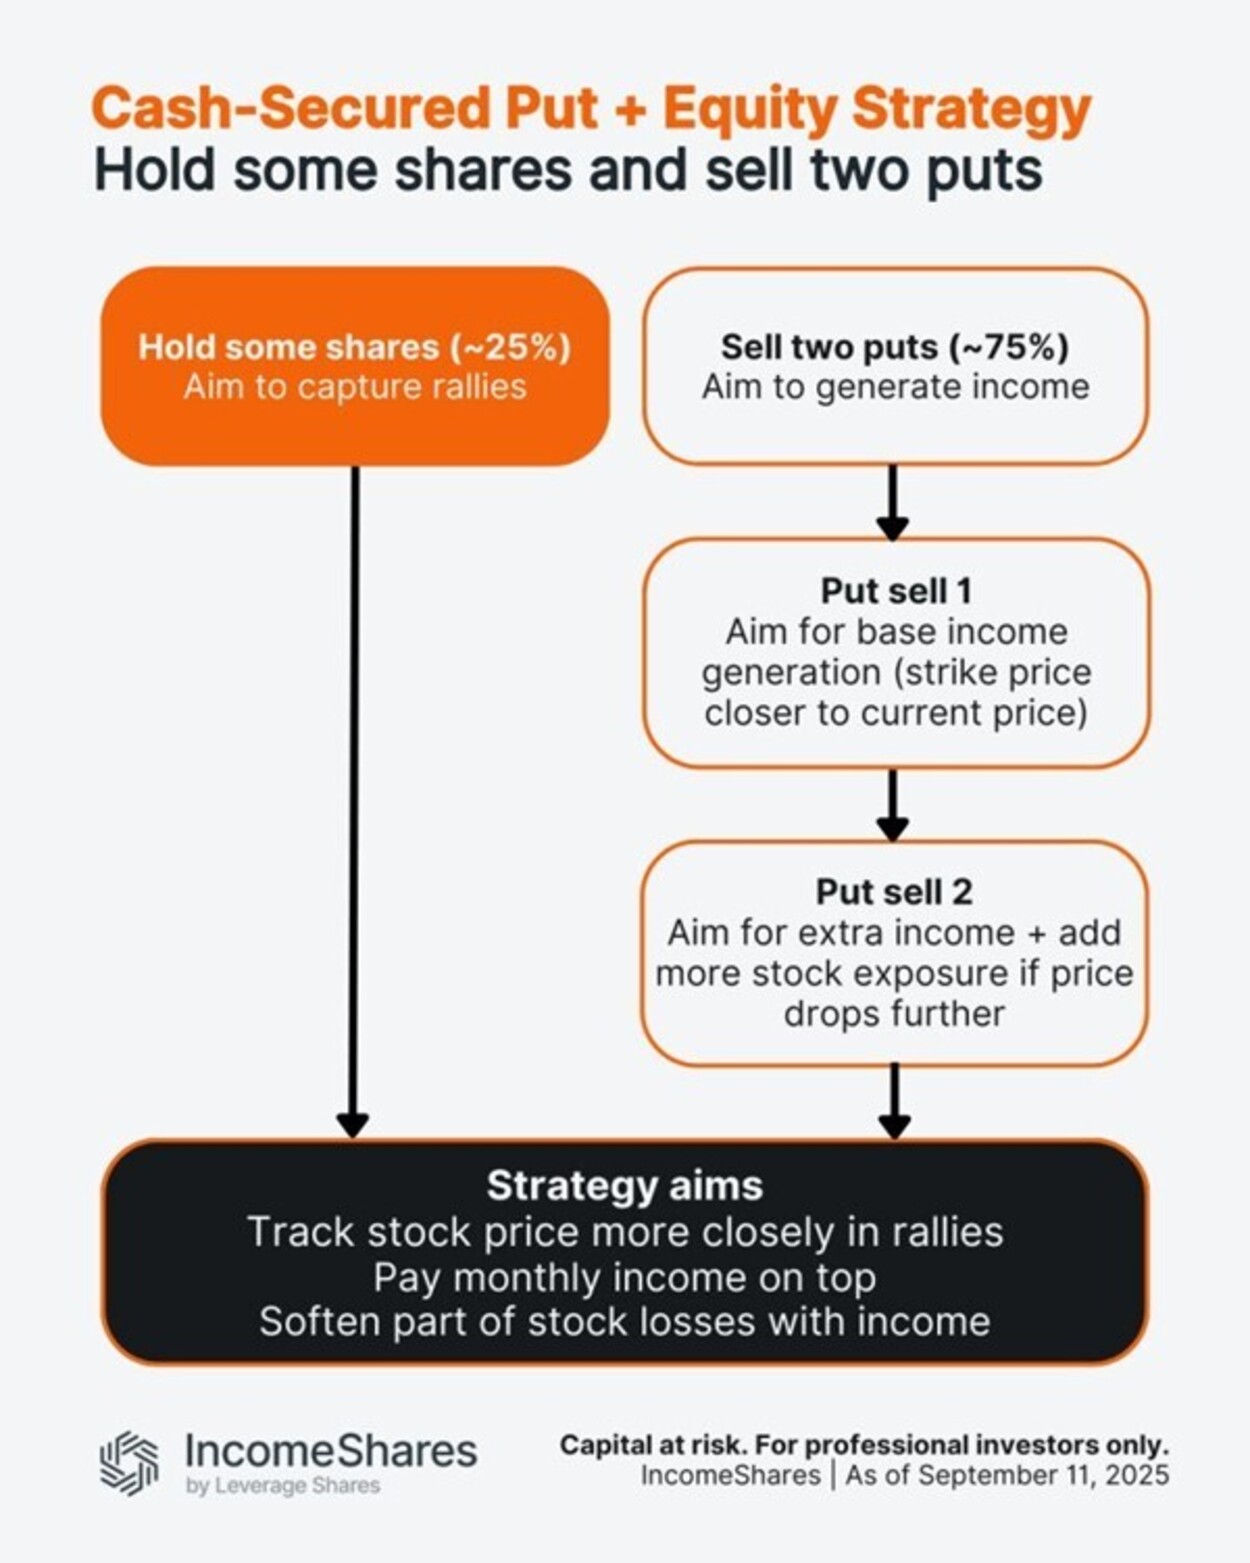
IncomeShares börsnoterade produkter använder en strategi med kontantsäkerhet och aktier. Blandningen är cirka 25 % aktier och 75 % sälj av säljoptioner.
Aktiehylsan (~25 %) kan fånga upp en del av ett rally.
Puthylsan (~75 %) är uppdelad i två delar.
Första put: syftar till basintäkter, med lösenpriser närmare det aktuella priset. Att sälja en put innebär att ETPen får intäkter i förskott, men tar också på sig aktieexponering till lösenpriset om aktiekursen sjunker under den nivån.
Andra put: syftar till extra intäkter, med lösenpriset satt längre från det aktuella priset. Om aktien faller så mycket tar ETPen på sig aktieexponering till den lösennivån. Eftersom den redan har fått intäkter från att sälja säljoptioner är den effektiva kostnaden för den exponeringen lägre än lösenpriset. Det hjälper ETPen att återuppbygga aktieexponeringen istället för att förlora den, så att den kan hålla sig i linje med nästa potentiella rally.
Tillsammans syftar denna metod till att följa aktien närmare i uppgångar, betala ut månadsinkomst utöver det och mildra en del av förlusterna med optionsintäkter. Om aktien faller mycket kan ETPen fortfarande förlora i värde – men intäkterna kan bidra till att dämpa en del av fallet.
Följ IncomeShares EU för mer insikt.


VettaFis Stacey Morris ser tillväxt i mellanströmssektorn framöver tack vare ökande efterfrågan på LNG och starkt fritt kassaflöde

EXCN ETF investerar i emerging markets men exkluderar Kina

Så här fungerar strategin med kontantsäkerhet och aktier

6TVM ETF spårar S&P500 syntetiskt
BlackRock lanserar iShares MSCI World Sector & Country Neutral Equal Weight UCITS ETF

Månadsutdelande ETFer uppdaterad med IncomeShares produkter

Utdelningar och försvarsfonder lockade i augusti

HANetfs analyserar hur ett fredsavtal kan påverka det europeiska försvaret

HANetfs VD kommenterar Trump-Putin-toppmötet

ADLT ETF investerar bara i riktigt långa amerikanska statsobligationer
-
 Nyheter3 veckor sedan
Månadsutdelande ETFer uppdaterad med IncomeShares produkter
-
 Nyheter2 veckor sedan
Utdelningar och försvarsfonder lockade i augusti
-
 Nyheter3 veckor sedan
HANetfs analyserar hur ett fredsavtal kan påverka det europeiska försvaret
-
 Nyheter4 veckor sedan
HANetfs VD kommenterar Trump-Putin-toppmötet
-
 Nyheter3 veckor sedan
ADLT ETF investerar bara i riktigt långa amerikanska statsobligationer
-

 Nyheter1 vecka sedan
Septembers utdelning i XACT Norden Högutdelande
-

 Nyheter3 veckor sedan
Fastställd utdelning i MONTDIV augusti 2025
-

 Nyheter1 vecka sedan
HANetf kommenterar mötet mellan Kina, Ryssland och Nordkorea vid militärparad