
Nyheter
Is Solana Following Ethereum’s Footsteps?
• Mixed Inflationary Signals vs. Bitcoin’s Correction
• Ethereum’s Dencun Upgrade and its Impact on Layer 2s
• Solana Nearly Surpassing ATH Across Multiple 2021 Metrics
Mixed Inflationary Signals vs. Bitcoin’s Correction
The U.S. economy continues to send mixed signals after a period of stability in the first two months of the year. As indicated by the PPI, wholesale inflation has surged to almost double expectations at around 0.6% versus the projected 0.3%, signaling increased price pressures. However, U.S. jobs data revealed unexpected resilience in the labor market, with 209K job losses instead of the anticipated 218K. Conversely, monthly wage growth slowed to 0.1% in February, the lowest in two years. Thus, although wage inflation appears to be tapering off, job growth is outpacing expectations, adding further nuances to the Fed’s mission of taming inflation while avoiding a recession. Further, stubborn inflation suggests that the current high-interest rate regime will persist longer. This underscores the need to monitor changes closely, as tighter monetary policies dampen risk appetite in financial markets while lower rates increase the allure of asset classes such as crypto.
The latest macro data is also relevant in light of BTC’s growing correlation with the S&P 500 since the ETF launch, as it allows institutional investors to treat Bitcoin akin to a tech stock, thereby amplifying its susceptibility to macroeconomic uncertainty. This factor could explain the temporary pause in BTC’s momentum after reaching an ATH amidst the recent mixed data. Nevertheless, it’s important to remember that corrections and sideways movements are healthy for Bitcoin’s market structure as they help to build a sustainable growth trajectory. On the brighter side, we expect a further influx of institutional capital into BTC, especially as Registered Investment Advisors begin accelerating the ETF approval process after their typical due diligence period. For instance, Cetera, a wealth management platform with $160B in AuM, is amongst the first to approve four ETFs for their clients, signaling broader acceptance of crypto in traditional portfolios.
Figure 1: BTC’s Correlation with S&P500
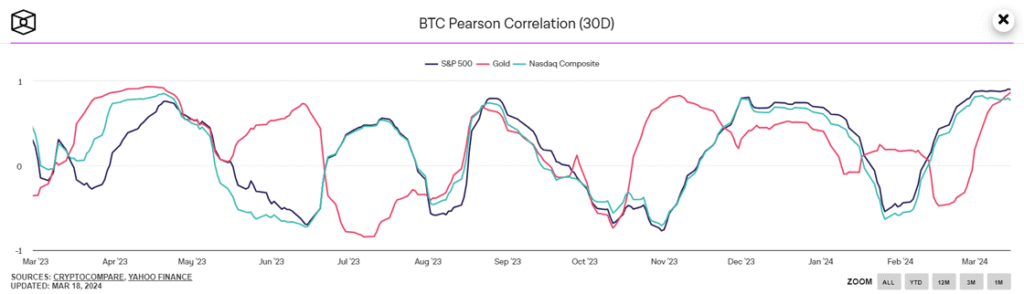
Source: The Block
Ethereum’s Dencun Upgrade and its Impact on Layer 2s
Ethereum’s long-anticipated Dencun upgrade has finally gone live on March 13. Following months of iteration to ensure that the network is ready to implement “blobs,” a new method for storing L2 transactions on Ethereum that would significantly reduce gas fees. Thus, although the Dencun upgrade doesn’t directly resolve Ethereum’s elevated fees, it alleviates the costs for scalability solutions built on top of it, such as Arbitrum and Optimism, by leveraging blobs. Less than one week following the upgrade, some Layer 2s already see more than a 90% decline in median gas fees from a month before, as shown in Figure 2. Nevertheless, we’ll continue monitoring closely, as if demand for blobs on Ethereum exceeds their storage or processing limit, the cost of utilizing them could escalate, leading to higher transaction fees across L2.
Figure 2: Dencun Upgrade Fee Comparison
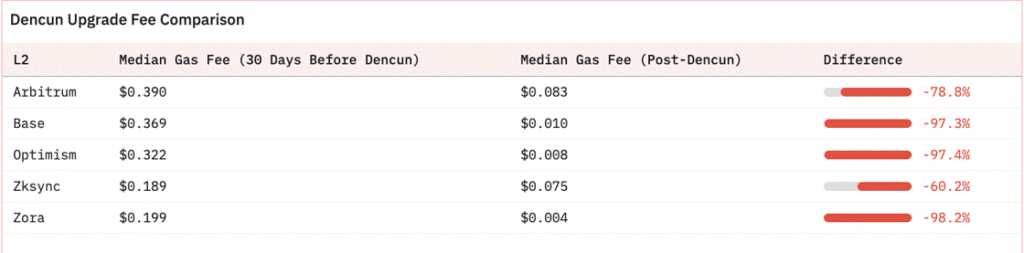
Source: 21co
Although the market is adjusting to the upgrade, Ethereum declined by approximately 13% over the past week, while Optimism and Arbitrum dropped by 28% and 22%, respectively. We anticipate this volatility to persist in the coming month as the broader market takes a pause, influenced by macroeconomic factors discussed earlier, following months of positive price trends. Nevertheless, it is healthy for the market to slow down and undergo a deleveraging event after Ethereum’s open interest surged to an all-time high of $12 billion, surpassing the peak of November 2021 by $500 million. This correction is beneficial for readjusting overextended positions, curbing excessive risk-taking, and mitigating heightened volatility, particularly as we approach Q3, which will witness significant events such as the historic BTC halving event in April and the deadline for the SEC’s decision on the ETH ETF applications.
Solana Nearly Surpassing ATH Across Multiple 2021 Metrics
The recent market rally driven by BTC has led to a surge in user activity on the Solana network, reaching its highest levels in two years. While this surge is primarily fueled by a frenzy surrounding meme coins like WIF and politically themed tokens such as ”Tremp” and ”Boden,” it highlights a growing preference for Solana among new and retail users who find Ethereum’s high costs prohibitive. While the recent Dencun upgrade is expected to change this dynamic for ETH L2s, transaction costs on Solana still remain significantly lower at a fraction of the cent, attracting a large influx of new users.
For example, in the first three months of 2024, the network saw a monthly all-time high of 12-13 million new users joining, compared to a monthly average of 11 million during the heightened activity during the LUNA collapse. Additionally, daily active users have surged to 1.4 million, approaching 2021 levels of two million, while the network is on track to process double the peak transactional volume of 2021, with February recording $100T and March witnessing $60T so far, surpassing the previous peak in November 2021 of $55T. Thus, with minimal transaction fees and a plethora of tokens—over 6,000 launched daily, as shown below in Figure 3—it provides a clearer explanation for SOL’s soaring demand as users rush to purchase the token to access the network’s on-chain ecosystem, creating a reflexive demand for the token, akin to the impact on ETH during the ICO craze of 2017. The recent speculation has now pushed Solana’s market cap, not price, to break its ATH, hovering around the $90B mark while explaining why the network’s dexes are logging five times the total volume seen at the end of the last bull cycle while outpacing incumbents like Uniswap V3 on Ethereum.
Figure 3: Total Number of New Solana-Based Tokens (SPL) Created on a Daily Basis
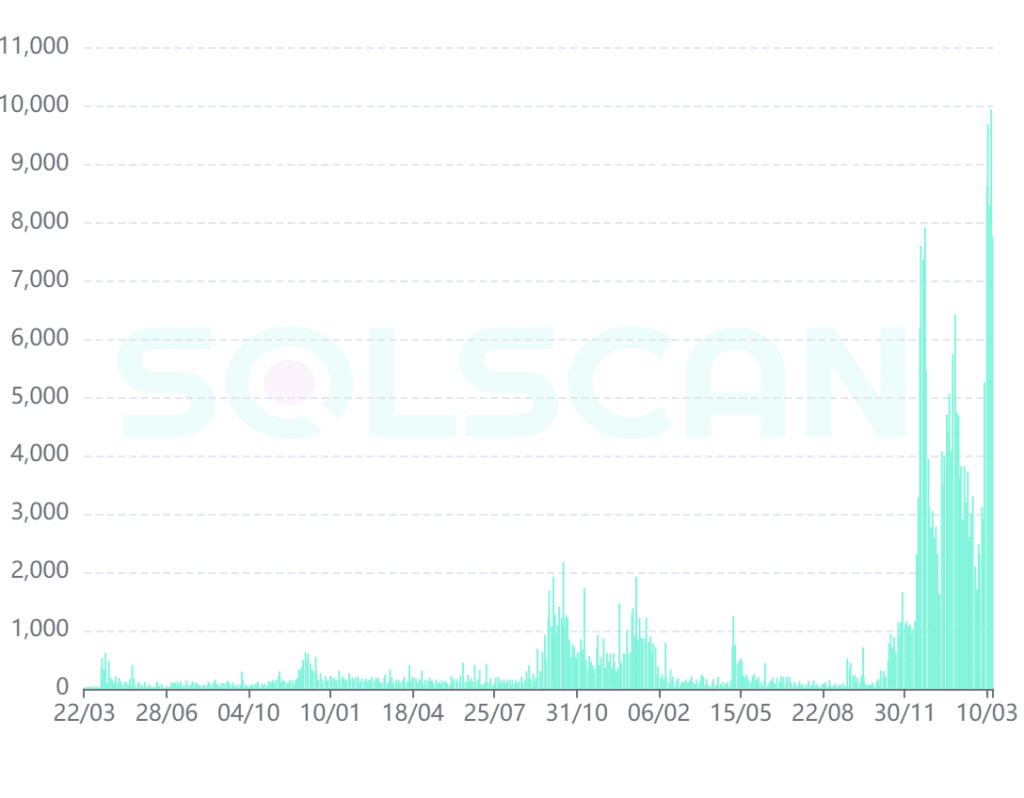
Source: Solscan
This Week’s Calendar
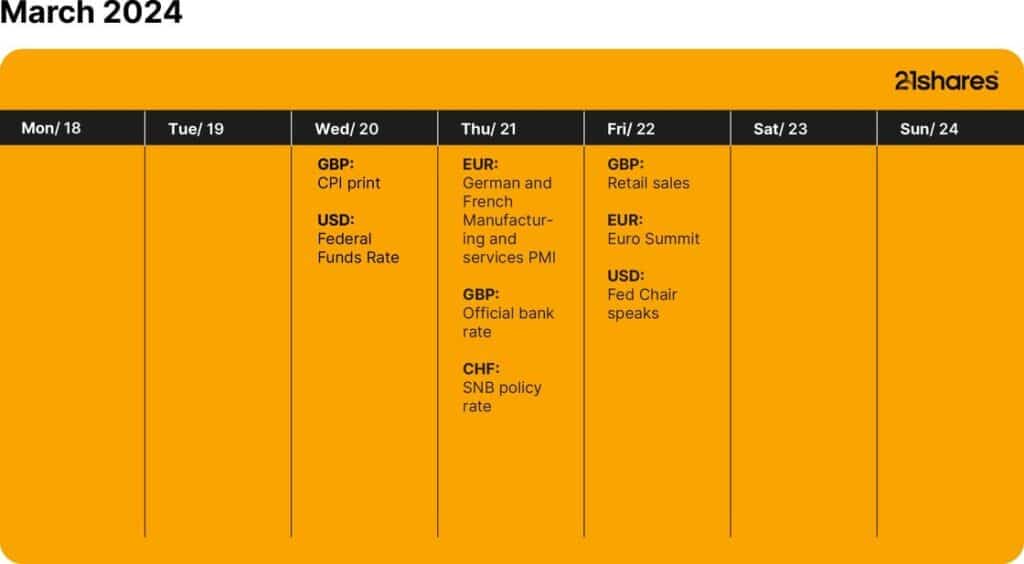
Source: Forex Factory, 21Shares
Research Newsletter
Each week the 21Shares Research team will publish our data-driven insights into the crypto asset world through this newsletter. Please direct any comments, questions, and words of feedback to research@21shares.com
Disclaimer
The information provided does not constitute a prospectus or other offering material and does not contain or constitute an offer to sell or a solicitation of any offer to buy securities in any jurisdiction. Some of the information published herein may contain forward-looking statements. Readers are cautioned that any such forward-looking statements are not guarantees of future performance and involve risks and uncertainties and that actual results may differ materially from those in the forward-looking statements as a result of various factors. The information contained herein may not be considered as economic, legal, tax or other advice and users are cautioned to base investment decisions or other decisions solely on the content hereof.


Vilken typ av sektor ETFer finns det?

LVLD ETF investerar i ett urval av företag världen över med låg volatilitet

Den europeiska ETF-revolutionen: Skiftet som ritar om kartan för kapitalförvaltning
EEAK ETF investerar i eurodenominerade statsobligationer från eurozonen

HEQQ ETF mål är att ge långsiktig kapitaltillväxt

USA satsar 2 miljarder dollar på kvantdatorer – så kan investerare dra nytta av utvecklingen

Extrema skillnader: Varför presterar Europas kvantdator-ETFer så olika?

QQCC ETF följer företag världen över som är aktiva inom kvantberäkning

Fastställd utdelning i MONTDIV maj 2026

Varför Plus500 är en dröm för finans-affiliate
-
 Nyheter4 veckor sedan
USA satsar 2 miljarder dollar på kvantdatorer – så kan investerare dra nytta av utvecklingen
-
 Nyheter3 veckor sedan
Extrema skillnader: Varför presterar Europas kvantdator-ETFer så olika?
-
 Nyheter3 veckor sedan
QQCC ETF följer företag världen över som är aktiva inom kvantberäkning
-
 Nyheter4 veckor sedan
Fastställd utdelning i MONTDIV maj 2026
-
 Nyheter3 veckor sedan
Varför Plus500 är en dröm för finans-affiliate
-

 Nyheter1 vecka sedan
Den osynliga flaskhalsen i AI-boomen: Varför elinfrastruktur är nästa stora megatrend
-

 Nyheter3 veckor sedan
ETFer för fotbolls-VM 2026
-

 Nyheter4 veckor sedan
21shares produkter nu finns tillgängliga hos Revolut