Nyheter
How Banning Tornado Cash and Taming Inflation Affected the Crypto Market

The total cryptoassets market cap decreased by around 10% month-over-month, according to data gathered by CoinMarketCap. The decline followed the hawkish measures the Federal Reserve’s chair alluded to in his speech on Friday. Bitcoin and Ethereum declined by -16.26% and -10.1% respectively. As shown in the figure below, last month’s three outliers appear to be Ethereum scalability solutions Optimism, Metis, and Polygon who saw 68.23%, 46.35% and 2.96% respectively in the TVL growth over the past month, however, the returns haven’t been positive given the decline of the underlying assets. In the meantime, leading DeFi protocols saw their TVL and returns in the negatives.
Figure 1: Price and TVL developments of the major crypto categories

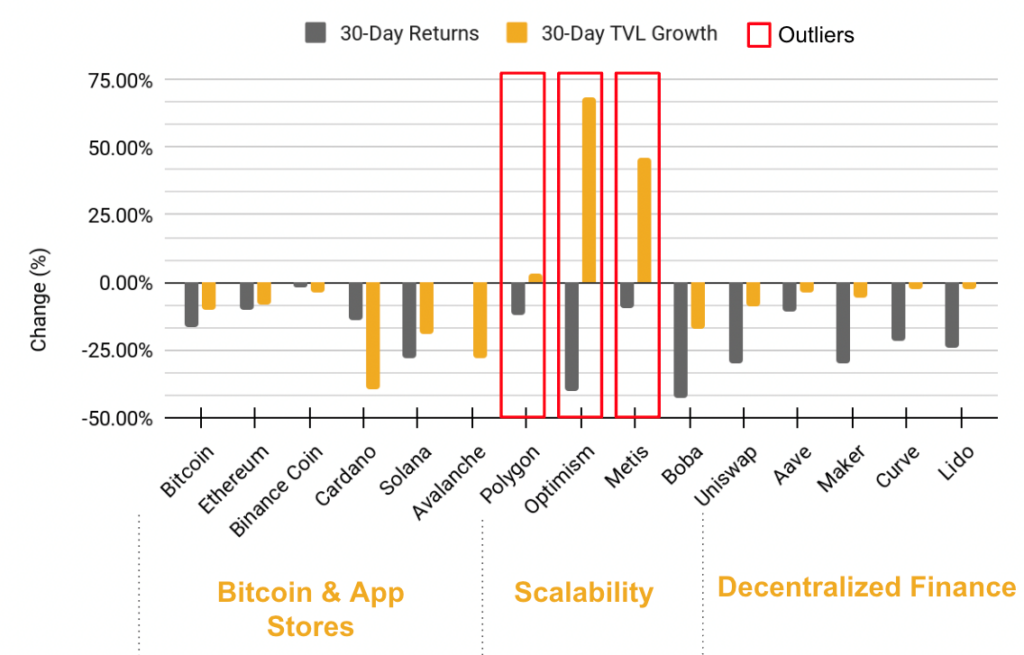
Source: 21Shares, Coingecko, DeFi Llama
Key takeaways
• Ramifications of the Tornado Cash ban on the regulatory front
• DeFi Blue Chips exclusively side with ETHPOS
• Ethereum’s testnets transition to POS, next landmark is the mainnet merge on Sep 15
• Ethereum’s NFT trading volume drop by 17.4% month-over-month
Spot and Derivatives Markets
Figure 2: Total Liquidations of Long and Short Positions

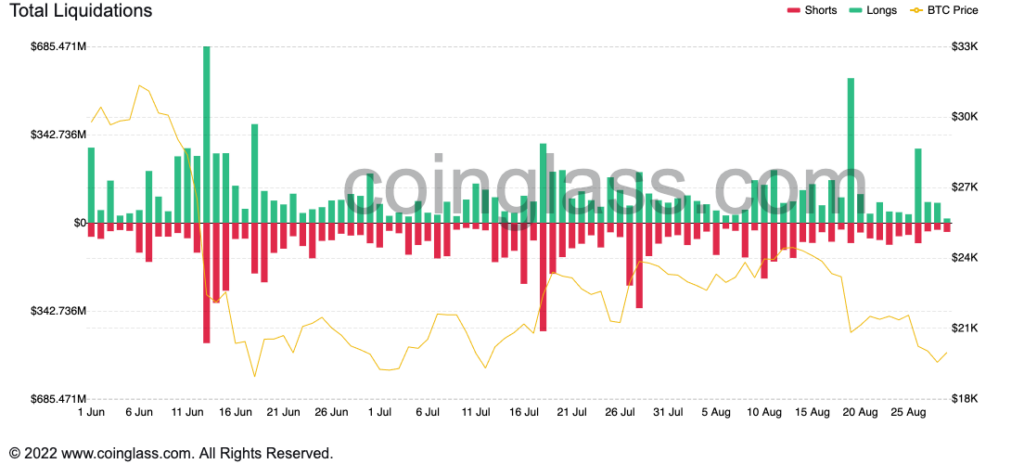
Source: Coinglass
There have been liquidations of over $950M from the crypto futures market over the last two consecutive weekends in August. Over $600M of long and short positions were liquidated on August 19 following the meeting minutes of the Federal Reserve and over $350M was liquidated following Jerome Powell’s speech announcing hawkish measures to tame inflation. These liquidations may have escalated the downward trend of Bitcoin and the rest of the cryptoasset market.
On-chain Indicators
Figure 3: Ethereum MVRV Z-Score

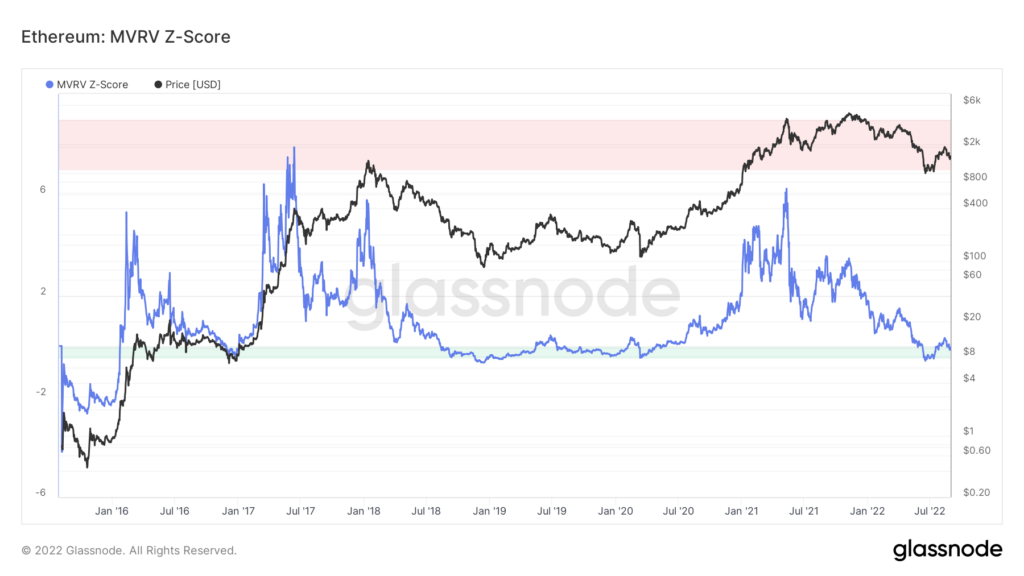
Source: Glassnode
Fifteen days ahead of the long-awaited Merge, the MVRV Z-Score indicator will help assess the valuation of Ethereum. In Figure 3, we can see that the MVRV Z-Score and the market price have been parting ways on May 9, 2021, as Ethereum rushed towards a market top (red zone). Historically, this indicates that Ethereum’s realized price reached a market bottom (green zone) similar to that of November 2016 as shown in the figure.
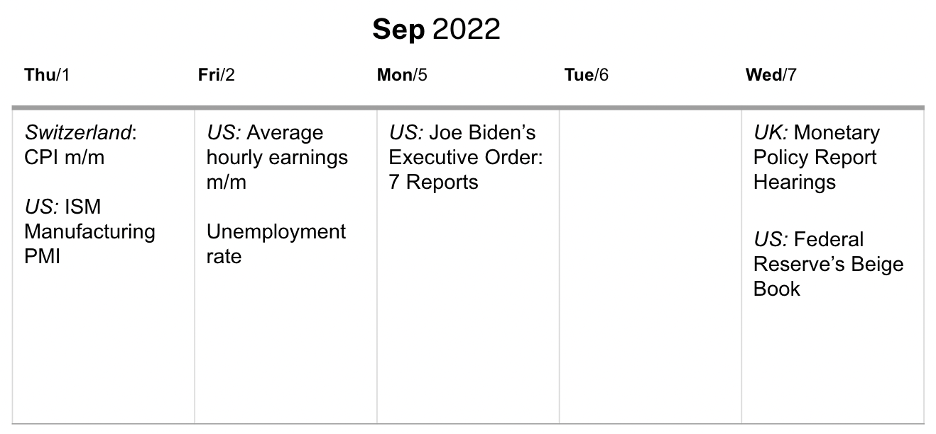
Next Week’s Calendar
As mentioned earlier in this report, September will be a busy month when policymakers and regulators are back from the European summer break. There are also some important indicators that are being released this month such as the ISM Manufacturing Purchasing Managers Index, which is a leading indicator for the US economy. The Average Hourly Earnings report being released on the following day is a significant indicator of overall economic health as spending is correlated to market conditions.

Read full report here
Research Newsletter
Each week the 21Shares Research team will publish our data-driven insights into the crypto asset world through this newsletter. Please direct any comments, questions, and words of feedback to research@21shares.com
Disclaimer
The information provided does not constitute a prospectus or other offering material and does not contain or constitute an offer to sell or a solicitation of any offer to buy securities in any jurisdiction. Some of the information published herein may contain forward-looking statements. Readers are cautioned that any such forward-looking statements are not guarantees of future performance and involve risks and uncertainties and that actual results may differ materially from those in the forward-looking statements as a result of various factors. The information contained herein may not be considered as economic, legal, tax or other advice and users are cautioned to base investment decisions or other decisions solely on the content hereof.