
Nyheter
Has Gold’s Cyclical Bear Market Found a Base?
Has Gold’s Cyclical Bear Market Found a Base? Van Eck Global’s gold specialist Joe Foster shares his monthly perspective on the gold market.
Gold Markets Eye Fed’s December Move
Once again, we must report that the outlook for the Federal Reserve Bank’s (Fed’s) rate decision influenced the movements in the gold price in October. Leaving rates unchanged is considered supportive for gold because it implies weakness in the economy, a lower U.S. dollar, and potentially lower real rates. Gold advanced on October 2 when disappointing September U.S. non-farm payrolls meant lower odds of a Fed rate increase. Gold reached its $1,191 per ounce high for the month on October 15 following retail sales that were below expectations and producer prices that fell more than forecasts predicted. Poor economic results continued with the release of downward pointing monthly reports for durable goods, consumer confidence, and other leading indicators. However, on October 28, the Fed released its post-FOMC (Federal Open Market Committee) meeting statement, which the market interpreted as increasing the likelihood of a December rate hike. In the statement, the Fed dropped previous warnings on global risk and focused on gains in household spending. As a result of the Fed’s comments, the gold price partially lost earlier gains and ended the month with a $27.09 advance (2.4%) at $1,142.16 per ounce.
Gold Stocks Perk Up
Gold stocks perked up in October, although they also saw weakness following the FOMC statement. In October, the NYSE Arca Gold Miners Index1 gained 9.2% while the Market Vectors Junior Gold Miners Index2 advanced 5.1%. Third quarter reporting started in the last week of October and will run into November. So far we are pleased with the sector’s improving operating performance. In our opinion, companies have done a good job driving down costs and early reports suggest this trend is continuing. For example, Agnico Eagle Mines Limited (7.7% of INIVX net assets) lowered the midpoint of its all-in mining cost guidance from $880 per ounce to $850, Newmont (1.9% of net assets) from $950 per ounce to $910, and Eldorado Gold Corporation (4.8% of net assets) from $925 per ounce to $870. [Access a current list of INIVX holdings.]
Positive Trends Since July
A symptom of the economic weakness in China is its foreign exchange (forex) reserves, which have been in decline since June 2014 and are down $329 billion (8.6%) so far this year. Despite this, the Peoples Bank of China (PBOC) continues to buy significant amounts of gold to add to its forex reserves. In July, the PBOC began announcing monthly changes in its official gold reserves. For the third quarter, the PBOC added 50 tonnes, which exceeds its annualized pace of 100 tonnes per year for the last six years. Meanwhile, the Chinese Gold and Silver Exchange Society believes gold consumption may match or exceed the record set in 2013. Robust Chinese demand helps underpin prices in an otherwise weak market.
Since gold fell to its cycle low of $1,072 per ounce in July, we feel it has embarked on a positive trend. Each time gold makes new lows in the bear market, we see a similar pattern, and investors wonder whether this positive trend is sustainable. The recent fundamental drivers have been safe haven3 demand due to jitters over the collapse of the Chinese stock market in August and uncertainty surrounding the Fed’s rate decision. It feels as if markets are being held hostage until the next FOMC meeting in December. Perhaps there will be answers to the multitude of questions that create uncertainty: Will rates be increased? How will markets react? How much is already priced into the gold market? How much is priced into the U.S. dollar? How will emerging economies behave? What will be the pace of rate increases? Will they have to reverse course? Until there is more clarity, it is difficult to say whether this is another false start for gold or the beginning of a lasting trend.
Analyzing Gold and Gold Equities
Many who follow gold stocks are puzzled by the depths to which they have fallen. There are several ways of analyzing this, some of which are misleading. Chart 1 shows the ratio of the NYSE Gold Miners Index (GDM) to gold at all-time lows, well below the levels of the 2008 credit crisis crash or the 1980–2001 secular bear market. This chart depicts the unprecedented decline in gold stocks.

Source: Bloomberg, Van Eck Research. Not illustrative of an investment in the Fund. Historical information is not a forecast of future events, a guarantee of future results or investment advice. Current market conditions may not continue.
The GDM index saw its cycle low of 348 on September 11, 2015. The last time it was this low was in 2002 when gold was $300 per ounce. We do not believe that this means stocks are anticipating much lower gold prices. The average all-in mining cost for our coverage universe is $920 per ounce. We do not know of any mines that are producing gold for $300 per ounce. In fact, in our view, high cost mines would begin shutting down at around the $1,000 per ounce level and the entire industry would likely to cease to exist long before gold reached $300.
These can be valid ways of looking at markets, however, for gold and gold stocks they are misleading because they fail to capture important changes in the fundamentals of the industry over the past 15 years. To demonstrate and quantify these changes, we look to Chart 2. This chart uses the same data as Chart 1, but displays it as an x-y plot, rather than a ratio.

Source: Bloomberg, Van Eck Research. Not illustrative of an investment in the Fund. Historical information is not a forecast of future events, a guarantee of future results or investment advice. Current market conditions may not continue.
The first thing to notice is that gold and the GDM form three distinct trends over different periods. The transition between trends is shown as open circles. The correlation statistics (R-squared) for each trend is close to a perfect 1.00,4 which means that there is indeed a very strong correlation between gold bullion and gold shares.
Each trend is positioned progressively to the right at higher gold prices. This means that higher gold prices have been required to maintain the same GDM value. Each time the trend shifts from A to B to C, stocks are de-rating due to a loss in value. In the late 1990s, many companies became heavily hedged, locking in future production at low prices. When the bull market started, they were unable to take advantage of higher prices until in the 2000s, when they started spending billions of dollars to buy back their hedge books. As a result of what appear to be irresponsible hedging policies, gold stocks devalued from Trend A to B. The good news is that today the industry remains essentially unhedged, not wanting to repeat the mistakes of the past.
A different type of mistake caused the second devaluation form Trend B to C. The global mining industry was the victim of double-digit cost inflation during the 2008 to 2011 period of Trend B. The gold miners were not immune to this, and shareholders saw profit margins squeezed and capital cost escalations that diminished returns on new projects. Frustrated by the relentless rise in costs and missed expectations, the market de-rated the sector to its current Trend C. As has been the case with hedging, we believe the industry will not repeat the mistakes of the past. Managements are now focused on maintaining operational excellence and preserving margins.
To be fair, in the 1990s there were many companies with policies against hedging, and more recently there have been many with prudent cost controls. We have aimed to generate alpha5 in our portfolios by avoiding hedged producers and investing in companies with low costs and manageable debt. However, the majors have struggled the most with the problems that have plagued the industry. These companies dominate the indices and they are the “go-to” names for large generalist investors. In our view, poor leadership has cast a negative image across the broader industry.
We do not believe the industry will encounter further de-ratings in the future. We believe that a “Trend D” is not in the cards because the hard lessons that have been learned will not be forgotten, and companies should be able to maintain value. It is also unlikely that the industry re-rates higher towards Trend B. In order to create a positive step-change in value, it would take revolutionary technology or substantially more high-grade discoveries that enable low-cost mines to be built. While some companies are likely to make game-changing discoveries, we do not see it happening for the industry as a whole. Budgets have been slashed and geologic limitations have made exploration success harder to come by.
This Cyclical Bear Market Continues to Find a Base
This means that Trend C is probably the “new normal”, and, if so, what can we expect? The stocks are exhibiting considerable beta6 to the gold price. From the September close of $1,142 per ounce, a $100 (8.7%) change in the gold price caused a 36.4% change in the GDM along Trendline C. At higher gold prices the beta diminishes, but is still significant. For example, a $100 (6.2%) change from $1,600 per ounce causes a 13.7% change in the GDM along the trendline. Fundamentally, we explain this through optionality and leverage. At lower gold prices the volatility increases as stocks trade more like pure options. Around the $1,000 per ounce gold price, the industry does not generate any free cash and has little intrinsic value. However, there is still investment demand for the equities as options on higher gold prices.
Leverage at low gold prices also causes increased volatility and beta. Operating leverage increases when earnings and cash flows are at depressed levels. Small changes in the gold price can provide large percentage changes in earnings. For companies with high debt loads, there is also substantial financial leverage at low gold prices because so much of their cash flow is tied up in servicing debt.
While the near-term outlook for gold is murky, we expect to see plenty of volatility as this cyclical bear market continues to find a base.
by Joe Foster, Portfolio Manager/Strategist
With more than 30 years of gold industry experience, Foster began his gold career as a boots on the ground geologist, evaluating mining exploration and development projects. Foster offers a unique perspective on gold and the precious metals asset class.
Important Information For Foreign Investors
This document does not constitute an offering or invitation to invest or acquire financial instruments. The use of this material is for general information purposes.
Please note that Van Eck Securities Corporation offers actively managed and passively managed investment products that invest in the asset class(es) included in this material. Gold investments can be significantly affected by international economic, monetary and political developments. Gold equities may decline in value due to developments specific to the gold industry, and are subject to interest rate risk and market risk. Investments in foreign securities involve risks related to adverse political and economic developments unique to a country or a region, currency fluctuations or controls, and the possibility of arbitrary action by foreign governments, including the takeover of property without adequate compensation or imposition of prohibitive taxation.
Please note that Joe Foster is the Portfolio Manager of an actively managed gold strategy.
Any indices listed are unmanaged indices and include the reinvestment of all dividends, but do not reflect the payment of transaction costs, advisory fees or expenses that are associated with an investment in the Fund. An index’s performance is not illustrative of the Fund’s performance. Indices are not securities in which investments can be made.
1NYSE Arca Gold Miners Index (GDMNTR) is a modified market capitalization-weighted index comprised of publicly traded companies involved primarily in the mining for gold. 2Market Vectors Junior Gold Miners Index (MVGDXJTR) is a rules-based, modified market capitalization-weighted, float-adjusted index comprised of a global universe of publicly traded small- and medium-capitalization companies that generate at least 50% of their revenues from gold and/or silver mining, hold real property that has the potential to produce at least 50% of the company’s revenue from gold or silver mining when developed, or primarily invest in gold or silver. 3Tail risk is the risk of an asset or portfolio of assets moving more than three standard deviations from its current price. 4S&P 500® Index (S&P 500) consists of 500 widely held common stocks covering industrial, utility, financial, and transportation sectors. 5Dot-com bubble grew out of a combination of the presence of speculative or fad-based investing, the abundance of venture capital funding for startups and the failure of dotcoms to turn a profit. Investors poured money into internet startups during the 1990s in the hope that those companies would one day become profitable, and many investors and venture capitalists abandoned a cautious approach for fear of not being able to cash in on the growing use of the internet. 6Source: Bloomberg.
Please note that the information herein represents the opinion of the author and these opinions may change at any time and from time to time. Not intended to be a forecast of future events, a guarantee of future results or investment advice. Historical performance is not indicative of future results; current data may differ from data quoted. Current market conditions may not continue. Non-Van Eck Global proprietary information contained herein has been obtained from sources believed to be reliable, but not guaranteed. No part of this material may be reproduced in any form, or referred to in any other publication, without express written permission of Van Eck Global. ©2015 Van Eck Global.


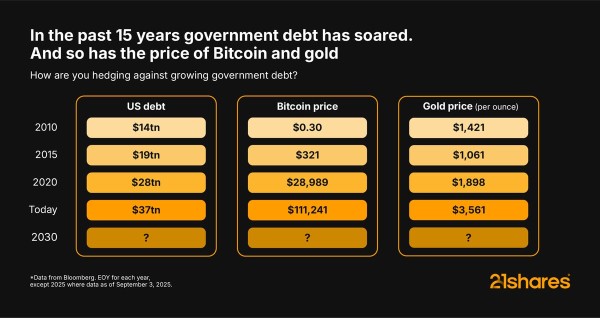
Amid soaring US debt and Gold’s steady gains, Bitcoin has continued to deliver strong returns over the past 15 years. Its scarcity and decentralization make it a hedge that investors can’t ignore, providing new ways to pursue growth, security, and opportunity in an evolving financial landscape.

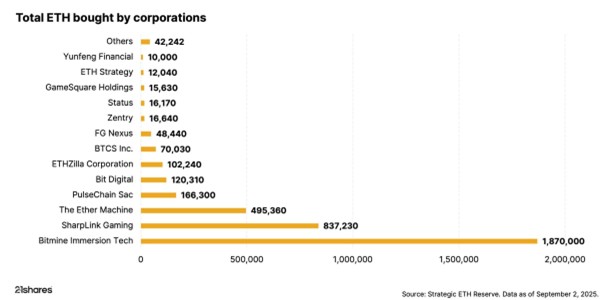
Investors can’t ignore the corporate world’s big bet on Ethereum
Ethereum is stealing the spotlight, as public companies have accumulated over 4.4 million ETH, worth nearly $19 billion, in the past few months. This treasury boom is outpacing Bitcoin’s early adoption and redefining how Wall Street approaches digital assets.


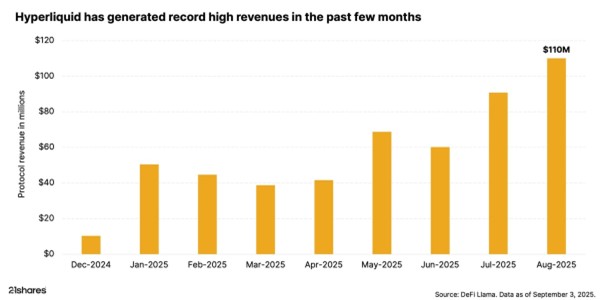
The rise of Hyperliquid: DeFi’s record-breaking powerhouse
Hyperliquid is making waves in DeFi perpetuals by setting new records, leading trading volumes, and propelling its token to all-time highs. Backed by market volatility, high-performance infrastructure, and concentrated liquidity, the platform continues to draw investors and assert its market dominance.

Research Newsletter
Each week the 21Shares Research team will publish our data-driven insights into the crypto asset world through this newsletter. Please direct any comments, questions, and words of feedback to research@21shares.com
Disclaimer
The information provided does not constitute a prospectus or other offering material and does not contain or constitute an offer to sell or a solicitation of any offer to buy securities in any jurisdiction. Some of the information published herein may contain forward-looking statements. Readers are cautioned that any such forward-looking statements are not guarantees of future performance and involve risks and uncertainties and that actual results may differ materially from those in the forward-looking statements as a result of various factors. The information contained herein may not be considered as economic, legal, tax or other advice and users are cautioned to base investment decisions or other decisions solely on the content hereof.

IncomeShares passed three milestones in August. Assets under management climbed to almost $66 million, cumulative fund flows topped $72 million, and turnover across London and Xetra listings reached over $27 million. Palantir paid the highest annualised distribution yield at 57.11%. The sections below break the numbers down in more detail.
Cumulative fund flows
Fund flows track how much money investors put into or take out of IncomeShares ETPs (exchange-traded products). Positive flows mean more money coming in than going out – a sign of demand for the products.
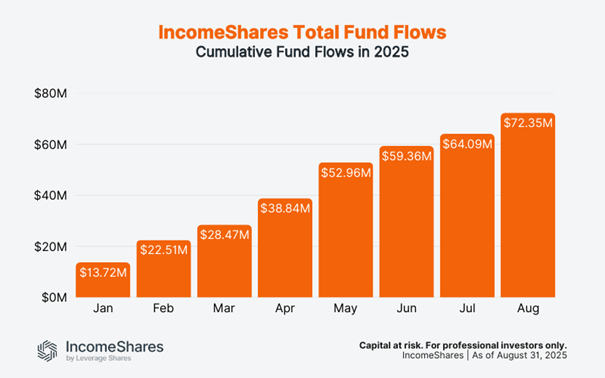
Flows have risen every month this year. In January, they stood at $13.7 million. By the end of August, they reached $72.4 million. That’s over $8 million of new money added in August alone – the biggest increase since May.
Trading turnover
Turnover is the total dollar value of IncomeShares ETPs bought and sold on the exchanges. Higher turnover means more activity and liquidity for investors.
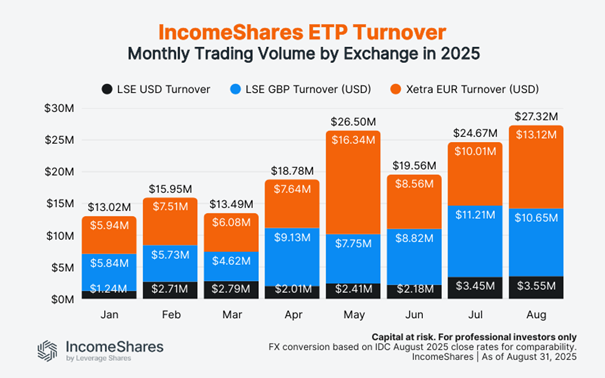
Turnover reached $27.3 million in August – the highest on record and more than double January’s $13.0 million. London listings (USD and GBP combined) made up $14.2 million, with Xetra listings close behind at $13.1 million. Both exchanges have seen steady increases through 2025, showing rising interest in income options strategies across the board.
Note: Figures use IDC FX rates as of the August month-end to convert GBP and EUR into USD. We apply the same August rates to all prior months to compare turnover on a like-for-like basis.
Assets under management (AUM)
AUM is the total value of assets held across all IncomeShares ETPs. It grows when new investors buy in, or when the underlying assets rise in value.
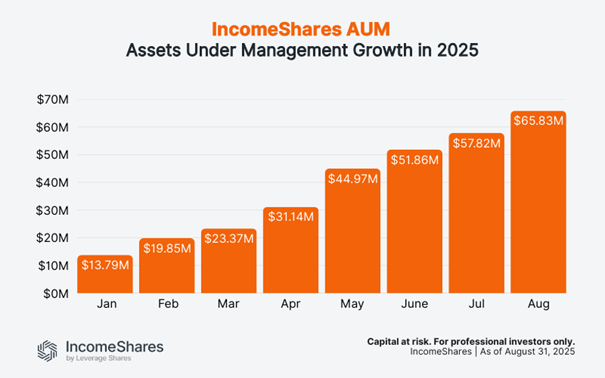
AUM grew from $13.8 million in January to $65.8 million at the end of August. It was also $8 million more than in July. Steady inflows and consistent income distributions are helping the product range build scale.
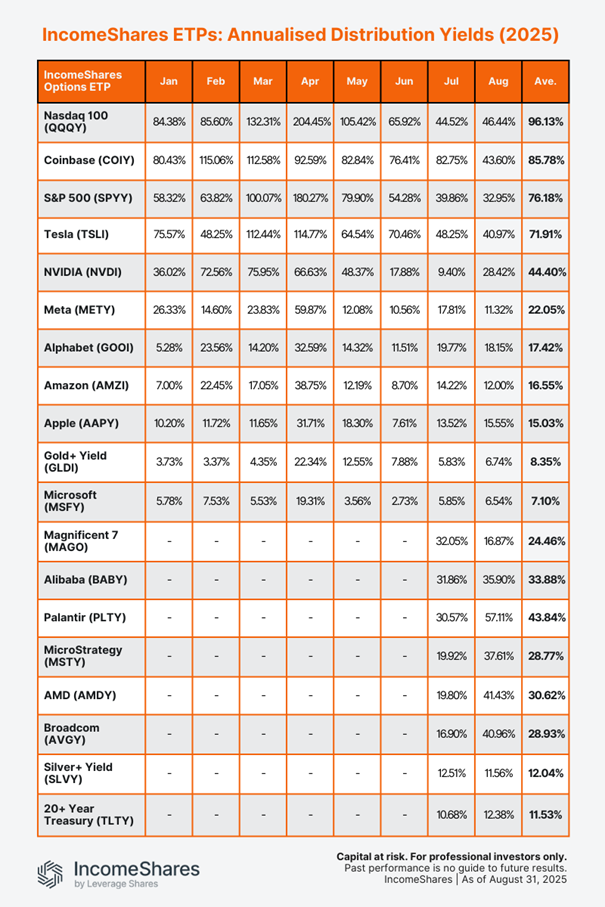
Distribution yields
Distribution yields represent the annualised income paid to investors as a percentage of the current NAV (net asset value), based on the latest month’s yield. IncomeShares ETPs aim to generate this income from selling options. Yields change each month depending on strategy performance and market volatility.
Annualised August yields (ranked highest to lowest):
• Palantir Options ETP (PLTY): 57.11%
• Nasdaq 100 Options ETP (QQQY): 46.44%
• Coinbase Options ETP (COIY): 43.60%
• AMD Options ETP (AMDY): 41.43%
• Tesla Options ETP (TSLI): 40.97%
• Broadcom Options ETP (AVGY): 40.96%
• MicroStrategy Options ETP (MSTY): 37.61%
• Alibaba Options ETP (BABY): 35.90%
• S&P 500 Options ETP (SPYY): 32.95%
• NVIDIA Options ETP (NVDI): 28.42%
• Alphabet Options ETP (GOOI): 18.15%
• Magnificent 7 Options ETP (MAGO): 16.87%
• Apple Options ETP (AAPPY): 15.55%
• 20+ Year Treasury Options ETP (TLTY): 12.38%
• Amazon Options ETP (AMZI): 12.00%
• Silver+ Yield Options ETP (SLVY): 11.56%
• Meta Options ETP (METY): 11.32%
• Gold+ Yield Options ETP (GLDI): 6.74%
• Microsoft Options ETP (MSFY): 6.54%
Our Palantir ETP topped the list with an annualised yield of 57.11% for August, up from 30.57% in July. The stock was volatile in August, trading between $142 and $190. That wider range increased option premiums, which boosted the ETP’s yield. The ETP sells put options on Palantir stock and holds shares – the strategy used for all our single stock ETPs and the Magnificent 7 product.
The Nasdaq 100 ETP paid an annualised yield of 46.44% in August, up slightly from 44.52% in July. At the other end, Gold+ and Microsoft stayed below 7%, reflecting relatively calmer conditions in their underlying assets.
The table below shows the annalised distribution yields for all IncomeShares ETPs so far this year. Note that the bottom eight ETPs launched in late June, so they only have yields for July and August.
Key takeaways
• Fund flows climbed to $72.4 million, with August adding more than $8 million.
• Turnover hit a record $27.3 million, split almost evenly between London and Xetra.
• Palantir topped the yield table at 57%, with Nasdaq 100 and Coinbase also paying above 40%.

Concerned about rising government debt? Bitcoin’s got you covered

N100 ETF följer det amerikanska Nasdaq 100 indexet

IncomeShares Monthly Investor Update – August 2025

CHSJ ETF investerar i CLO-obligationer

HYPE ETP ger exponering mot Hyperliquid

VALOUR ARB SEK spårar priset på kryptovalutan Arbitrum

Månadsutdelande ETFer uppdaterad med IncomeShares produkter

HANetfs analyserar hur ett fredsavtal kan påverka det europeiska försvaret

Utdelningar och försvarsfonder lockade i augusti

De bästa innovations-ETFerna
-
 Nyheter4 veckor sedan
VALOUR ARB SEK spårar priset på kryptovalutan Arbitrum
-
 Nyheter2 veckor sedan
Månadsutdelande ETFer uppdaterad med IncomeShares produkter
-
 Nyheter2 veckor sedan
HANetfs analyserar hur ett fredsavtal kan påverka det europeiska försvaret
-
 Nyheter1 vecka sedan
Utdelningar och försvarsfonder lockade i augusti
-
 Nyheter4 veckor sedan
De bästa innovations-ETFerna
-

 Nyheter3 veckor sedan
HANetfs VD kommenterar Trump-Putin-toppmötet
-

 Nyheter2 veckor sedan
ADLT ETF investerar bara i riktigt långa amerikanska statsobligationer
-
 Nyheter4 veckor sedan
IncomeShares når 60 miljoner dollar i förvaltat kapital – Tillväxtöversikt 2025