
Nyheter
ETFmarknaden i Europa firar sitt 24-årsjubileum med tillgångar på två biljoner USD

ETFGI, ett ledande oberoende forsknings- och konsultföretag som täcker trender i det globala ETF-ekosystemet, rapporterar att ETFmarknaden i Europa firar sitt 24-årsjubileum med rekordtillgångar på nästan 2 biljoner US-dollar. De första europanoterade ETF:erna gjorde sin debut den 11 april 2000. Dessa två ETFer var baserade på Euro Stoxx 50– och Stoxx Europe 50-indexen, och de var noterade på Deutsche Boerse i Tyskland.
Tillgångar som investerats i ETF-branschen i Europa nådde rekordhöga 1,96 biljoner USD i slutet av mars. Under mars samlade ETF-branschen i Europa nettoinflöden på 11,02 miljarder USD, vilket ger årets nettoinflöden till 49,52 miljarder USD, enligt ETFGIs mars 2024 europeiska ETFer och ETPers industrilandskapsrapport, den månatliga rapporten som är en del av en årlig betald forskningsprenumerationstjänst. (Alla dollarvärden i USD om inget annat anges.)
Höjdpunkter
- Tillgångar som investerats på ETFmarknaden i Europa nådde ett rekord på 1,96 Tn i slutet av mars och slog det tidigare rekordet på 1,90 Tn i slutet av februari 2024.
- Tillgångarna ökade med 7,8 % YTD 2024, från 1,82 Tn USD i slutet av 2023 till 1,96 Tn USD.
- Nettoinflöden på 11,02 miljarder USD i mars 2024.
- YTD nettoinflöden på 49,52 miljarder USD är tredje högsta någonsin efter YTD nettoinflöden på 59,30 miljarder USD 2021 och YTD nettoinflöden på 49,73 miljarder USD 2022.
- Artonde månaden med på varandra följande nettoinflöden.
”S&P 500-indexet ökade med 3,22 % i mars och är upp 10,56 % YTD 2024. De utvecklade marknaderna exklusive det amerikanska indexet ökade med 3,62 % i mars och steg 5,26 % YTD 2024. Spanien (upp 10,72 %) och Italien (upp 6,34 %) såg de största ökningarna bland de utvecklade marknaderna i mars. Emerging markets-indexet ökade med 1,50 % under mars och steg 2,08 % YTD 2024. Peru (upp 10,27 %) och Columbia (upp 8,19 %) såg de största ökningarna bland tillväxtmarknaderna i mars”, enligt Deborah Fuhr, managing partner, grundare och ägare av ETFGI.
Tillgångstillväxt i ETF-branschen i slutet av mars
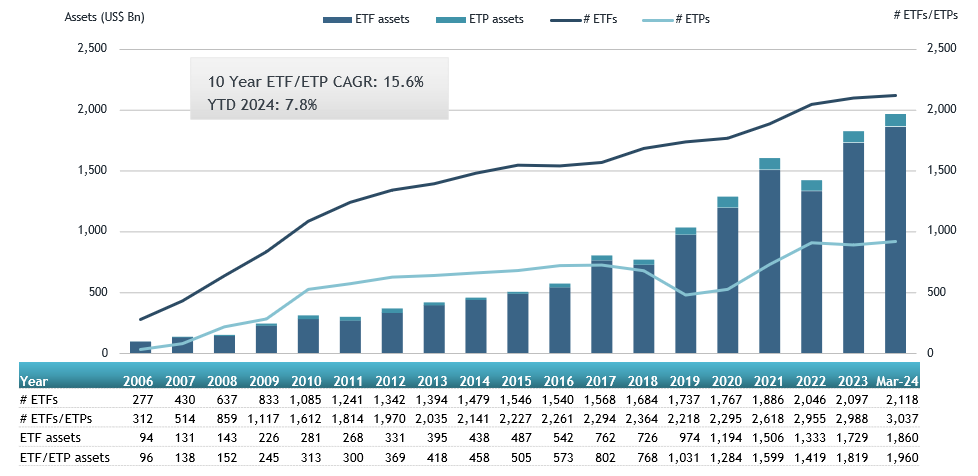
Källa: ETFGI
I slutet av mars hade ETFmarknaden i Europa 3 037 produkter, med 12 209 noteringar, tillgångar på $1,96 Tn, från 99 leverantörer listade på 29 börser i 24 länder.
Under mars samlade ETFer nettoinflöden till 11,02 miljarder USD. Aktie-ETFer samlade nettoinflöden på 9,81 miljarder USD under mars, vilket förde YTD nettoinflöden till 39,30 miljarder USD, högre än 19,38 miljarder USD i nettoinflöden av eget kapital YTD 2023. Ränte-ETFer rapporterade nettoinflöden på 719,00 USD YTD under 1 mars, vilket gav 25 USD nettoinflöden. miljarder, lägre än 15,49 miljarder USD i nettoinflöden YTD år 2023. Råvaru-ETFer rapporterade nettoutflöden på 75,35 miljoner USD under mars, vilket förde YTD nettoutflöden till 2,32 miljarder USD, lägre än 1,67 miljarder USD i nettoinflöden YTD 2023. på 670,27 miljoner USD under månaden, vilket samlade ett nettoinflöde för året i Europa på 2,33 miljarder USD, högre än 2,17 miljarder USD i nettoinflöden YTD 2023.
Betydande inflöden kan tillskrivas de 20 bästa ETFerna av nya nettotillgångar, som samlat in 9,63 miljarder USD under mars. iShares Core S&P 500 UCITS ETF – Acc (CSSPX SW) samlade in 918,91 miljoner USD, det största enskilda nettoinflödet.
Topp 20 ETFer efter nettoinflöden i mars 2024: Europa
| Namn | Kortnamn | Assets ($ Mn) Mar-24 | NNA ($ Mn) YTD-24 | NNA ($ Mn) Mar-24 |
| iShares Core S&P 500 UCITS ETF – Acc | CSSPX SW | 84,308.60 | 4,744.81 | 918.91 |
| UBS ETF (LU) MSCI United Kingdom UCITS ETF (GBP) A-acc – Acc | UC64 | 2,485.72 | 653.33 | 753.94 |
| Invesco MSCI USA ESG Universal Screened UCITS ETF – Acc | ESGU | 2,188.25 | 792.66 | 741.48 |
| Xtrackers II EUR Overnight Rate Swap UCITS ETF – 1C – Acc | DBXT | 7,281.96 | 2,089.43 | 596.35 |
| HSBC S&P 500 UCITS ETF | H4ZF | 6,756.08 | 661.46 | 562.23 |
| iShares MSCI EM ESG Enhanced UCITS ETF | EEDM | 5,000.88 | 886.95 | 556.22 |
| Vanguard FTSE All-World UCITS ETF | VGWL | 24,771.34 | 1,410.78 | 545.51 |
| Invesco S&P 500 UCITS ETF – Acc | P500 | 25,176.99 | 939.08 | 497.72 |
| iShares MSCI ACWI UCITS ETF – Acc | IUSQ | 12,806.01 | 1,453.06 | 469.35 |
| iShares USD Treasury Bond 0-1yr UCITS ETF | IBCC | 14,990.95 | 1,433.49 | 431.07 |
| iShares € High Yield Corp Bond UCITS ETF | EUNW | 7,694.75 | 1,427.77 | 413.53 |
| SPDR S&P 500 UCITS ETF | SPY5 | 12,491.17 | 3,418.58 | 388.74 |
| iShares Core MSCI World UCITS ETF – Acc | EUNL | 75,051.88 | 3,236.70 | 382.75 |
| Amundi Bloomberg Equal-weight Commodity ex-Agriculture UCITS ETF – Acc | LYTR | 1,668.95 | 367.30 | 378.26 |
| iShares STOXX Europe Small 200 UCITS ETF (DE) | SCXPEX | 916.86 | 401.43 | 357.42 |
| Amundi MSCI Japan UCITS ETF – Acc | LCUJ | 4,400.85 | 158.96 | 343.86 |
| UBS ETF (CH) – MSCI Switzerland (CHF) A-dis – Acc | SWICHA | 1,126.17 | 354.69 | 335.87 |
| SPDR MSCI World UCITS ETF – Acc | SPPW | 5,653.51 | 715.38 | 324.95 |
| Amundi S&P 500 Climate Net Zero Ambition PAB UCITS ETF | ZPA5 | 3,965.66 | 925.46 | 320.42 |
| JPMorgan US Research Enhanced Index Equity ESG UCITS ETF – Acc | JREU | 7,047.30 | 1,230.55 | 315.09 |

Källa ETFGI
De 10 bästa ETPerna av nya nettotillgångar samlade ihop 1,69 miljarder USD under mars. WisdomTree Physical Silver – Acc (PHAG LN) samlade in 832,90 miljoner USD, det största enskilda nettoinflödet.
Topp 10 ETPer efter nettoinflöden i mars 2024: Europa
| Namn | Kortnamn | Assets ($ Mn) Mar-24 | NNA ($ Mn) YTD-24 | NNA ($ Mn) Mar-24 |
| WisdomTree Physical Silver – Acc | VZLC | 2,057.21 | 793.35 | 832.90 |
| iShares Physical Silver ETC – Acc | SSLN | 785.65 | 254.30 | 245.97 |
| Xtrackers IE Physical Gold ETC Securities – Acc | XGDU | 3,640.08 | 231.87 | 167.72 |
| AMUNDI PHYSICAL GOLD ETC (C) – Acc | GOLD | 4,575.61 | 307.29 | 127.12 |
| Xtrackers Physical Gold ETC (EUR) – Acc | XAD5 | 2,202.38 | 92.10 | 80.28 |
| WisdomTree Copper – Acc | OD7C | 1,667.78 | 337.85 | 68.51 |
| Xtrackers Physical Gold Euro Hedged ETC – Acc | XAD1 | 1,335.65 | 5.06 | 50.49 |
| SG ETC FTSE MIB -3x Daily Short Collateralized – Acc | MIB3S | 33.07 | 88.10 | 40.49 |
| 21Shares Toncoin Staking ETP | TONN | 40.81 | 39.94 | 39.94 |
| Invesco Physical Gold ETC – EUR Hdg Acc | 8PSE | 564.18 | 59.65 | 33.11 |

Källa: ETFGI
Investerare har tenderat att investera i Equity ETFs under mars.


Investerare fokuserar ofta på avkastning när det gäller IncomeShares ETPer börshandlade produkter. Och det av goda skäl – våra strategier syftar till att generera regelbunden månadsinkomst genom att sälja optioner.
Men avkastning är bara en del av bilden. Den andra sidan är totalavkastning.
Vad är totalavkastning?
Totalavkastning mäter en investerares totala vinst eller förlust. Den kombinerar två saker:
- Utdelningar som betalas ut som inkomst
- Förändringar i ETP:ns substansvärde (NAV)
Eftersom IncomeShares ETPer betalar ut månadsinkomst sjunker NAV:t naturligt när dessa utdelningar går till investerare. Det är förväntat – men när du lägger till dessa utdelningar igen ser du hela bilden.
Vad visar informationen?
Vi har grupperat våra ETP:er efter deras lanseringsbatcher (juli 2024, augusti 2024, september 2024 och juni 2025). Tabellen nedan visar totalavkastning hittills i notering för varje.
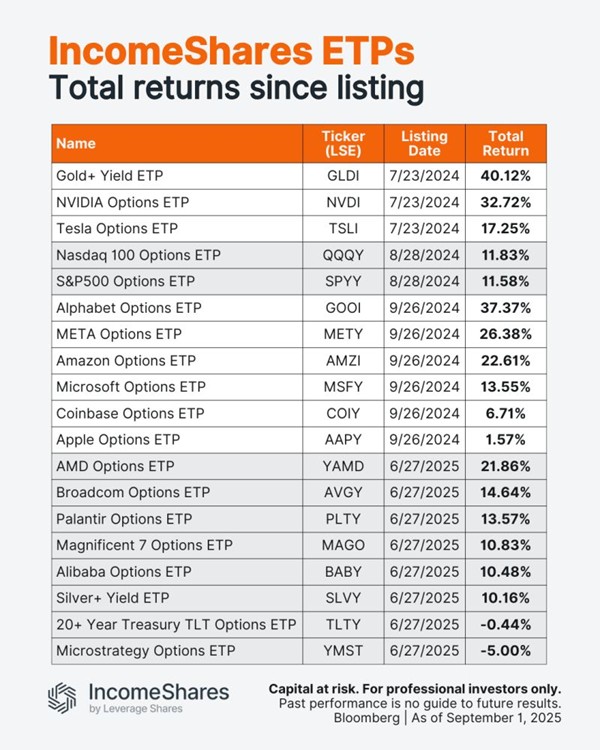
Tidigare resultat är ingen garanti för framtida resultat.
Följ IncomeShares EU för fler uppdateringar.


Septembers utdelning i XACT Norden Högutdelande
IncomeShares ETPer – totalavkastning sedan noteringen

XB30 ETF är en börshandlad fond med slutdatum

HANetf kommenterar att guld når nya rekordnivåer

JEIG ETF köper företagsobligationer från hela världen och valutasäkrar dem

VALOUR ARB SEK spårar priset på kryptovalutan Arbitrum

HANetfs VD kommenterar Trump-Putin-toppmötet

HANetfs analyserar hur ett fredsavtal kan påverka det europeiska försvaret

Månadsutdelande ETFer uppdaterad med IncomeShares produkter

De bästa innovations-ETFerna
-
 Nyheter3 veckor sedan
VALOUR ARB SEK spårar priset på kryptovalutan Arbitrum
-
 Nyheter3 veckor sedan
HANetfs VD kommenterar Trump-Putin-toppmötet
-
 Nyheter2 veckor sedan
HANetfs analyserar hur ett fredsavtal kan påverka det europeiska försvaret
-
 Nyheter2 veckor sedan
Månadsutdelande ETFer uppdaterad med IncomeShares produkter
-
 Nyheter4 veckor sedan
De bästa innovations-ETFerna
-

 Nyheter5 dagar sedan
Utdelningar och försvarsfonder lockade i augusti
-

 Nyheter2 veckor sedan
ADLT ETF investerar bara i riktigt långa amerikanska statsobligationer
-
 Nyheter3 veckor sedan
IncomeShares når 60 miljoner dollar i förvaltat kapital – Tillväxtöversikt 2025