
Nyheter
Gold Seesaws Between Dovish Fed and Upbeat Jobs Report
Commodity ETP Weekly – Gold Seesaws Between Dovish Fed and Upbeat Jobs Report
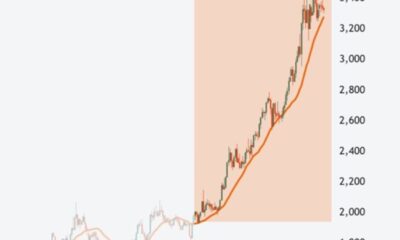
- Positive inflows into Gold ETPs resume after dovish comments by Fed Chair Yellen helped gold post its highest (16.1%) quarterly rise in 30 years. However the positive beat in payrolls might see a reversal in trend.
- Declining US crude oil production helps reverse four consecutive weeks of outflows as investors plough into WTI crude oil ETPs.
- Fall in production in world’s largest copper mining producer help revive inflows into copper ETPs.

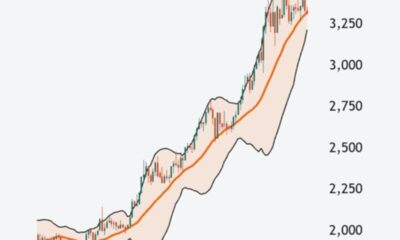
Dovish comments by Fed chair Yellen help revive positive inflows into gold ETPs. Gold prices caught a fresh bid after a more cautious policy trajectory was inferred from Fed chair Yellen’s comments early in the week boosting inflows into gold ETPs by $96.7mn. Furthermore the Fed Chair remained unsure of the durability of the recent spike in inflation reinforcing a more gradual rate normalization path in the US. However we believe the positive beat in payrolls data provides evidence of economic resilience that could allow the Federal Reserve to raise interest rates more often than projected, thereby avoiding a policy error. Silver ETPs also benefited in Gold’s slipstream recording inflows for the 6th consecutive week worth $9.2mn.
Energy ETPs attract strong inflows, led by WTI crude oil. After four consecutive weeks of outflows, WTI crude oil ETPs received positive inflows worth $19.9mn. This is reflective of declining US crude oil production for the fourth month in a row. We expect this decline to continue since drilling activity has been lacklustre with 30% active oil rigs idled over the past 14 weeks. On the other hand oil production by OPEC has risen by 100,000 barrels per day in March owing to Iran and Iraq. The pre-condition laid out by Saudi Arabia to freeze output subject to Iran and other major producers following suit is casting doubts on the ability of these nations to reach an agreement at the next Doha meeting scheduled on April 17. We expect oil prices to trade a volatile range on the back of acrimonious decision making over the capping of oil production limits by OPEC though declining US oil production may help alleviate sharp price drops.
Copper ETPs attract $10.2mn of inflows amid declining production in Chile. According to data from Chile’s (the world’s largest copper mining producer) National Statistics Institute (INE), about 450,000 tons of copper were produced in February, marking a 7% decline in production for the first two months of the year.
Coffee ETPs garner $5.7mn inflows on the back of dry weather conditions. The probability of a deficit in the coffee crop is becoming increasingly likely due to the ongoing dry conditions in Vietnam, Columbia and parts of Brazil. Interestingly the recent appreciation of the producer’s currencies against the US dollar is providing some relief to the pricing pressure faced in the international market however there is no assurance of how long this could last.
Key events to watch this week. Purchasing Managers’ Indices (PMI) for the US, China and UK this week will offer further signs of a slowdown in the services sector. After setting the stage for a more gradual rate normalization path by Fed chair Yellen, investors will focus on the minutes of the March meeting on Wednesday for clues on the timing of the next rate rise. While Thursday sees the unveiling of the minutes of the ECBs March meeting.
Video Presentation
Aneeka Gupta, Research Analyst at ETF Securities provides an analysis of last week’s performance, flow and trading activity in commodity exchange traded products and a look at the week ahead.
For more information contact
ETF Securities Research team
ETF Securities (UK) Limited
T +44 (0) 207 448 4336
E info@etfsecurities.com
Important Information
General
This communication has been provided by ETF Securities (UK) Limited (”ETFS UK”) which is authorised and regulated by the United Kingdom Financial Conduct Authority.


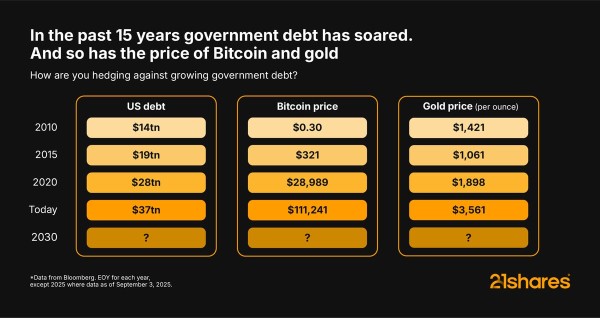
Amid soaring US debt and Gold’s steady gains, Bitcoin has continued to deliver strong returns over the past 15 years. Its scarcity and decentralization make it a hedge that investors can’t ignore, providing new ways to pursue growth, security, and opportunity in an evolving financial landscape.

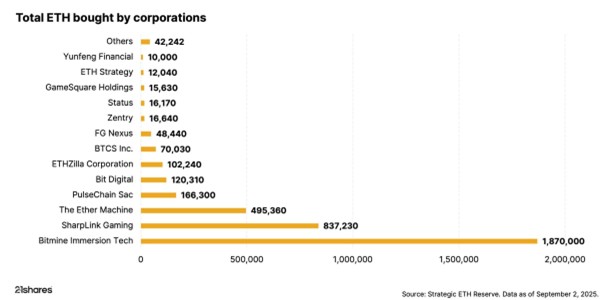
Investors can’t ignore the corporate world’s big bet on Ethereum
Ethereum is stealing the spotlight, as public companies have accumulated over 4.4 million ETH, worth nearly $19 billion, in the past few months. This treasury boom is outpacing Bitcoin’s early adoption and redefining how Wall Street approaches digital assets.


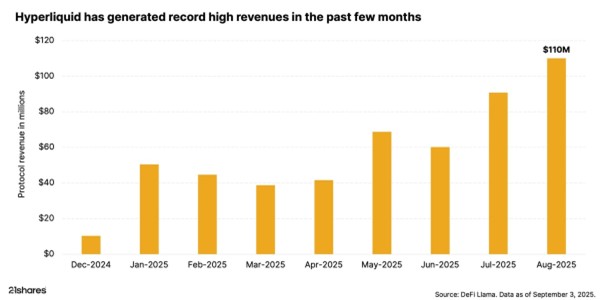
The rise of Hyperliquid: DeFi’s record-breaking powerhouse
Hyperliquid is making waves in DeFi perpetuals by setting new records, leading trading volumes, and propelling its token to all-time highs. Backed by market volatility, high-performance infrastructure, and concentrated liquidity, the platform continues to draw investors and assert its market dominance.

Research Newsletter
Each week the 21Shares Research team will publish our data-driven insights into the crypto asset world through this newsletter. Please direct any comments, questions, and words of feedback to research@21shares.com
Disclaimer
The information provided does not constitute a prospectus or other offering material and does not contain or constitute an offer to sell or a solicitation of any offer to buy securities in any jurisdiction. Some of the information published herein may contain forward-looking statements. Readers are cautioned that any such forward-looking statements are not guarantees of future performance and involve risks and uncertainties and that actual results may differ materially from those in the forward-looking statements as a result of various factors. The information contained herein may not be considered as economic, legal, tax or other advice and users are cautioned to base investment decisions or other decisions solely on the content hereof.

IncomeShares passed three milestones in August. Assets under management climbed to almost $66 million, cumulative fund flows topped $72 million, and turnover across London and Xetra listings reached over $27 million. Palantir paid the highest annualised distribution yield at 57.11%. The sections below break the numbers down in more detail.
Cumulative fund flows
Fund flows track how much money investors put into or take out of IncomeShares ETPs (exchange-traded products). Positive flows mean more money coming in than going out – a sign of demand for the products.
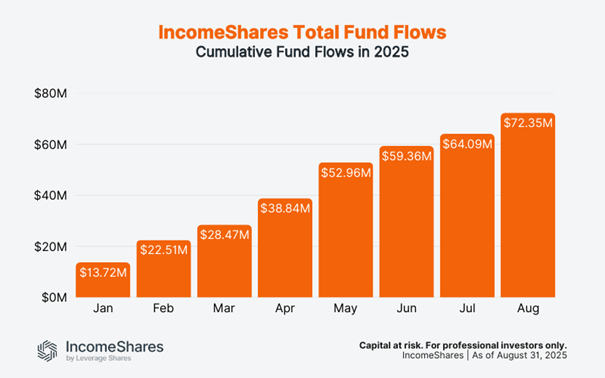
Flows have risen every month this year. In January, they stood at $13.7 million. By the end of August, they reached $72.4 million. That’s over $8 million of new money added in August alone – the biggest increase since May.
Trading turnover
Turnover is the total dollar value of IncomeShares ETPs bought and sold on the exchanges. Higher turnover means more activity and liquidity for investors.
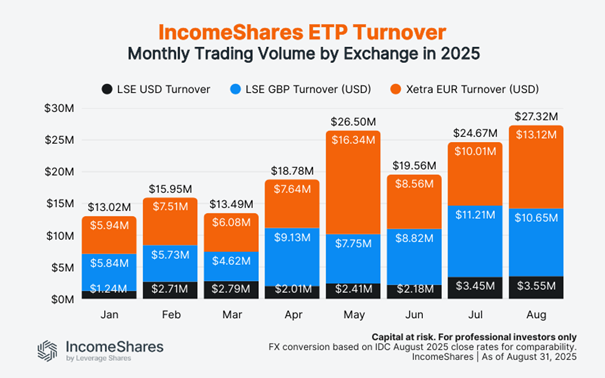
Turnover reached $27.3 million in August – the highest on record and more than double January’s $13.0 million. London listings (USD and GBP combined) made up $14.2 million, with Xetra listings close behind at $13.1 million. Both exchanges have seen steady increases through 2025, showing rising interest in income options strategies across the board.
Note: Figures use IDC FX rates as of the August month-end to convert GBP and EUR into USD. We apply the same August rates to all prior months to compare turnover on a like-for-like basis.
Assets under management (AUM)
AUM is the total value of assets held across all IncomeShares ETPs. It grows when new investors buy in, or when the underlying assets rise in value.
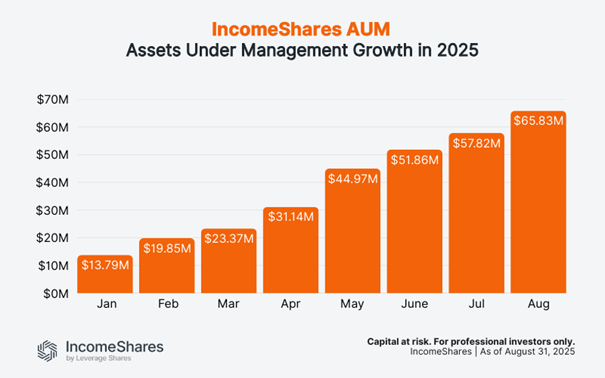
AUM grew from $13.8 million in January to $65.8 million at the end of August. It was also $8 million more than in July. Steady inflows and consistent income distributions are helping the product range build scale.
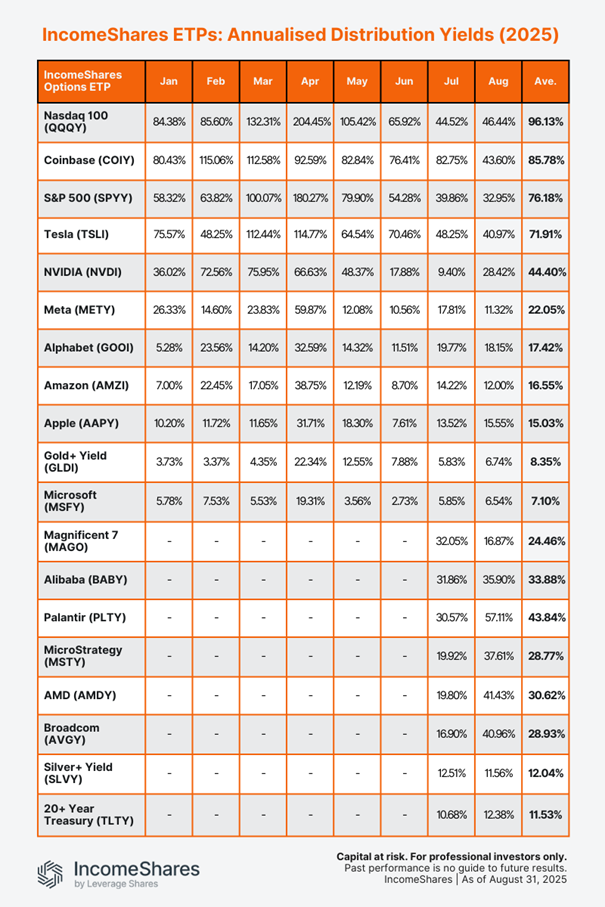
Distribution yields
Distribution yields represent the annualised income paid to investors as a percentage of the current NAV (net asset value), based on the latest month’s yield. IncomeShares ETPs aim to generate this income from selling options. Yields change each month depending on strategy performance and market volatility.
Annualised August yields (ranked highest to lowest):
• Palantir Options ETP (PLTY): 57.11%
• Nasdaq 100 Options ETP (QQQY): 46.44%
• Coinbase Options ETP (COIY): 43.60%
• AMD Options ETP (AMDY): 41.43%
• Tesla Options ETP (TSLI): 40.97%
• Broadcom Options ETP (AVGY): 40.96%
• MicroStrategy Options ETP (MSTY): 37.61%
• Alibaba Options ETP (BABY): 35.90%
• S&P 500 Options ETP (SPYY): 32.95%
• NVIDIA Options ETP (NVDI): 28.42%
• Alphabet Options ETP (GOOI): 18.15%
• Magnificent 7 Options ETP (MAGO): 16.87%
• Apple Options ETP (AAPPY): 15.55%
• 20+ Year Treasury Options ETP (TLTY): 12.38%
• Amazon Options ETP (AMZI): 12.00%
• Silver+ Yield Options ETP (SLVY): 11.56%
• Meta Options ETP (METY): 11.32%
• Gold+ Yield Options ETP (GLDI): 6.74%
• Microsoft Options ETP (MSFY): 6.54%
Our Palantir ETP topped the list with an annualised yield of 57.11% for August, up from 30.57% in July. The stock was volatile in August, trading between $142 and $190. That wider range increased option premiums, which boosted the ETP’s yield. The ETP sells put options on Palantir stock and holds shares – the strategy used for all our single stock ETPs and the Magnificent 7 product.
The Nasdaq 100 ETP paid an annualised yield of 46.44% in August, up slightly from 44.52% in July. At the other end, Gold+ and Microsoft stayed below 7%, reflecting relatively calmer conditions in their underlying assets.
The table below shows the annalised distribution yields for all IncomeShares ETPs so far this year. Note that the bottom eight ETPs launched in late June, so they only have yields for July and August.
Key takeaways
• Fund flows climbed to $72.4 million, with August adding more than $8 million.
• Turnover hit a record $27.3 million, split almost evenly between London and Xetra.
• Palantir topped the yield table at 57%, with Nasdaq 100 and Coinbase also paying above 40%.

Concerned about rising government debt? Bitcoin’s got you covered

N100 ETF följer det amerikanska Nasdaq 100 indexet

IncomeShares Monthly Investor Update – August 2025

CHSJ ETF investerar i CLO-obligationer

HYPE ETP ger exponering mot Hyperliquid

VALOUR ARB SEK spårar priset på kryptovalutan Arbitrum

Månadsutdelande ETFer uppdaterad med IncomeShares produkter

Utdelningar och försvarsfonder lockade i augusti

HANetfs analyserar hur ett fredsavtal kan påverka det europeiska försvaret

De bästa innovations-ETFerna
-
 Nyheter4 veckor sedan
VALOUR ARB SEK spårar priset på kryptovalutan Arbitrum
-
 Nyheter2 veckor sedan
Månadsutdelande ETFer uppdaterad med IncomeShares produkter
-
 Nyheter1 vecka sedan
Utdelningar och försvarsfonder lockade i augusti
-
 Nyheter2 veckor sedan
HANetfs analyserar hur ett fredsavtal kan påverka det europeiska försvaret
-
 Nyheter4 veckor sedan
De bästa innovations-ETFerna
-

 Nyheter3 veckor sedan
HANetfs VD kommenterar Trump-Putin-toppmötet
-

 Nyheter2 veckor sedan
ADLT ETF investerar bara i riktigt långa amerikanska statsobligationer
-
 Nyheter4 veckor sedan
IncomeShares når 60 miljoner dollar i förvaltat kapital – Tillväxtöversikt 2025