
Nyheter
Explore multifactor investing for the rotation toward mid and small caps

Market momentum has been shifting recently with a rotation away from large-cap stocks. As more investors look to broaden their exposures, Franklin Templeton’s Dina Ting weighs in with a few considerations for diversification through multifactor ETFs.
In retrospect (and barring any impact from airline outages and the like), the first weekend of August would have been an excellent time for a vacation. Hopefully, you had a few screen-free days focused on a good beach book and spared yourself the anxiety of some wild market swings.
During this time of global market turmoil, Japan’s stock indexes experienced heightened volatility. A surge in the yen—that gave pause over the prospects of Japanese exporters—followed worrisome new US economic data and exacerbated fears. Over just two trading sessions, Japan’s benchmark Nikkei 225 Index dropped 12.4% on Monday, August 5, 2024, before rebounding over 10% the next day.1
Even investors who were blissfully unaware of the selloff drama in real time were probably still experiencing some creeping concerns over portfolio concentration to US technology giants. Judging by Wall Street’s elevated “fear gauge,” the VIX index, you’re in good company if this summer has tested your faith in the Magnificent Seven3 tech darlings.
But before any more panic sets in, consider a few points we’re thinking about this month. Namely, focusing on long-term investment strategy means ignoring the “bobs up and down,” as Warren Buffet puts it. US unemployment is still rather low at 4.3%4 and given that economic activity in the services sector expanded in July,5 we believe an imminent recessionary environment appears unlikely.
Historically, during cooling economic cycles, investors typically favor blue chips, but July’s moderating inflation data boosted sentiment for mid- and small-capitalization stocks. Both the Russell 2000 Index, which rose 10.2%, and the Russell Midcap Index, up 4.7%, outperformed the S&P 500 Index’s 1.2% gain for July.6
Overlooked mid- and small-cap segments
The market rotation away from mega-cap stocks has fueled attention to the often-overlooked, mid-cap segment and led to a preference for interest-rate-sensitive, small-cap stocks following indications from the US Federal Reserve (Fed) over lower borrowing costs to come, possibly in September.
Despite the attractive risk/reward profile of mid caps, which feature more established customer bases and brands than their smaller-cap peers, investors tend to be under-allocated to the segment. To put this in perspective, investments in large-cap mutual funds and exchange-traded funds (ETFs) are about nine times greater than those in mid-cap mutual funds and ETFs.7 US mid-cap stocks (as measured by the S&P MidCap 400 Index) have outperformed their large-cap (as measured by the S&P 500 Index) and small-cap (as measured by the S&P Small Cap 600 Index) counterparts over the past three decades.8 In our analysis, many mid-sized companies hit the so-called “sweet spot” in that they feature a lower risk profile than small caps and faster growth prospects than large caps.
Exposure to mid-caps indexes also offer the added benefit of diversification. At the end of July, technology sector holdings comprised 29% of the Russell 1000 Index compared to just 13% in the Russell Midcap Index.9 And while utility companies were the best performers (+18% total returns) for the mid-cap index, they held the smallest sector weighting within large-cap benchmarks.
Beyond the market-cap criteria, we believe that multifactor strategies can target allocation and pursue stronger risk-adjusted returns for a smoother ride over the long term compared to traditional market-cap-based indexing. In our view, a forward-looking, rules-based index design that analyzes individual stock exposure against a well-vetted mix of factors—quality, value, momentum and low volatility—can serve as a middle ground between active and passive management. The process may provide exposure to high-quality companies at a reasonable price, while also potentially avoiding value traps.
As shown in the table below, quality-tilted and momentum stocks, which tend to show ongoing positive price trends, performed better than the broader market last year. The S&P MidCap 400 Quality Index and the S&P MidCap 400 Momentum Index, returned nearly 30% and 20.3%, respectively, for the year against the 16.4% gain for the overall S&P MidCap 400 Index.10 By comparison, the low volatility factor underperformed the most in 2023.
Exhibit 1: Differentiated Sources of Returns
One-Year Absolute Return by Factors
December 31, 2023
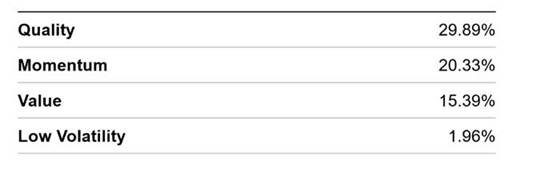
Source: Morningstar as of 12/31/2023.
The case for small caps
July’s broadened stock rally brings into view the market’s small-cap segment. That same month, the Russell 2000 Index of smaller stocks saw its largest outperformance over mega caps in decades, returning more than 10%, while the Nasdaq-100 Index lost 1.6%.11
Currently, at 15.1x forward earnings, the small-cap benchmark is trading at a discount to both its long-term average and the S&P 500’s forward price-earnings ratio of 20.4x.12 We believe that a multifactor approach to small caps, which we consider to be an attractive asset class, should be represented in diversified portfolios.
Stocks with value traits—which emphasize holdings that are inexpensive relative to their fundamentals—have underperformed in recent months and year-to-date through August 8, 2024, not only within the small-cap but also for the mid-cap segment. But zoom out further and we see that the Russell 2000 Value Index has outperformed the Russell 2000 Growth Index over the past 25 years by 1.82% on an annualized basis.13 In our opinion, anchoring quality-tilted stocks, marked by profitable companies with capital efficiency and momentum, together with value and low-volatility factors can hedge against risks.
Year-to-date through August 8, 2024, consumer staples holdings were the top performers for the small-cap index, with such specialty food companies as Vital Farms, Sprouts Farmers and Natural Grocers by Vitamin Cottage leading the way.14 Consumer staples tends to be a safe-haven sector that can outperform during times of uncertainty, such as amid periods of political uncertainty.
Being earlier in their business life cycle, small caps are generally seen to have strong growth prospects, and the segment has appealed to investors this year as a timely investment given anticipated rate cuts. Since smaller companies generally have more borrowing needs, they tend to get a boost when monetary policy eases.
Exhibit 2: Small-Cap Performance After Fed Rate Cuts
Russell 2000 Index Performance After Fed Rate Cuts
June 2001–June 2020
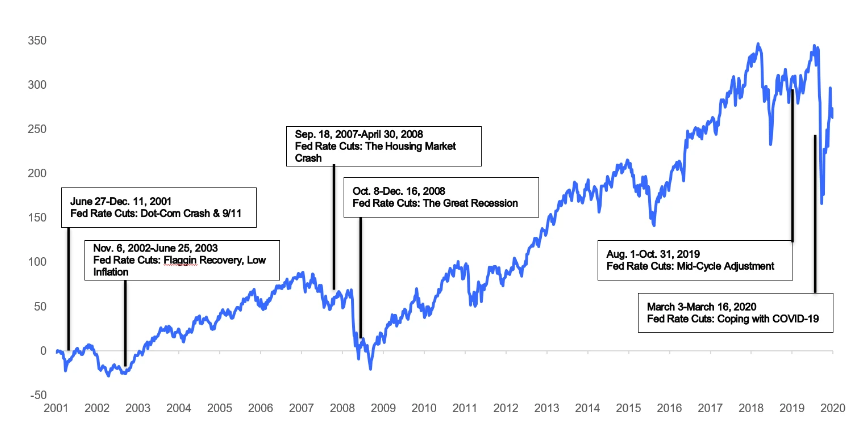
Sources: Bloomberg, Federal Reserve Bank of St. Louis.
We believe that factor diversification can allow for a targeted outcome with a smoother risk/return profile versus market capitalization-based indexes. In addition, holding a multifactor portfolio can also provide the advantage of not attempting to time factor cycles, nor incur costs associated with switching from one product to another. A multifactor methodology allows investors to outsource that task—so your summer beach time can be better spent.


JCPN ETF investerar i japanska ESG-aktier

USBG ETF företagsobligationer från hela världen hedgade i dollar

De bästa börshandlade fonderna för FTSE 100

VIRNEAR ETP spårar kryptovalutan NEAR
Fem nya ETFer från iShares på Xetra

Månadsutdelande ETFer uppdaterad med två börshandlade fonder från AXA

ETFer som ger exponering mot börsintroduktioner
Bitcoin likes to dance to its own beat, not to tech stock tunes

HANetfs VD kommenterar Trump-Putin-toppmötet

BJLX ETF hållbara företagsobligationer med förfall 2032
-
 Nyheter4 veckor sedan
Månadsutdelande ETFer uppdaterad med två börshandlade fonder från AXA
-
 Nyheter4 veckor sedan
ETFer som ger exponering mot börsintroduktioner
-

 Nyheter4 veckor sedan
Bitcoin likes to dance to its own beat, not to tech stock tunes
-
 Nyheter2 veckor sedan
HANetfs VD kommenterar Trump-Putin-toppmötet
-
 Nyheter4 veckor sedan
BJLX ETF hållbara företagsobligationer med förfall 2032
-
 Nyheter4 veckor sedan
IncomeShares strategiuppdatering: Kontantsäkrad säljoptioner plus aktie
-

 Nyheter1 vecka sedan
HANetfs analyserar hur ett fredsavtal kan påverka det europeiska försvaret
-

 Nyheter3 veckor sedan
VALOUR ARB SEK spårar priset på kryptovalutan Arbitrum