Följ oss

Nyheter

Energy equities starting to look interesting

Publicerad

den

Equity Research Energy equities starting to look interesting The Energy sector’s performance has lagged the recovery in oil prices.

Equity Research Energy equities starting to look interesting

  • The Energy sector’s performance has lagged the recovery in oil prices.
  • Energy sector valuations have already priced in a more bearish outlook for oil despite some supports in the near-term.
  • On consensus forecasts, Energy now has the highest dividend yield of any cyclical sector, and the highest EPS growth over the next three years.
  • Energy balance sheets are now much healthier limiting credit risks from a lower-for-longer oil price scenario.

Energy equities have lagged the recovery in oil prices

While oil prices corrected 13% in March and have since risen 8% to nearly their pre-correction levels, the interesting thing is that oil-related equities have lagged and have risen only 2% versus global equities.

(click to enlarge chart)

Some near-term supports for the oil price

We are not bullish on the oil price – we continue to see it range bound in the medium-term. Compliance issues among OPEC are likely to cap the upside, while US shale production could exert downside pressures. Nevertheless, there are some counter-balancing supports in the near-term:

First, Oil positioning looks more balanced now. Since we pointed out that speculative long positions in oil were at an extreme at the end of February, they have since come down and look more balanced, removing some downside risk for further forced selling.

(click to enlarge chart)

Second, we are entering a seasonally favourable time of the year for oil prices – on average over the last 10 years, the oil price has tended to rise from March to August. The closure of refiners for maintenance during this period and the start of the ‘driving season’ in the US tend to be the main supports.

(click to enlarge chart)

Third, global demand conditions continue to look robust even in the face of rising supply risks from shale and OPEC producers.

(click to enlarge chart)

Energy sector valuations have already priced in a more bearish outlook for oil

Based on a range of valuation metrics, energy equities have already priced in a lower-for-longer outlook for oil. The Price-to-Book and Dividend Yield ratios relative to the wider market are both trading one standard deviation cheap to their long-term average. The Energy sector has the highest forecasted dividend yield (3.6%) among cyclical sectors and higher than the overall market (2.6%).

(click to enlarge chart)

Valuations compared to other reflationary beneficiaries such as Materials and Industrials are close to an all-time extreme. The MSCI World Energy sector is trading on a 20% discount to the Materials sector and 40% to Industrials on Price-to-Book. Energy should benefit if the rotation in value / reflationary beneficiaries continues.
The sector looks less attractive on P/E as earnings are still recovering. However, on a 3-year outlook, the Energy Sector is forecasted have the strongest EPS growth of any sector on consensus projections.

(click to enlarge chart)

Energy Sector balance sheets healthier now

What is worthy to note is that the Energy sector credit risk is much lower than 3 years ago: the recent dip in oil prices has not caused high yield energy spreads to blow out because global oil companies have been through a period of unprecedented cost and capex cuts. According to IHS Markit, upstream capital expenditure and operational costs in North America have fallen by 50% in 2015 and 35% in 2016, their fastest rate for the last 30 years. This has helped the sector’s projected FCF yield to move back into positive territory for the first time in three years and should help solidify companies’ dividend pay-out policies going forward.

(click to enlarge chart)

What are the risks?

One of the biggest risks to oil prices in the medium-term is deteriorating compliance among OPEC members. The cartel is only 83% of the way to cutting the 1.2mn barrels proposed last year. Extending the deal could be difficult given that non-OPEC countries are doing far worse on compliance. We should get an update at the next OPEC meeting on 25th May.

For more information contact:

ETF Securities Research team
ETF Securities (UK) Limited
T +44 (0) 207 448 4336
E info@etfsecurities.com

Important Information

This communication has been issued and approved for the purpose of section 21 of the Financial Services and Markets Act 2000 by ETF Securities (UK) Limited (“ETFS UK”) which is authorised and regulated by the United Kingdom Financial Conduct Authority (the “FCA”).

Fortsätt läsa
Annons
Klicka för att kommentera

Skriv en kommentar

Din e-postadress kommer inte publiceras. Obligatoriska fält är märkta *

Nyheter

XTMT ETF ger exponering mot aktier från Taiwan

Publicerad

den

Xtrackers MSCI Taiwan UCITS ETF 1D Distribution (XTMT ETF) med ISIN LU2928641757, försöker spåra MSCI Taiwan 20/35 Custom-indexet. MSCI Taiwan 20/35 Custom-indexet spårar stora och medelstora företag från Taiwan. Vikten av den största beståndsdelen är begränsad till 35 % och vikten av alla andra beståndsdelar är begränsad till maximalt 20 %. En buffert på 10 % tillämpas på dessa limiter vid varje indexombalansering.

Xtrackers MSCI Taiwan UCITS ETF 1D Distribution (XTMT ETF) med ISIN LU2928641757, försöker spåra MSCI Taiwan 20/35 Custom-indexet. MSCI Taiwan 20/35 Custom-indexet spårar stora och medelstora företag från Taiwan. Vikten av den största beståndsdelen är begränsad till 35 % och vikten av alla andra beståndsdelar är begränsad till maximalt 20 %. En buffert på 10 % tillämpas på dessa limiter vid varje indexombalansering.

Den börshandlade fondens TER (total cost ratio) uppgår till 0,29 % p.a. Xtrackers MSCI Taiwan UCITS ETF 1D Distribution är den billigaste ETF som följer MSCI Taiwan 20/35 Custom-indexet. ETFen replikerar det underliggande indexets prestanda genom full replikering (köper alla indexbeståndsdelar). Utdelningarna i ETFen delas ut till investerarna (Minst årligen).

Denna ETF lanserades den 4 december 2024 och har sin hemvist i Luxemburg.

Handla XTMT

Xtrackers MSCI Taiwan UCITS ETF 1D Distribution (XTMT ETF) är en europeisk börshandlad fond. Denna fond handlas på flera olika börser, till exempel Deutsche Boerse Xetra och London Stock Exchange.

Det betyder att det går att handla andelar i denna ETF genom de flesta svenska banker och Internetmäklare, till exempel DEGIRONordnet, Aktieinvest och Avanza.

Börsnoteringar

BörsValutaKortnamn
XETRAEURXTMT
London Stock ExchangeUSDXTMT

Största innehav

ISINNamnVikt%Land
TW0002330008TAIWAN SEMICONDUCTOR MANUFACTURING32,92%Taiwan
TW0002317005HON HAI PRECISION INDUSTRY LTD6,74%Taiwan
TW0002454006MEDIATEK INC6,43%Taiwan
TW0002308004DELTA ELECTRONICS INC2,39%Taiwan
TW0002382009QUANTA COMPUTER INC2,29%Taiwan
TW0002881000FUBON FINANCIAL HOLDING LTD2,15%Taiwan
TW0002882008CATHAY FINANCIAL HOLDING LTD1,89%Taiwan
TW0002891009CTBC FINANCIAL HOLDING LTD1,88%Taiwan
TW0003711008ASE TECHNOLOGY HOLDING LTD1,63%Taiwan
TW0002303005UNITED MICRO ELECTRONICS CORP1,38%Taiwan
TW0002412004CHUNGHWA TELECOM LTD1,35%Taiwan
TW0002886009MEGA FINANCIAL HOLDING LTD1,32%Taiwan
TW0002357001ASUSTEK COMPUTER INC1,31%Taiwan
TW0002884004E.SUN FINANCIAL HOLDING LTD1,13%Taiwan
TW0002345006ACCTON TECHNOLOGY CORP1,12%Taiwan

Innehav kan komma att förändras

Fortsätt läsa

Nyheter

Handla WisdomTrees ETFer utan courtage hos SAVR

Publicerad

den

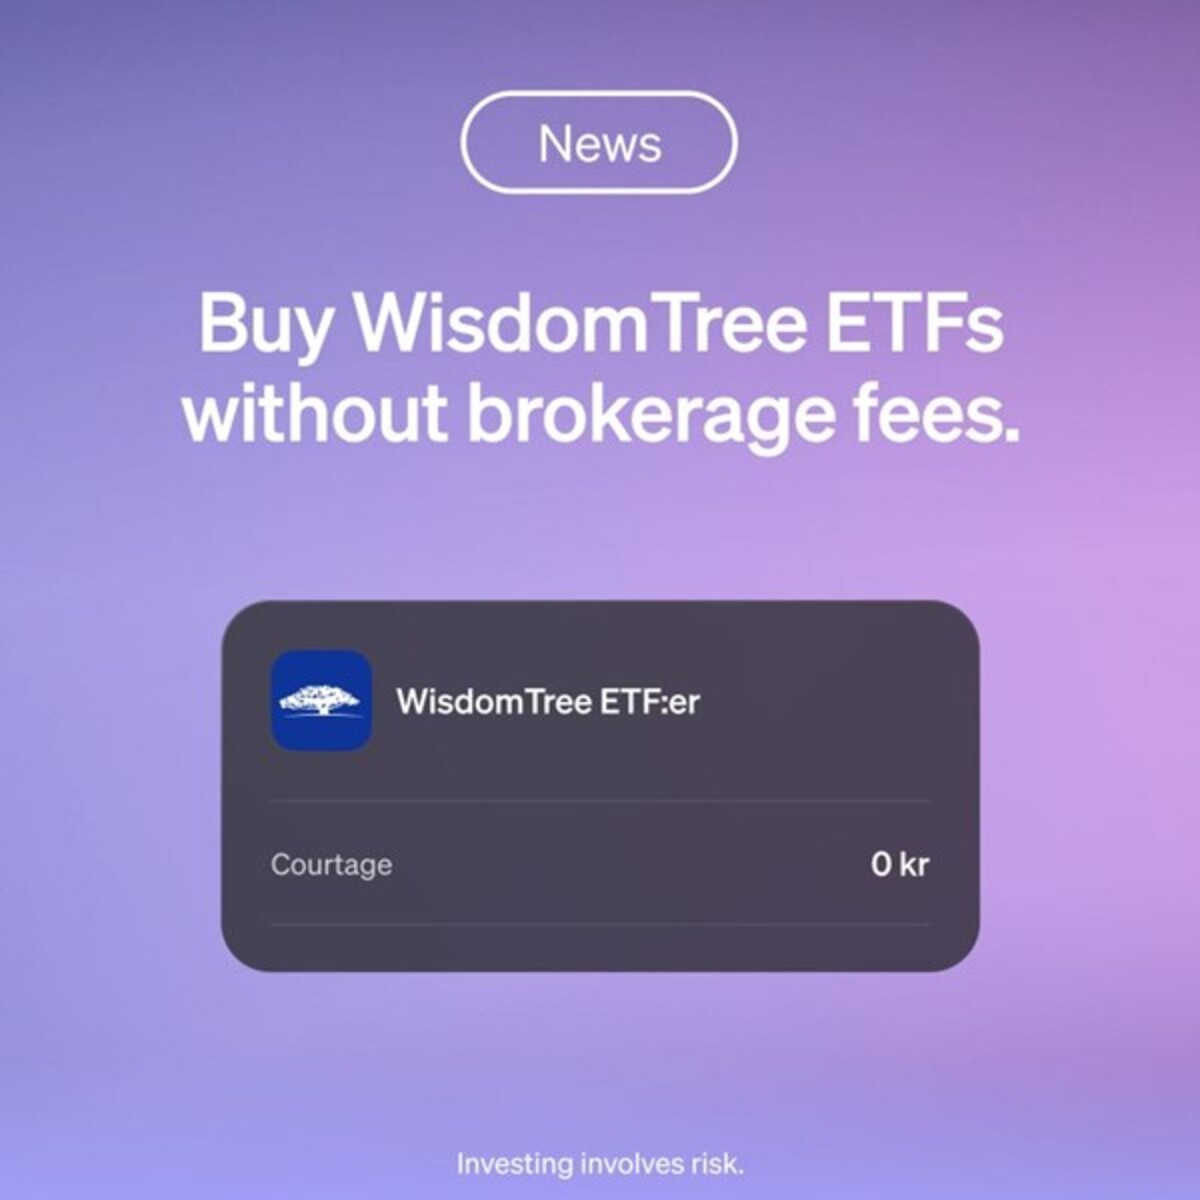
SAVR har tagit nästa steg mot att skapa Sveriges bästa ETF-erbjudande genom att ingå ett partnerskap med WisdomTree. Du kan nu handla WisdomTrees ETFer utan courtage hos SAVR.

SAVR har tagit nästa steg mot att skapa Sveriges bästa ETF-erbjudande genom att ingå ett partnerskap med WisdomTree. Du kan nu handla WisdomTrees ETFer utan courtage hos SAVR.

Du kan nu köpa över 50 WisdomTree ETF:er utan courtageSAVR. WisdomTree specialiserar sig på att erbjuda ETFer för investeringar i aktuella trender. De fem mest populära WisdomTree ETFerna bland SAVRs kunder är:

🟣 WisdomTree Europe Defence (EUDF)

🟣 WisdomTree Cybersecurity (W1TB)

🟣 WisdomTree Uranium and Nuclear Energy (WNUC)

🟣 WisdomTree Europe Equity Income (WTEE)

🟣 WisdomTree Artificial Intelligence (WTI2)

Logga in på ditt SAVR-konto för att se alla WisdomTree ETF:er eller utforska hela SAVRs utbud av instrument.

Fortsätt läsa

Nyheter

XDPU ETF – Levler S&P 500 by Xtrackers

Publicerad

den

Levler S&P 500 by Xtrackers (XDPU ETF) med ISIN IE000Z9SJA06, syftar till att följa S&P 500®-indexet. S&P 500®-indexet följer de 500 största amerikanska aktierna.

Levler S&P 500 by Xtrackers (XDPU ETF) med ISIN IE000Z9SJA06, syftar till att följa S&P 500®-indexet. S&P 500®-indexet följer de 500 största amerikanska aktierna.

Den börshandlade fondens totala kostnadskvot (TER) uppgår till 0,05 % per år. ETFen replikerar det underliggande indexets utveckling genom fullständig replikering (genom att köpa alla indexkomponenter). Utdelningarna i ETFen ackumuleras och återinvesteras.

Levler S&P 500 by Xtrackers har 342 miljoner euro i förvaltningstillgångar. Denna ETF lanserades den 8 juni 2022 och har sitt säte i Irland.

Indexets viktigaste funktioner

S&P 500 Net Dividends Reinvested Index (netto USD) syftar till att återspegla utvecklingen på följande marknad:

  • De 500 största företagen noterade i USA
  • Täcker cirka 80 % av det fritt flytande börsvärdet
  • Viktat med justerat börsvärde för fritt flytande aktier
  • Granskas kvartalsvis

Beskrivning

Levler S&P 500 by Xtrackers följer utvecklingen av de 500 största börsnoterade bolagen i USA, vilket gör det till ett av världens mest använda aktieindex. Det täcker ungefär 80 % av det totala börsvärdet på den amerikanska marknaden och ger därmed en bred exponering mot den amerikanska ekonomin. Bolagen viktas efter hur mycket av deras aktier som faktiskt finns tillgängliga för handel, vilket gör att de största företagen får störst betydelse för indexets utveckling. För att säkerställa att det är aktuellt granskas indexet och uppdateras varje kvartal. Utdelningar återinvesteras i fonden.

Handla XDPU ETF

Levler S&P 500 by Xtrackers (XDPU ETF) är en europeisk börshandlad fond som handlas på bland annat Nasdaq Stockholm.

Det betyder att det går att handla andelar i denna ETP genom de flesta svenska banker och Internetmäklare, till exempel  Nordnet, SAVR, Levler, DEGIRO och Avanza.

Denna ETF handlas i svenska kronor på Stockholmsbörsen. Levlers kunder handlar den svenska varianten utan courtage fram till och med i alla fall den 31 december 2026.

Börsnoteringar

BörsValutaKortnamn
Stockholm Stock ExchangeSEKXDPU

Största innehav

ISINVärdepapperVikt %LandSektor
US67066G1040NVIDIA CORP7,708%USAInformations-
teknologi
US5949181045MICROSOFT CORP6,643%USAInformations-
teknologi
US0378331005APPLE INC6,129%USAInformations-
teknologi
US0231351067AMAZON COM INC3,876%USASällanköps-
varor
US11135F1012BROADCOM INC3,016%USAInformations-
teknologi
US30303M1027META PLATFORMS INC CLASS A2,908%USAKommunikations-
tjänster
US02079K3059ALPHABET INC CLASS A2,494%USAKommunikations-
tjänster
US02079K1079ALPHABET INC CLASS C2,017%USAKommunikations-
tjänster
US88160R1014TESLA INC1,844%USASällanköps-
varor
US0846707026BERKSHIRE HATHAWAY INC CLASS B1,625%USAFinans
US46625H1005JPMORGAN CHASE1,515%USAFinans
US5324571083ELI LILLY1,060%USAHealth Care
US92826C8394VISA INC CLASS A1,048%USAFinans
US64110L1061NETFLIX INC0,915%USAKommunikations-
tjänster
US68389X1054ORACLE CORP0,893%USAInformations-
teknologi

Innehav kan komma att förändras

Fortsätt läsa

Prenumerera på nyheter om ETFer

* indicates required

Populära