
Nyheter
De bästa ETFerna 2014

De bästa ETFerna 2014 Haussen fortsatte även under 2014, förstärkt av ekonomiska data och bättre resultat från företagen under hela året. Trots detta såg vi ett antal sättningar i aktiekurserna under året, även om de i allmänhet var ganska korta. Det var framförallt den amerikanska marknaden som steg under året. Se även De sämsta ETFerna 2014.
De breda aktieindexen noterade flera nya rekordnivåer i USA, medan flera europeiska marknaden kämpade för att kunna hålla jämna steg. I allmänhet var det de mer riskfylld marknaderna som noterade utflöden, främst då placerarna ansåg att de inte fick betalt för den risk som en högre volatilitet medförde. Förvånansvärt nog var en av de bästa börshandlade fonderna en som inriktar sig på amerikanska statspapper.
Nedan listar vi 2014 bästa ETer. Observera att denna lista utesluter inverterade- och hävstångsETFer och att mätperioden sträcker sig fram till och med den 23 december.
De bästa börshandlade fonderna 2014

Under 2014 var Global Carbon ETN (GRN) den bästa börshandlade ETNen, mätt i dollar. GRN gav sina innehavare en avkastning på ganska precis 51 procent. Dessutom återfinns flera börshandlade fonder med fokus på Indien på denna lista, varav två med inriktning på det indiska small cap segmentet. Det finns även en konsumentinriktad ETF på listan över 2014 års bästa ETFer. Även biotech och Kina var vinnare under 2014, vi ser flera China A-shares på denna lista.
Utöver aktier hittar vi två stycken ETFer med fokus på amerikanska statspapper, obligationer med längre löptider på listan, 25+ Year Zero Coupon U.S. Treasury Index Fund (ZROZ) och Extended Duration Treasury ETF (EDV). För en svensk placerare har dessa ETFer dessutom gett en värdeökning i form av valutaeffekterna som under året varit positiva då den amerikanska dollarn har stigit mot så gott som alla andra valutor.
Vidare finner vi två stycken ETFer med fokus på råvaror på listan. De är båda inriktade på kaffe, en råvara som stigit kraftigt som en följd av torka i Brasilien, världens största kaffeproducent. Tabellen nedan listar samtliga börshandlade fonder som visas i grafen ovan
De bästa ETFerna 2014
| ETF | Utveckling |
|---|---|
| Global Carbon ETN (GRN) | 50.91% |
| China A-Share Portfolio (CHNA) | 47.61% |
| MSCI India Small Cap Index Fund (SMIN) | 47.08% |
| NYSE Arca Biotechnology Index Fund (FBT) | 43.77% |
| 25+ Year Zero Coupon U.S. Treasury Index Fund (ZROZ) | 43.57% |
| Dow Jones-UBS Coffee ETN (JO) | 43.41% |
| India Small Cap ETF (SCIN) | 42.66% |
| India Consumer ETF (INCO) | 42.32% |
| Pure Beta Coffee ETN (CAFE) | 41.12% |
| Extended Duration Treasury ETF (EDV) | 39.96% |


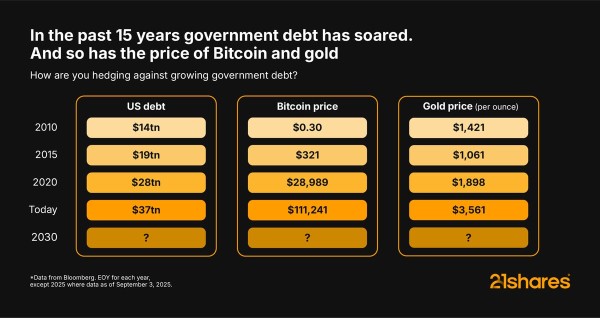
Amid soaring US debt and Gold’s steady gains, Bitcoin has continued to deliver strong returns over the past 15 years. Its scarcity and decentralization make it a hedge that investors can’t ignore, providing new ways to pursue growth, security, and opportunity in an evolving financial landscape.

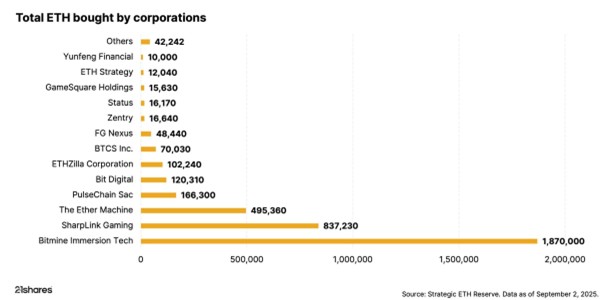
Investors can’t ignore the corporate world’s big bet on Ethereum
Ethereum is stealing the spotlight, as public companies have accumulated over 4.4 million ETH, worth nearly $19 billion, in the past few months. This treasury boom is outpacing Bitcoin’s early adoption and redefining how Wall Street approaches digital assets.


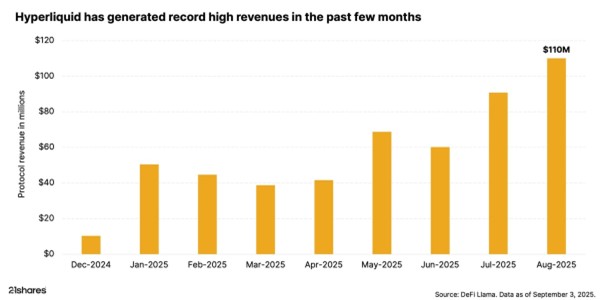
The rise of Hyperliquid: DeFi’s record-breaking powerhouse
Hyperliquid is making waves in DeFi perpetuals by setting new records, leading trading volumes, and propelling its token to all-time highs. Backed by market volatility, high-performance infrastructure, and concentrated liquidity, the platform continues to draw investors and assert its market dominance.

Research Newsletter
Each week the 21Shares Research team will publish our data-driven insights into the crypto asset world through this newsletter. Please direct any comments, questions, and words of feedback to research@21shares.com
Disclaimer
The information provided does not constitute a prospectus or other offering material and does not contain or constitute an offer to sell or a solicitation of any offer to buy securities in any jurisdiction. Some of the information published herein may contain forward-looking statements. Readers are cautioned that any such forward-looking statements are not guarantees of future performance and involve risks and uncertainties and that actual results may differ materially from those in the forward-looking statements as a result of various factors. The information contained herein may not be considered as economic, legal, tax or other advice and users are cautioned to base investment decisions or other decisions solely on the content hereof.

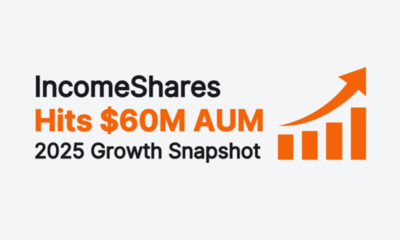
IncomeShares passed three milestones in August. Assets under management climbed to almost $66 million, cumulative fund flows topped $72 million, and turnover across London and Xetra listings reached over $27 million. Palantir paid the highest annualised distribution yield at 57.11%. The sections below break the numbers down in more detail.
Cumulative fund flows
Fund flows track how much money investors put into or take out of IncomeShares ETPs (exchange-traded products). Positive flows mean more money coming in than going out – a sign of demand for the products.
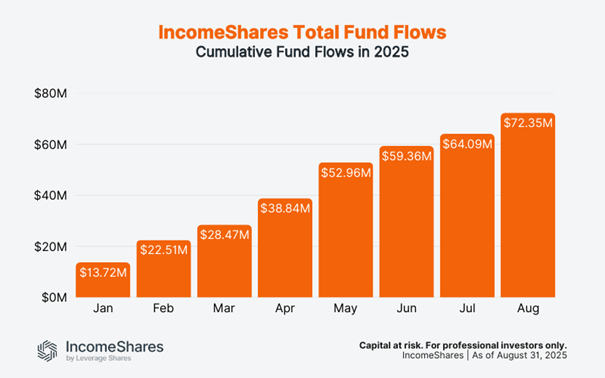
Flows have risen every month this year. In January, they stood at $13.7 million. By the end of August, they reached $72.4 million. That’s over $8 million of new money added in August alone – the biggest increase since May.
Trading turnover
Turnover is the total dollar value of IncomeShares ETPs bought and sold on the exchanges. Higher turnover means more activity and liquidity for investors.
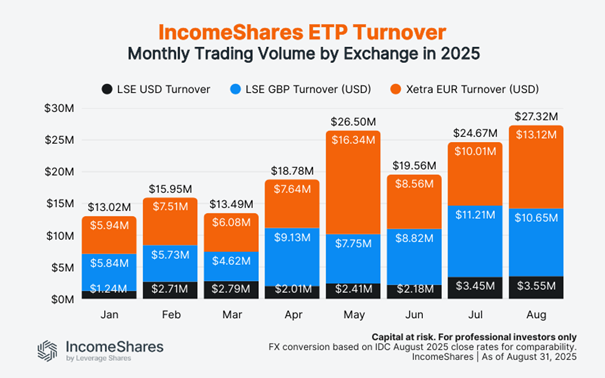
Turnover reached $27.3 million in August – the highest on record and more than double January’s $13.0 million. London listings (USD and GBP combined) made up $14.2 million, with Xetra listings close behind at $13.1 million. Both exchanges have seen steady increases through 2025, showing rising interest in income options strategies across the board.
Note: Figures use IDC FX rates as of the August month-end to convert GBP and EUR into USD. We apply the same August rates to all prior months to compare turnover on a like-for-like basis.
Assets under management (AUM)
AUM is the total value of assets held across all IncomeShares ETPs. It grows when new investors buy in, or when the underlying assets rise in value.
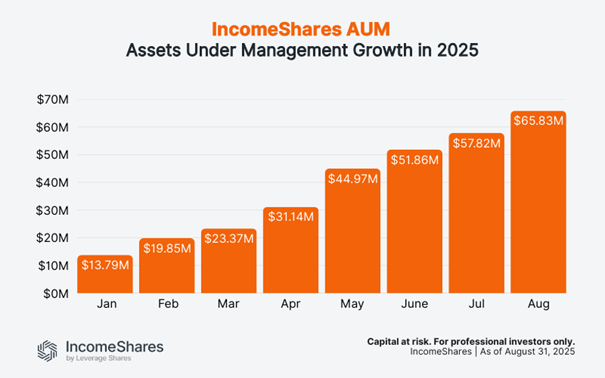
AUM grew from $13.8 million in January to $65.8 million at the end of August. It was also $8 million more than in July. Steady inflows and consistent income distributions are helping the product range build scale.
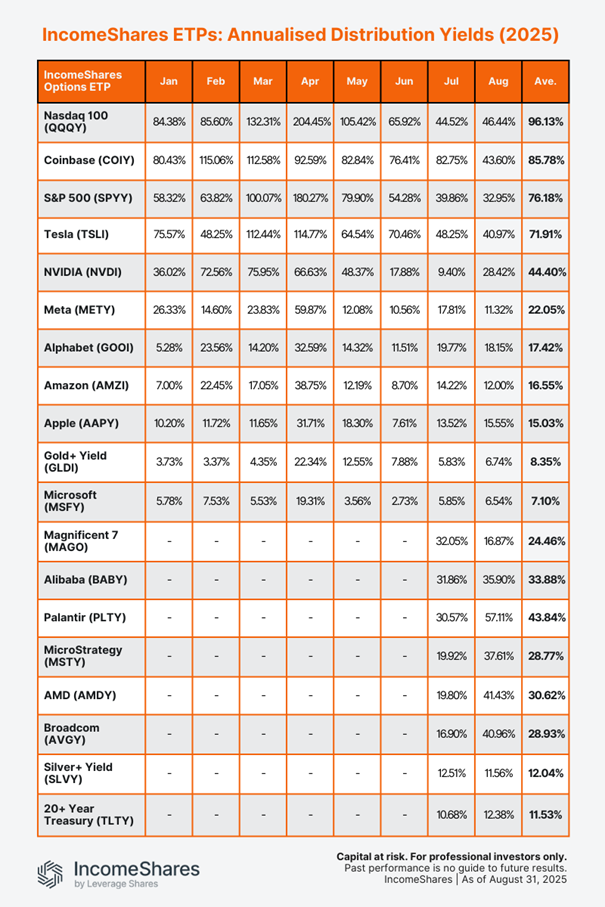
Distribution yields
Distribution yields represent the annualised income paid to investors as a percentage of the current NAV (net asset value), based on the latest month’s yield. IncomeShares ETPs aim to generate this income from selling options. Yields change each month depending on strategy performance and market volatility.
Annualised August yields (ranked highest to lowest):
• Palantir Options ETP (PLTY): 57.11%
• Nasdaq 100 Options ETP (QQQY): 46.44%
• Coinbase Options ETP (COIY): 43.60%
• AMD Options ETP (AMDY): 41.43%
• Tesla Options ETP (TSLI): 40.97%
• Broadcom Options ETP (AVGY): 40.96%
• MicroStrategy Options ETP (MSTY): 37.61%
• Alibaba Options ETP (BABY): 35.90%
• S&P 500 Options ETP (SPYY): 32.95%
• NVIDIA Options ETP (NVDI): 28.42%
• Alphabet Options ETP (GOOI): 18.15%
• Magnificent 7 Options ETP (MAGO): 16.87%
• Apple Options ETP (AAPPY): 15.55%
• 20+ Year Treasury Options ETP (TLTY): 12.38%
• Amazon Options ETP (AMZI): 12.00%
• Silver+ Yield Options ETP (SLVY): 11.56%
• Meta Options ETP (METY): 11.32%
• Gold+ Yield Options ETP (GLDI): 6.74%
• Microsoft Options ETP (MSFY): 6.54%
Our Palantir ETP topped the list with an annualised yield of 57.11% for August, up from 30.57% in July. The stock was volatile in August, trading between $142 and $190. That wider range increased option premiums, which boosted the ETP’s yield. The ETP sells put options on Palantir stock and holds shares – the strategy used for all our single stock ETPs and the Magnificent 7 product.
The Nasdaq 100 ETP paid an annualised yield of 46.44% in August, up slightly from 44.52% in July. At the other end, Gold+ and Microsoft stayed below 7%, reflecting relatively calmer conditions in their underlying assets.
The table below shows the annalised distribution yields for all IncomeShares ETPs so far this year. Note that the bottom eight ETPs launched in late June, so they only have yields for July and August.
Key takeaways
• Fund flows climbed to $72.4 million, with August adding more than $8 million.
• Turnover hit a record $27.3 million, split almost evenly between London and Xetra.
• Palantir topped the yield table at 57%, with Nasdaq 100 and Coinbase also paying above 40%.

Concerned about rising government debt? Bitcoin’s got you covered

N100 ETF följer det amerikanska Nasdaq 100 indexet

IncomeShares Monthly Investor Update – August 2025

CHSJ ETF investerar i CLO-obligationer

HYPE ETP ger exponering mot Hyperliquid

VALOUR ARB SEK spårar priset på kryptovalutan Arbitrum

Månadsutdelande ETFer uppdaterad med IncomeShares produkter

Utdelningar och försvarsfonder lockade i augusti

HANetfs analyserar hur ett fredsavtal kan påverka det europeiska försvaret

De bästa innovations-ETFerna
-
 Nyheter4 veckor sedan
VALOUR ARB SEK spårar priset på kryptovalutan Arbitrum
-
 Nyheter2 veckor sedan
Månadsutdelande ETFer uppdaterad med IncomeShares produkter
-
 Nyheter1 vecka sedan
Utdelningar och försvarsfonder lockade i augusti
-
 Nyheter2 veckor sedan
HANetfs analyserar hur ett fredsavtal kan påverka det europeiska försvaret
-
 Nyheter4 veckor sedan
De bästa innovations-ETFerna
-

 Nyheter3 veckor sedan
HANetfs VD kommenterar Trump-Putin-toppmötet
-

 Nyheter2 veckor sedan
ADLT ETF investerar bara i riktigt långa amerikanska statsobligationer
-
 Nyheter4 veckor sedan
IncomeShares når 60 miljoner dollar i förvaltat kapital – Tillväxtöversikt 2025