
Nyheter
Cryptoassets of the Month: June 2023
Every month, 21Shares research team will present the cryptoassets of the month that increased or dropped in value by more than 15%. With a data-driven approach, we highlight the most important developments and events causing price movements.
Figure 1 – 30-Day Performance: Cryptoassets of the Month vs. Traditional Asset Classes
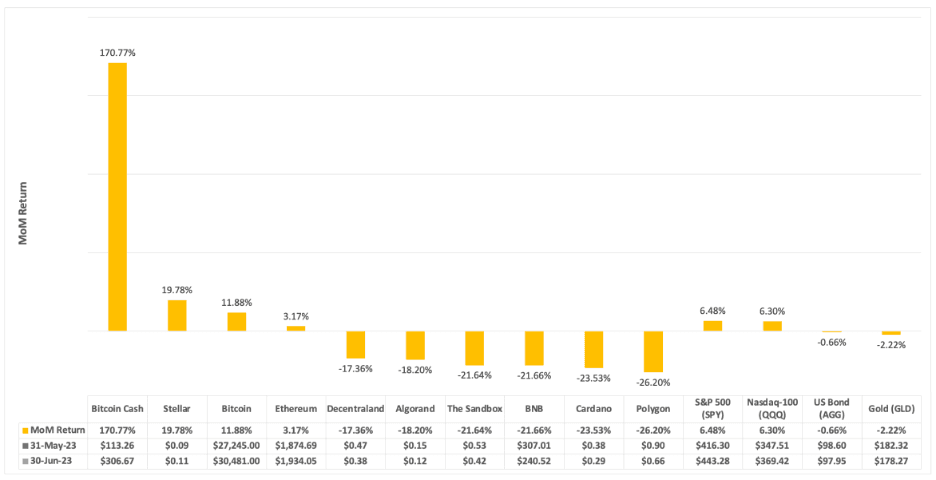
Source: 21Shares, CoinGecko, and Yahoo Finance, from 31-May-2023 to 30-Jun-2023 (Close Price)
Bitcoin Cash (BCH)
Bitcoin Cash (BCH) traded up 170.77% over the past month, outperforming the broader crypto market. EDX Markets – a novel exchange backed by a consortium of leading financial institutions, including Fidelity, Charles Schwab, and Citadel – launched on June 20, supporting only four cryptoassets: BTC, ETH, LTC, and BCH. Jamil Nazarali, CEO of the exchange, stated that these cryptoassets “are considered safe from the viewpoint of being compliant with the SEC.” Exchange data from CoinGecko also revealed that the BCH surge was partly driven by South Korean traders. On June 30, BCH’s trading volume on UpBit (the largest South Korean exchange) amounted to ~$558 million, more than five times BCH’s volume on Coinbase.
Stellar (XLM)
Stellar’s native token XLM traded up 19.78% over the past month. On June 23, Coinbase integrated USDC on the Stellar network. Thanks to its partnership with MoneyGram and Coinme, Stellar offers fiat cash on and off-ramps in over 180 countries. This integration marks another milestone in Stellar’s global mission of expanding access to USDC. On a related note, Circle was named among TIME 100 Most Influential Companies 2023 in the ”Leaders” category in recognition of the work done with Stellar Aid Assist, an aid disbursement system leveraging the Stellar blockchain used by the UNHCR to deliver cash assistance to internally displaced persons in Ukraine.
Bitcoin (BTC)
Bitcoin traded up 11.88% over the past month as its institutional acceptance became more apparent than ever. Blackrock – the world’s largest asset manager – officially filed for a spot Bitcoin ETF in the U.S. on June 15, prompting many other financial institutions to follow suit. On another front, The Financial Times revealed that Hong Kong regulators were pressing HSBC and Standard Chartered to take on crypto clients, and on June 26, HSBC gave in, allowing customers to trade BTC and ETH futures-based ETFs listed on Hong Kong’s stock exchange. Finally, MicroStrategy announced that it purchased $347 million worth of BTC during the second quarter, which puts its total holdings at 152,333 BTC, worth ~$4.6 billion at $30,000 per BTC.
Ethereum (ETH)
Ethereum traded up 3.17% over the past month. On June 9, UBS announced that BOCI (an investment banking arm of the Bank of China) successfully issued 200 million Chinese yuan structured notes on the Ethereum network, making it the first Chinese financial institution to issue a tokenized security on a public blockchain. Regarding fundamentals, the Ethereum staking contract surpassed 4 million ETH in net new deposits since the Shanghai upgrade, which shows that enabling withdrawals was one of the most significant de-risking events in Ethereum’s history.
Decentraland (MANA)
Decentraland (MANA) traded down 17.36% over the past month as activity in the decentralized virtual world continued to drop. About 2,210 unique wallet addresses interacted with Decentraland throughout June, down ~19% from May. In other news, Decentraland’s ”Game Jam” began on June 19 and will end on July 10. The competition requires teams to build a scene revolving around the theme ”Lucid Dreams” that must be built using SDK 7 and at least one artificial intelligence (AI) tool. For context, Decentraland’s SDK 7 is a newly released software development kit aiming to make it easier for content creators to build visually powerful scenes while still optimizing for performance.
Algorand (ALGO)
Algorand’s native token ALGO traded down 18.20% over the past month despite exciting ecosystem developments. Algorand upgraded its protocol on June 22, reducing settlement time to roughly 3.3 seconds – a more than 10% increase in speed. The upgrade also includes new developer tools, such as a simulator for smart contracts that allows developers to rigorously test, identify and rectify any issues before deploying new code. On another note, the Algorand Foundation announced a partnership with investment firm DWF Labs focused on supporting the growth of Algorand’s ecosystem. The partnership involves a $50 million ALGO token purchase agreement to provide liquidity into the ecosystem and fund up-and-coming projects.
The Sandbox (SAND)
The Sandbox (SAND) traded down 21.64% despite signs of ecosystem traction. On June 8, The Sandbox announced a partnership with BBC Studios and Reality+ to build immersive virtual experiences. The collaboration will mark BBC Studios’ first entry into the metaverse and allow users to interact with popular brands like Top Gear and Doctor Who. The Sandbox also partnered with Forkast Labs, an infrastructure and media company, to build a metaverse index measuring the performance of NFT assets in the decentralized virtual world. Introducing this index would enable brands on The Sandbox, like Warner Music Group and Gucci, to track market performance in real-time.
Binance Coin (BNB)

BNB traded down 21.66% over the past month amidst a series of events surrounding the Binance crypto exchange. On June 5, the SEC sued Binance, accusing it of running an unregistered broker, exchange, and clearing agency. The lawsuit also identified many tokens as securities, including BNB and BUSD, and accused Binance of a single count of fraud. As a result, the liquidity of Binance US was severely impacted, with spreads on the exchange becoming ~20 times wider than those on Coinbase and Kraken and market depth decreasing by 78% a week after the lawsuit. According to our Dune Analytics dashboards, Binance US and Binance International registered ~$97 million and ~$358 million net outflows in June, respectively.
Cardano (ADA)
Cardano’s native token ADA traded down 23.53% over the past month, underperforming the broader crypto market, as many platforms delisted the token in light of the SEC lawsuits against Binance and Coinbase. On June 9, Robinhood announced it would end support for ADA, MATIC, and SOL, warning users that any asset still on Robinhood after June 27 would be automatically sold and credited to their accounts. U.S.-based platforms Bakkt and Revolut also announced the delisting of the same cryptoassets.
Polygon (MATIC)
Polygon’s native token MATIC traded down 26.20% over the past month. On June 30, Judge Martin Glenn granted bankrupt crypto lender Celsius permission to liquidate non-BTC and non-ETH cryptoassets to prepare a distribution to creditors. A December 2022 filing showed that Celsius owned at least 90 million MATIC (~$60 million) or about 1% of the asset’s circulating supply. Regarding fundamentals, Polygon Labs introduced the vision and architecture for Polygon 2.0, which will consist of four layers designed to operate together: staking (decentralization and security), interop (cross-chain messaging), execution (block sequencing and consensus), and proving (zero-knowledge proofs for all transactions).
Strategies of the Month: June 2023
Every month, our research team will also present the ten best-performing strategies of the month in our product suite. With a data-driven approach, we highlight the most important developments and events causing price movements.
Figure 2: 30-Day Performance: Strategies of the Month vs. Traditional Asset Classes
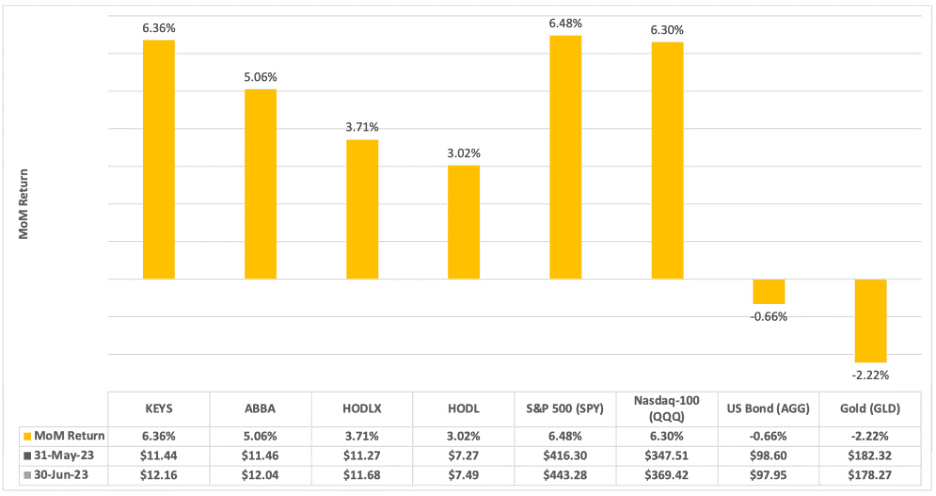
Data Source: 21Shares Index Management Console and Yahoo Finance, from 31-May-2023 to 30-Jun-2023 (Close Price)
KEYS
The 21Shares Bitwise Select 10 Large Cap Crypto ETP (KEYS) rose 6.36% over the past month. KEYS seeks to track the investment results of an index of the top 10 cryptoassets ranked by inflation-adjusted market capitalization. Because Bitcoin and Ethereum’s weights in the index represent about 94%, the index’s performance tends to be highly correlated with both assets, as was the case over this period. In June, the 30-day rolling correlation between BTC and the Nasdaq-100 reached its lowest level since January 2021 (-0.10), a healthy sign of decoupling that shows crypto can be an effective portfolio diversifier.
ABBA
The 21Shares Bitcoin Suisse Index ETP (ABBA) rose 5.06% over the past month. ABBA seeks to track the investment results of an index composed of Bitcoin and Ethereum based on market capitalizations. Investors should understand that Bitcoin and Ethereum serve different use cases and can complement each other in a portfolio. The former is positioned as a non-sovereign form of money, while the latter promises to be the foundational infrastructure for the new iteration of internet services.
HODLX
The 21Shares Crypto Basket 10 ETP (HODLX) traded up 3.71% over the past month. HODLX seeks to track the investment results of an index composed of the top 10 largest cryptoassets based on current market capitalization. The index’s best-performing asset was BTC. Bitcoin dominance, a crucial indicator measuring BTC’s market value as a percentage of crypto’s total market cap, is currently above 50%, the highest figure since May 2021. The ratio suggests a flight to quality and losing interest in alternative cryptoassets, probably until there is more regulatory clarity regarding specific tokens deemed securities by the SEC.
HODL
The 21Shares Crypto Basket Index ETP (HODL) traded up 3.02% over the past month. HODL seeks to track the investment results of an index of the top 5 cryptoassets ranked by the 2050 market capitalization. The 2050 market capitalization is calculated using a projected 2050 supply number and current prices. Bitcoin and Ethereum’s weights are currently around 50% and 33%, while Polkadot is the third-largest constituent with a weight of ~11%. Smart contract platforms like Ethereum and Solana operate in isolation. In contrast, Polkadot works at a level below (interoperability), supporting a growing ecosystem of specialized blockchains called parachains.
Disclaimer
This document is not an offer to sell or a solicitation of an offer to buy or subscribe for securities of 21Shares AG. Neither this document nor anything contained herein shall form the basis of, or be relied upon in connection with, any offer or commitment whatsoever in any jurisdiction. This document and the information contained herein are not for distribution in or into (directly or indirectly) the United States, Canada, Australia or Japan or any other jurisdiction in which the distribution or release would be unlawful.This document does not constitute an offer of securities for sale in or into the United States, Canada, Australia or Japan. The securities of 21Shares AG to which these materials relate have not been and will not be registered under the United States Securities Act of 1933, as amended (the “Securities Act”), and may not be offered or sold in the United States absent registration or an applicable exemption from, or in a transaction not subject to, the registration requirements of the Securities Act. There will not be a public offering of securities in the United States.This document is only being distributed to and is only directed at: (i) to investment professionals falling within Article 19(5) of the Financial Services and Markets Act 2000 (“FSMA”) (Financial Promotion) Order 2005 (the “Order”); or (ii) high net worth entities, and other persons to whom it may lawfully be communicated, falling within Article 49(2)(a) to (d) of the Order (all such persons together being referred to as “relevant persons”); or (iii) any other persons to whom this document can be lawfully distributed in circumstances where section 21(1) of the FSMA does not apply. The securities are only available to, and any invitation, offer or agreement to subscribe, purchase or otherwise acquire such securities will be engaged in only with, relevant persons. Any person who is not a relevant person should not act or rely on this document or any of its contents.In any EEA Member State (other than the Austria, Belgium, Croatia, Denmark, Finland, France, Germany, Great Britain, Hungary, Ireland, Italy, Liechtenstein, Luxembourg, Malta, The Netherlands, Norway, Poland, Romania, Slovakia, Spain and Sweden) that has implemented the Prospectus Regulation (EU) 2017/1129, together with any applicable implementing measures in any Member State, the “Prospectus Regulation”) this communication is only addressed to and is only directed at qualified investors in that Member State within the meaning of the Prospectus Regulation.Exclusively for potential investors in Austria, Belgium, Croatia, Denmark, Finland, France, Germany, Great Britain, Hungary, Ireland, Italy, Liechtenstein, Luxembourg, Malta, The Netherlands, Norway, Poland, Romania, Slovakia, Spain and Sweden the 2021 Base Prospectus (EU) is made available on the Issuer’s website under www.21Shares.com.The approval of the 2021 Base Prospectus (EU) should not be understood as an endorsement by the SFSA of the securities offered or admitted to trading on a regulated market. Eligible potential investors should read the 2021 Base Prospectus (EU) and the relevant Final Terms before making an investment decision in order to understand the potential risks associated with the decision to invest in the securities. You are about to purchase a product that is not simple and may be difficult to understand.This document constitutes advertisement within the meaning of the Swiss Financial Services Act (the “FinSA”) and not a prospectus. In accordance with article 109 of the Swiss Financial Services Ordinance, the Base Prospectus dated 12 November 2021, as supplemented from time to time and the final terms for any product issued have been prepared in compliance with articles 652a and 1156 of the Swiss Code of Obligations, as such articles were in effect immediately prior to the entry into effect of the FinSA, and the Listing Rules of the SIX Swiss Exchange in their version in force as of January 1, 2020. Consequently, the Prospectus has not been and will not be reviewed or approved by a Swiss review body pursuant to article 51 of the FinSA, and does not comply with the disclosure requirements applicable to a prospectus approved by such a review body under the FinSA.


Franklin Templeton lanserar ETF för korta amerikanska statsobligationer

AIQT ETF spårar företag från emerging markets som följer Parisavtalet

ETF- och ETP-noteringar den 30 juni 2025

SNTE ETF avkastar den den kortfristiga euroräntan plus en justering

Hetaste investeringstemat i juni 2025

De bästa ETFer som investerar i europeiska utdelningsaktier

YieldMax® lanserar sin andra produkt för europeiska investerare

Big News for Nuclear Energy—What It Means for Investors

Nya börshandlade produkter på Xetra

3EDS ETN ger tre gånger den negativa avkastningen på flyg- och försvarsindustrin
-
 Nyheter1 vecka sedan
De bästa ETFer som investerar i europeiska utdelningsaktier
-
 Nyheter3 veckor sedan
YieldMax® lanserar sin andra produkt för europeiska investerare
-
 Nyheter3 veckor sedan
Big News for Nuclear Energy—What It Means for Investors
-
 Nyheter4 veckor sedan
Nya börshandlade produkter på Xetra
-
 Nyheter3 veckor sedan
3EDS ETN ger tre gånger den negativa avkastningen på flyg- och försvarsindustrin
-
 Nyheter1 vecka sedan
Nordea Asset Management lanserar nya ETFer på Xetra
-

 Nyheter4 veckor sedan
HANetfs VD Hector McNeil kommenterar FCAs kryptonyheter
-
 Nyheter1 vecka sedan
Svenska investerare — 21Shares Nasdaq Stockholm-sortiment har just blivit starkare