
Nyheter
Crypto Market Compass 3. June 2024
• Cryptoassets underperformed due to a general decline in risk appetite
• Our in-house “Cryptoasset Sentiment Indicator” has increased slightly and still signals neutral levels in sentiment
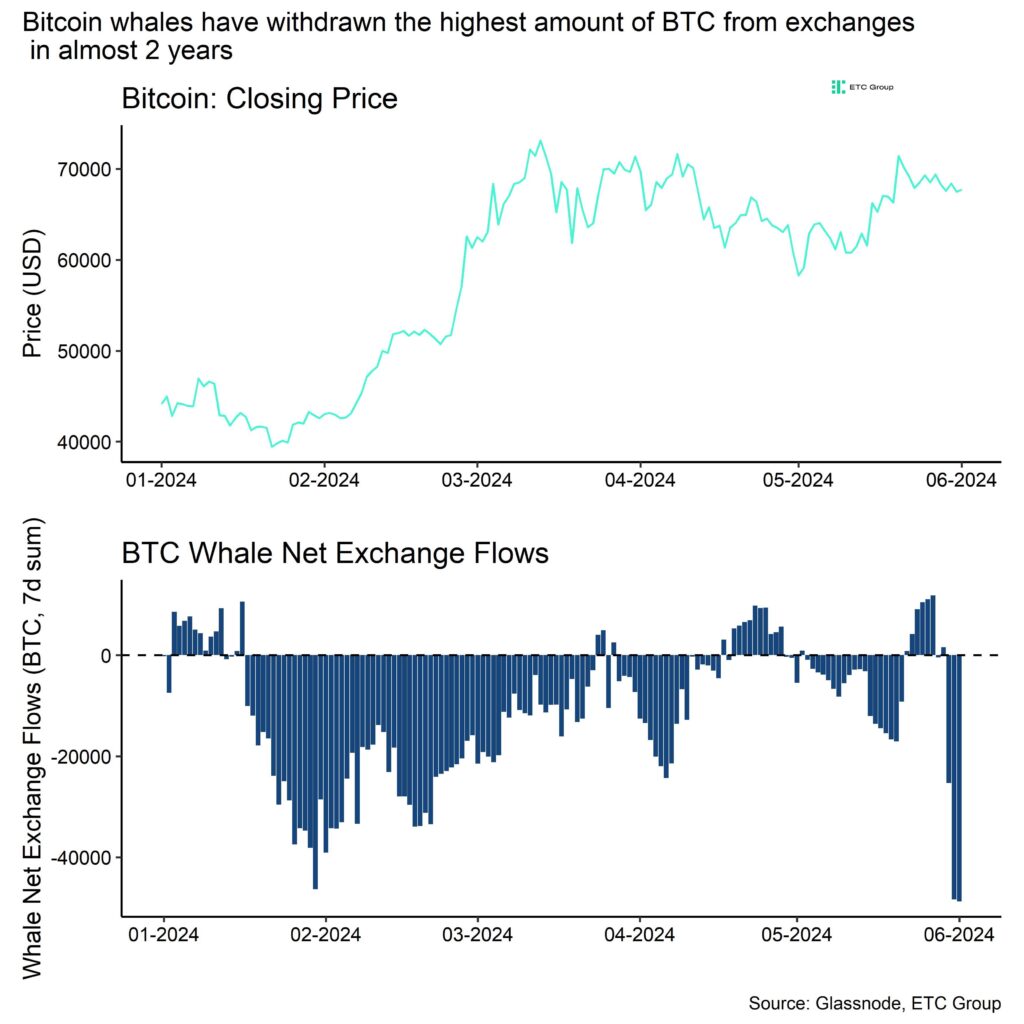
• Bitcoin whales’ transfers from exchanges reach the highest amount since almost 2 years in a sign of increasing institutional appetite for cryptoassets
Chart of the Week
Performance
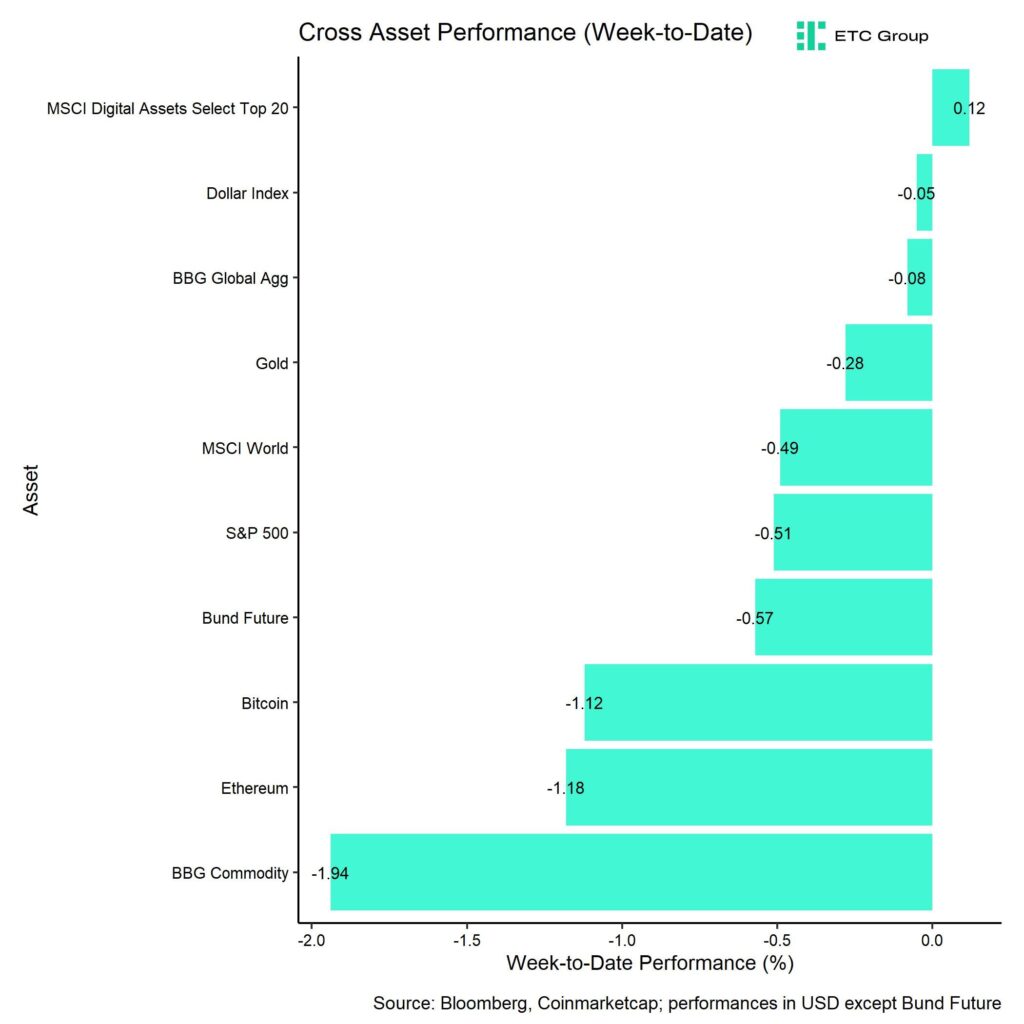
Last week, cryptoassets underperformed traditional assets like equities due to a general decline in cross-asset risk appetite.
Weekly US spot Bitcoin ETF net inflows were relatively positive with around 171 mn USD but still significantly lower than what we had seen until mid-March. Meanwhile, global Ethereum ETP flows have already picked up following the recent US spot Ethereum ETF approval. It seems as if some investors are already positioning in anticipation of higher net inflows going forward.
Apart from this, we saw very significant whale withdrawals of bitcoins from exchanges that took place on Kraken (Chart-of-the-Week). Whales are defined as network entities that control at least 1,000 BTC. This very significant shift in net exchange transfers by whales happened after whales had just recently sent most bitcoins to exchanges year-to-date.
However, the latest withdrawals represent the highest withdrawals in almost 2 years. Withdrawals of this size are usually very positive for performance as they exacerbate supply illiquidity on exchanges which tends to support prices.
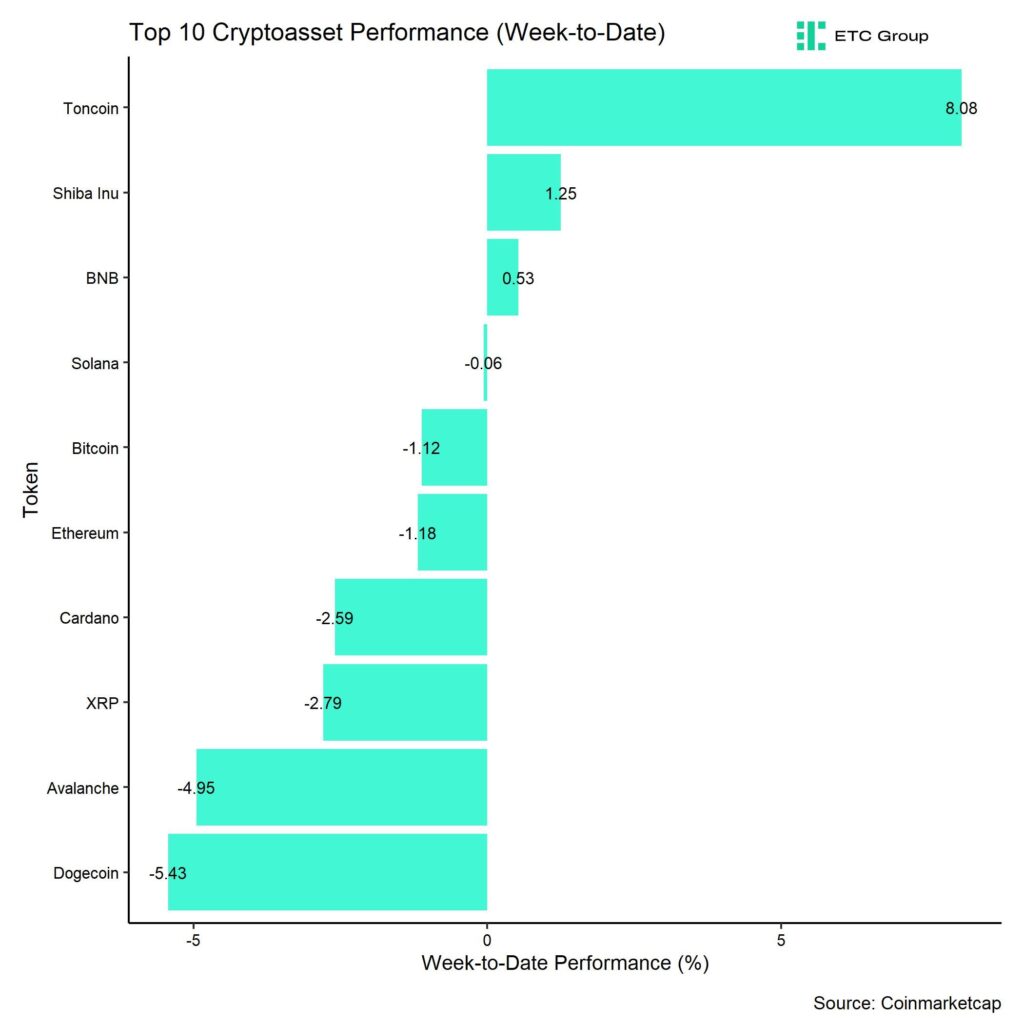
In general, among the top 10 crypto assets, Toncoin, Shiba Inu and BNB were the relative outperformers.
However, overall altcoin outperformance vis-à-vis Bitcoin has declined again compared to the prior week, with only around 45% of our tracked altcoins managing to outperform Bitcoin on a weekly basis.
Sentiment
Our in-house “Cryptoasset Sentiment Index” has increased marginally last week is currently still signalling neutral sentiment.
At the moment, only 5 out of 15 indicators are above their short-term trend.
Last week, there were significant reversals to the downside in the BTC perpetual funding rate and our measure of Cross Asset Risk Appetite (CARA).
The Crypto Fear & Greed Index signals ”Greed” as of this morning.
Performance dispersion among cryptoassets has reversed to the downside again
and remains very low. Most altcoins are still trading in line with Bitcoin.
Altcoin outperformance vis-à-vis Bitcoin has declined compared to the week prior, with only around 45% of our tracked altcoins outperforming Bitcoin on a weekly basis. The decline in altcoin outperformance also signals a renewed underperformance of Ethereum vis-à-vis Bitcoin again.
In general, increasing (decreasing) altcoin outperformance tends to be a sign of increasing (decreasing) risk appetite within cryptoasset markets.
Meanwhile, sentiment in traditional financial markets came off its highs recently, judging by our own measure of Cross Asset Risk Appetite (CARA).
Fund Flows
Last week, we saw another week of positive net inflows into global crypto ETPs of around +183.6 mn USD but significantly lower than the +1bn USD net inflows the week prior.
Global Bitcoin ETPs saw net inflows of +109.7 mn USD last week of which +170.9 mn USD (net) were related to US spot Bitcoin ETFs alone.
Flows into Hong Kong spot Bitcoin ETFs saw minor net outflows of around -5.8 mn USD, according to data provided by Bloomberg.
The ETC Group Physical Bitcoin ETP (BTCE) also saw minor net outflows equivalent to -5.9 mn USD while the ETC Group Core Bitcoin ETP (BTC1) saw net inflows of +1.5 mn USD last week.
The Grayscale Bitcoin Trust (GBTC) continued to see negative net flows with approximately -260.6 mn USD last week while other major US spot Bitcoin ETFs
continued to attract more capital.
iShares’ IBIT attracted another +297.7 mn USD in a single week and has now become the biggest Bitcoin ETF in the world.
Global Ethereum ETPs saw a reversal in ETP flows last week, with net inflows of around +73.5 mn USD.
Hong Kong spot Ethereum ETFs that also saw net inflows last week of around +38.2 mn USD, according to data provided by Bloomberg.
Furthermore, the ETC Group Physical Ethereum ETP (ZETH) saw another week of net inflows of +3.3 mn USD last week. The ETC Group Ethereum Staking ETP (ET32) saw neither in- nor outflows last week (+/- 0 mn USD).
Besides, Altcoin ETPs ex Ethereum also experienced some net inflows of around +13.1 mn USD last week.
Besides, Thematic & basket crypto ETPs continued to see minor net outflows of -12.7 mn USD, based on our calculations. In contrast, the ETC Group MSCI Digital Assets Select 20 ETP (DA20) saw neither in- nor outflows last week (+/- 0 mn USD).
Meanwhile, the beta of global crypto hedge funds to Bitcoin over the last 20 trading days continued to decrease to around 0.87. This implies that global crypto hedge funds are still reducing their market exposure and have currently a slight underweight exposure to Bitcoin.
On-Chain Data
Probably the most significant on-chain development last week was the net whale exchange transfers. Bitcoin whales transferred around -49,333 BTC over the past 7 days (Chart-of-the-Week).
Most of these net transfers are attributable to two whale transfers that happened on Kraken last week:
Around ~20k BTC were withdrawn from Kraken at around 4 pm UTC on the 30th of May and another ~15k BTC were withdrawn at around 3 pm UTC on the 31st of May. It is still unclear whether these large transfers were made by an investor, non-financial corporate or even sovereign entity.
In any case, these whale transfers mark a significant shift in net transfers overall as whales had just sent the highest amount of bitcoins to exchanges year-to-date before these outsized withdrawals.
The abovementioned withdrawals also sent BTC on-exchange balances to a fresh 6-year low according to data provided by Glassnode. Only 11.58% of total available BTC supply is currently on exchanges.
The amount of illiquid BTC supply based on a definition by Glassnode has hit an all-time high. This is bound to be a significant tailwind for Bitcoin and Cryptoassets.
Another significant on-chain development last week were internal transfers by Mt. Gox trustee that temporarily put pressure on prices as the market speculated that a larger distribution by this entity was imminent. Although most experts tagged these outflows as genuine outflows at first, they appear to be internal transfers within cold wallets.
At the time of writing, around 141,686 BTC remain in wallets controlled by the Mt. Gox trustee according to data provided by Glassnode. This is certainly a large amount and any distribution of this size would most-likely be associated with significant temporary downside.
Futures, Options & Perpetuals
Last week, BTC futures open interest decreased while and BTC perpetual open interest increased in BTC-terms. The decrease in BTC futures open interest was mostly attributable to a larger decline in CME futures open interest.
That being said, both long and short futures liquidations remained relatively low last week.
The Bitcoin futures basis mostly went sideways last week. At the time of writing, the Bitcoin futures annualized basis rate stands at around 13.7% p.a. However, net short positions in Bitcoin futures contracts on CME reached their highest level on record indicating that traders are increasingly making use of the basis.
Meanwhile, perpetual funding rates continued to stay relatively high signalling decent demand for long perpetual contracts.
Bitcoin options’ open interest declined significantly due to outsized option expires at the end of May. Put-Call open interest ratios also declined indicating that expired puts were mostly not rolled over. Relative put-call volume ratios only spiked temporarily on Tuesday last week.
However, the 25-delta BTC 1-month option skew increased slightly throughout the week, implying an increased demand for puts relative to calls.
BTC option implied volatilities continued to decrease last week. Implied volatilities of 1-month ATM Bitcoin options are currently at around 49.3% p.a.
Bottom Line
• Cryptoassets underperformed due to a general decline in risk appetite
• Our in-house “Cryptoasset Sentiment Indicator” has increased slightly and still signals neutral levels in sentiment
• Bitcoin whales’ transfers from exchanges reach the highest amount since almost 2 years in a sign of increasing institutional appetite for cryptoassets
To read our Crypto Market Compass in full, please click the button below:

This is not investment advice. Capital at risk. Read the full disclaimer
© ETC Group 2019-2024 | All rights reserved


21Shares lanserar DYDX – Din port till decentraliserade perpetuals

Ossiam noterar fond som investerar i utvecklade länder i Eurozonen

Xetra välkomnar Investlinx som ny ETF-utgivare

BCFK ETF är en likaviktad satsning på S&P500

Tio centralbanker med mer än 24 000 ton guld

Månadsutdelande ETFer uppdaterad med IncomeShares produkter

Utdelningar och försvarsfonder lockade i augusti

HANetfs analyserar hur ett fredsavtal kan påverka det europeiska försvaret

HANetfs VD kommenterar Trump-Putin-toppmötet

ADLT ETF investerar bara i riktigt långa amerikanska statsobligationer
-
 Nyheter3 veckor sedan
Månadsutdelande ETFer uppdaterad med IncomeShares produkter
-
 Nyheter2 veckor sedan
Utdelningar och försvarsfonder lockade i augusti
-
 Nyheter3 veckor sedan
HANetfs analyserar hur ett fredsavtal kan påverka det europeiska försvaret
-
 Nyheter4 veckor sedan
HANetfs VD kommenterar Trump-Putin-toppmötet
-
 Nyheter3 veckor sedan
ADLT ETF investerar bara i riktigt långa amerikanska statsobligationer
-

 Nyheter2 veckor sedan
Fastställd utdelning i MONTDIV augusti 2025
-

 Nyheter1 vecka sedan
Septembers utdelning i XACT Norden Högutdelande
-

 Nyheter1 vecka sedan
HANetf kommenterar mötet mellan Kina, Ryssland och Nordkorea vid militärparad