Följ oss

Nyheter

Bitcoin’s Volatility and Stablecoin’s Market Viability: What Happened in Crypto This Week?

Publicerad

den

Bullish, Bearish, or Both? Macro Mayhem Leads to Bitcoin Volatility Beyond Borders and Banks: Stablecoins Proving their Market Viability

• Bullish, Bearish, or Both? Macro Mayhem Leads to Bitcoin Volatility

• Bitcoin’s Institutional Embrace is Accelerating

• Beyond Borders and Banks: Stablecoins Proving their Market Viability

Macro Mayhem Leads to Bitcoin Volatility

Last week, Bitcoin navigated a wave of conflicting U.S. macroeconomic events. The FOMC press conference last Wednesday confirmed the Fed will sustain high interest rates at 5.25-5.5% as the challenge of achieving the inflation target persists. As shown in Figure 1, this initially triggered Bitcoin’s price to drop by 5.9% as investors sought the safety of fixed-income assets. Friday’s U.S. Jobs report reversed the negative sentiment from the FOMC meeting. The report revealed a disappointing labor market, with only 175,000 non-farm jobs added, as unemployment rose to 3.9%. This data fueled hopes for rate cuts, which bodes well for risk-on assets, which led to Bitcoin rebounding by 6.7% to ~$63,000 by week’s end.

Figure 1: Bitcoin 1 Week Price Performance (April 29, 2024 – May 6, 2024)
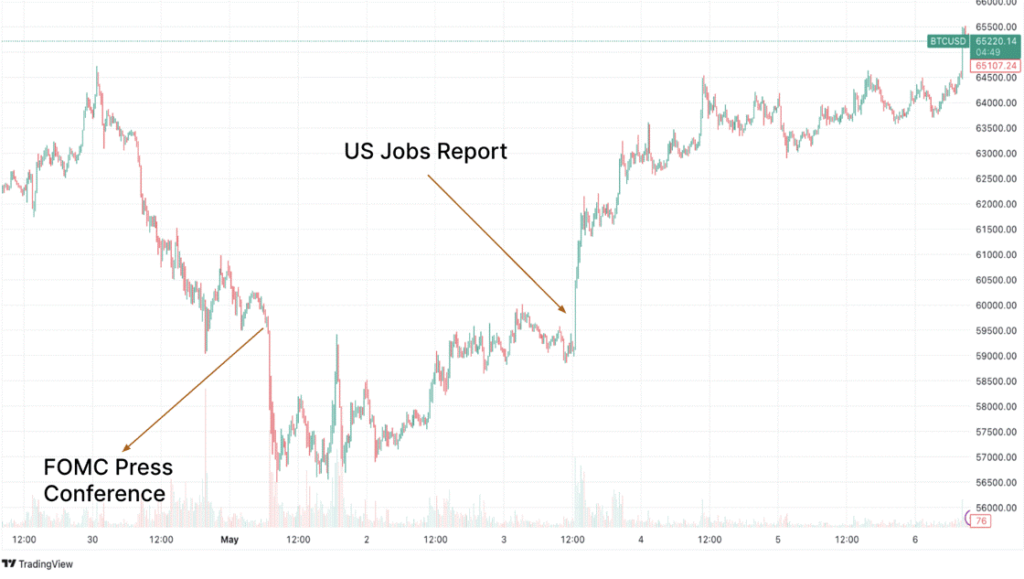
Source: TradingView

Looking ahead, several developments could provide tailwinds for Bitcoin. The upcoming Treasury buyback program, the first since 2002, is launching on May 29 and has several implications for the broader financial landscape. By conducting weekly bond buybacks of up to $2 billion, outstanding debt is reduced while liquidity is increased, which could allow capital to flow into riskier assets. The reduced bond supply also puts downward pressure on yields, potentially making Bitcoin more attractive.

The recent Treasury refinancing announcement also looks promising for Bitcoin. A lower target balance for the Treasury General Account (TGA) suggests the government needs to borrow less, which frees up capital. The impact could be compared to quantitative easing, instead of withdrawing liquidity from the market by selling new bonds, the Treasury effectively injects liquidity by not needing to borrow as much. This additional liquidity eventually reaches the banking system, potentially leading to easier access to credit and lower interest rates. As we have voiced throughout, this environment would benefit riskier assets like Bitcoin.

Despite the initial price drop triggered by the Fed’s hawkish stance on interest rates, Bitcoin’s resilience was evident in its subsequent rebound driven by a weakening labor market and the potential prospect of a dovish shift. As illustrated below, Bitcoin’s funding rate is now similar to when it was trading at around $29,000, which signals a healthy market adjustment, shedding excess leverage. Looking ahead, the upcoming Treasury actions will undoubtedly affect U.S. liquidity and interest rate levels, which are key to Bitcoin’s performance and will be closely monitored in the coming weeks.

Figure 2: Bitcoin’s Funding Rate

Source: Glassnode

Bitcoin’s Institutional Embrace is Accelerating

Fueled by the U.S. Bitcoin ETF launch, the institutional adoption of Bitcoin is accelerating. A staggering $175 billion is estimated to be held by ETFs, countries, and public and private companies, representing roughly 15% of the total Bitcoin supply. While miniscule compared to the U.S. launch, Hong Kong’s Bitcoin ETFs further exemplify this trend, accumulating 4.2K BTC, or nearly $270 million, within their first week of trading. This showcases the growing appetite for the asset, however the hunger for Bitcoin is not limited to Hong Kong. Ovata Capital Management’s $60 million allocation into the U.S. spot ETFs underscores this trend, which is set to continue as the May 15 deadline for 13F filings approaches, which may reveal previously undisclosed positions held by institutions.

Recent disclosures by BNY Mellon and BNP Paribas, along with Swiss funds Bellecapital International and Lugano Financial Advisors, provide further evidence of Bitcoin’s institutionalization. Moreover, according to BlackRock, the world’s largest sovereign wealth funds (SWFs), including Norway’s $1.6 trillion fund, Saudi Arabia’s Public Investment Fund, and Kuwait’s Investment Authority, are re-initiating discussions around Bitcoin. The SWF industry is valued at $11.6 trillion, therefore even a moderate allocation into the asset could see demand catapult to new levels, and provide a tipping point for broader adoption. Importantly, it is becoming more difficult to discount the asset – Bitcoin’s unique profile as both a risk-on and risk-off asset is becoming increasingly relevant given the complex macroeconomic landscape.

Further, Bitcoin’s adoption is transcending passive investment strategies. For instance, fintech giant Nubank, housing 80 million users, now offers crypto deposits and withdrawals, aiming to bridge the gap between traditional finance and crypto in Latin America. Lastly, Microstrategy, synonymous with their commitment to Bitcoin, are pushing the boundaries further by building an identity solution on the Ordinals network. This exemplifies the use of Bitcoin beyond a decentralized payment system, a notion we have echoed in the past weeks as Bitcoin continues to evolve beyond its original purpose.

Finally, the coming weeks promise further clues on the US economic trajectory and Bitcoin institutional adoption. There are eight Fed speaker events this week, and while they don’t directly address crypto, they often offer valuable insights into the current economic conditions. This, coupled with the turbulence expected during Q1 earnings season, could create volatility in equity markets, which may spill over to crypto as investors react accordingly.

Beyond Borders and Banks: Stablecoins Proving their Market Viability

After a six-year hiatus, Stripe is re-entering the crypto industry by enabling customers to accept stablecoins for online payments. Stripe was among the pioneers in integrating Bitcoin back in 2014. However, they ceased support in 2018 due to Bitcoin’s prolonged processing times and high transaction costs, which didn’t present a significant improvement over its traditional counterpart. Since then, the industry has undergone a major transformation, with the emergence of numerous smart-contract platforms and scaling efforts, enhancing the potential of crypto’s infrastructure to offer a superior user experience.

For instance, Stripe’s co-founder showcased a $100 USDC payment using Solana at the company’s annual conference. The demo corroborated how the payment was processed in less than a second instead of days while incurring $0.0037 in network fees, a cost reduction of almost 800-fold compared to a credit card. This is a testament to the advancements achieved by the latest generation of platforms, such as Solana, which addressed some of the drawbacks, like high transaction costs and lengthy processing times, while demonstrating their efficacy for use cases requiring a high volume of interactions, such as payments.

To that end, Stripe will begin supporting USDC payments through Ethereum, Solana, and Polygon. This integration marks a significant milestone, given Stripe’s substantial 35% market share in the payments industry. However, it’s even more crucial as users can seamlessly leverage the efficiencies of crypto’s infrastructure, ensuring reduced transaction costs and notably swifter processing times while remaining unaware of the use of blockchain technology in the backend. This mirrors how users are often unaware of the payment infrastructure their preferred fintech apps utilize. At 21Shares, we firmly believe that this kind of seamless integration is imperative for the widespread adoption of crypto.

That said, while Tether leads by market capitalization with $110 billion compared to USDC’s $33 billion, USDC actually dominates in terms of usage when looking at transaction volume. According to Visa’s latest on-chain analytical dashboard aiming to dissect the growth of the stablecoin sector, USDC is now responsible for more than 70% of all stablecoin payments, as illustrated below. As we’ve emphasized for years, exemplified by our own work on Dune, on-chain analytics represents the future of capital markets. It offers unparalleled transparency and real-time data access, unlike traditional industries reliant on periodic disclosures of quarterly financials. Therefore, Visa’s active engagement in on-chain analytics marks a watershed moment, reaffirming our long-held belief that this is the path forward.

Figure 3: Stablecoins Monthly Transaction Volume

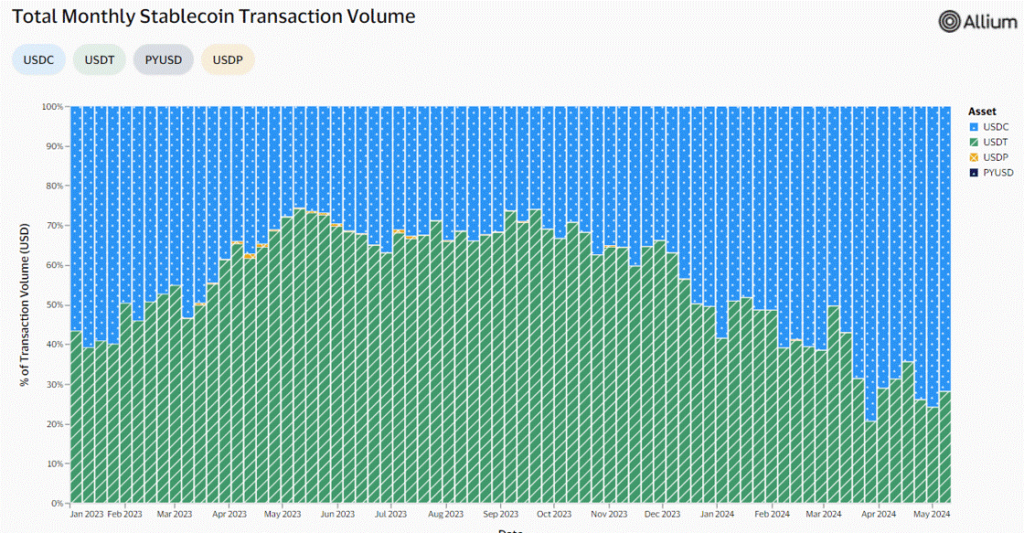
Source: Alluvium X Visa

Despite USDC’s widespread adoption, Tether has achieved remarkable financial success in Q1. The company raked in a staggering $4.52B in profits by strategically deploying user deposits into U.S. treasury and repurchase agreements. The exposure to debt, coupled with rising Bitcoin and Gold prices, has proven to be a lucrative formula. As a result, Tether’s net profit now eclipses that of financial giants like Citibank, Goldman Sachs, and Morgan Stanley, highlighting the burgeoning business potential of the fiat-backed stablecoin model.

Further, characterized by its disintermediated structure and emphasis on user experience, stablecoins have proven themselves as a viable alternative within the financial landscape. They are arguably one of crypto’s most compelling use cases right now. Its significance becomes even more apparent in regions facing economic instability, where users turn to stablecoins as a swift means to access the U.S. dollar, safeguarding themselves against currency devaluation. Turkey serves as a notable case study, stablecoin transactions account for a remarkable 4% of the nation’s GDP, the highest proportion globally, at a time when the Turkish Lira lost more than 75% of its value against the U.S. dollar over the last 5 years.

Finally, Tether is intensifying its efforts by launching USDT on the TON blockchain, which is closely linked to Telegram. Despite TON’s recent rise in popularity with approximately 1.74M users, it aims to tap into Telegram’s vast 900M user base through its deep integration. This move could significantly expand the market for stablecoins, currently serving around 25M users. Moreover, this integration is a pivotal step in simplifying crypto usage, concealing its complexities, and paving the way for mass adoption.

This Week’s Calendar

Source: Forex Factory, 21Shares

Research Newsletter

Each week the 21Shares Research team will publish our data-driven insights into the crypto asset world through this newsletter. Please direct any comments, questions, and words of feedback to research@21shares.com

Disclaimer

The information provided does not constitute a prospectus or other offering material and does not contain or constitute an offer to sell or a solicitation of any offer to buy securities in any jurisdiction. Some of the information published herein may contain forward-looking statements. Readers are cautioned that any such forward-looking statements are not guarantees of future performance and involve risks and uncertainties and that actual results may differ materially from those in the forward-looking statements as a result of various factors. The information contained herein may not be considered as economic, legal, tax or other advice and users are cautioned to base investment decisions or other decisions solely on the content hereof.

Fortsätt läsa
Annons
Klicka för att kommentera

Skriv en kommentar

Din e-postadress kommer inte publiceras. Obligatoriska fält är märkta *

Nyheter

April in ETFs: Gold at New Highs, Crypto in Transition, and Moat Index Holding Steady

Publicerad

den

As April winds down, markets remain on edge, with escalating tariffs and renewed trade tensions keeping volatility in focus. In this summary of our full-length newsletter, we spotlight gold and gold equities, both of which have surged to record levels. We also take a step back from the day-to-day noise in crypto to explore the broader shifts in the regulatory landscape in our latest Whitepaper and present Celestia in detail. Finally, we assess how Moat indexes have held up and evolved amid the turbulence.

As April winds down, markets remain on edge, with escalating tariffs and renewed trade tensions keeping volatility in focus. In this summary of our full-length newsletter, we spotlight gold and gold equities, both of which have surged to record levels. We also take a step back from the day-to-day noise in crypto to explore the broader shifts in the regulatory landscape in our latest Whitepaper and present Celestia in detail. Finally, we assess how Moat indexes have held up and evolved amid the turbulence.

Your VanEck Europe team wishes you a great read.


Featured Articles

🥇 Are Gold Mining Equities Regaining Attention Amid Rising Gold Prices?

Gold & Gold mining equities tend to shine during stress periods

Source: VanEck, World Gold Council.

Gold has attracted renewed interest from investors amid concerns about inflation, currency volatility, and overall market uncertainty. Gold mining companies have recently reported improved profit margins and cash generation, with some initiating share buybacks and maintaining relatively strong balance sheets. Despite these developments, many continue to trade below their historical valuation averages.

While historical trends indicate that gold and gold mining equities have outperformed during certain periods of market stress, these patterns may not repeat under different economic conditions. Performance can be influenced by a range of factors including interest rates, central bank policy, geopolitical developments, and investor sentiment.

→ Read more

⚖️ Whitepaper Highlights: How New Crypto Regulations May Shape the Future

Cryptocurrencies are entering a new era. With the re-election of Donald Trump and the implementation of the European Union’s Markets in Crypto-Assets (MiCA) regulation, digital assets are moving into a landscape defined not just by innovation, but also by regulatory clarity.

MiCA’s structured and transparent approach aims to promote legitimacy, safeguard investors, and enhance trust in digital asset markets across Europe. It could also serve as a blueprint for other jurisdictions looking to regulate crypto effectively.

→ Read the Whitepaper Highlights

⛓️ Introduction to Celestia

Most blockchains, like Ethereum or Bitcoin, are monolithic which means they perform all major functions (consensus, data availability, and execution) on a single layer. This design ensures security but according to new modular networks, limits scalability and flexibility.

The modular blockchain thesis, which Celestia is leading, proposes separation of layers and respective responsibilities in the network.

→ Read more

Note: This article in not accessible to our UK readers.

🌊 Riding the Gold Wave

Chasing the Vein: Fund Flows into Gold Miners

Source: Mining.com. Data as of 21 March 2025. Note: Data covers 493 funds with combined assets under management of $62 billion.

U.S. equity markets experienced significant declines during the month of March. Meanwhile, spot gold price recorded new all-time highs, surpassing the $3,000 per ounce mark on 14 March and closing at a record price of $3123.57 on March 31, a 9.30% ($265.73) monthly gain. As of 31 March, gold prices have risen by 93.61% over the past five years (1). Investors should keep in mind that past performance is not representative of future results.

The gold miners, as represented by the NYSE Arca Gold Miners Index (GDMNTR), outperformed significantly, up 15.51% during March (2). This gain reflects both their operational leverage to rising gold prices and market perceptions of relative value. However, gold miners can also be subject to heightened volatility, operational risks, and sensitivity to commodity price swings.

While gold and gold equities may serve as diversifiers in a portfolio due to their historically low correlations with many asset classes, investors should remain mindful of the inherent risks, including price volatility, currency movements, and shifts in investor sentiment that can lead to rapid reversals in performance.

→ Read more

🌪️ Moat Stocks Weather Tariff Tumble

Market turbulence in March weighed on stocks. The Moat Index was not immune to the market turmoil, as it declined along with the broad U.S. equity market ending the month lower. However, the Moat Index showed resilience relative to the S&P 500—thanks in part to defensive sector resilience and underweight exposure to mega-caps.

At the same time, the SMID Moat Index lagged small and mid-caps in March. Smaller U.S. stocks were also impacted by global trade tensions and economic growth concerns with the broad small- and mid-cap benchmarks falling during the month. However, year-to-date, the SMID Moat Index remains ahead of the broader small- and mid-cap markets.

→ Read more


This is a preview of our monthly ETF insights email newsletter.

To receive the full version, sign up here.


(1) Source: World Gold Council, ICE Data Services, FactSet Research Systems Inc.

(2) Source: Financial Times.

IMPORTANT INFORMATION

This is marketing communication. Please refer to the prospectus of the UCITS and to the KID/KIID before making any final investment decisions. These documents are available in English and the KIDs/KIIDs in local languages and can be obtained free of charge at www.vaneck.com, from VanEck Asset Management B.V. (the “Management Company”) or, where applicable, from the relevant appointed facility agent for your country.

For investors in Switzerland: VanEck Switzerland AG, with registered office in Genferstrasse 21, 8002 Zurich, Switzerland, has been appointed as distributor of VanEck´s products in Switzerland by the Management Company. A copy of the latest prospectus, the Articles, the Key Information Document, the annual report and semi-annual report can be found on our website www.vaneck.com or can be obtained free of charge from the representative in Switzerland: Zeidler Regulatory Services (Switzerland) AG, Neudtadtgasse 1a, 8400 Winterthur, Switzerland. Swiss paying agent: Helvetische Bank AG, Seefeldstrasse 215, CH-8008 Zürich.

For investors in the UK: This is a marketing communication targeted to FCA regulated financial intermediaries. Retail clients should not rely on any of the information provided and should seek assistance from a financial intermediary for all investment guidance and advice. VanEck Securities UK Limited (FRN: 1002854) is an Appointed Representative of Sturgeon Ventures LLP (FRN: 452811), which is authorised and regulated by the Financial Conduct Authority (FCA) in the UK, to distribute VanEck´s products to FCA regulated firms such as financial intermediaries and Wealth Managers.

This information originates from VanEck (Europe) GmbH, which is authorized as an EEA investment firm under MiFID under the Markets in Financial Instruments Directive (“MiFiD). VanEck (Europe) GmbH has its registered address at Kreuznacher Str. 30, 60486 Frankfurt, Germany, and has been appointed as distributor of VanEck products in Europe by the Management Company. The Management Company is incorporated under Dutch law and registered with the Dutch Authority for the Financial Markets (AFM).

This material is only intended for general and preliminary information and shall not be construed as investment, legal or tax advice. VanEck (Europe) GmbH and its associated and affiliated companies (together “VanEck”) assume no liability with regards to any investment, divestment or retention decision on the basis of this information. The views and opinions expressed are those of the author(s) but not necessarily those of VanEck. Opinions are current as of the publication date and are subject to change with market conditions. Information provided by third party sources is believed to be reliable and have not been independently verified for accuracy or completeness and cannot be guaranteed.

Morningstar® Wide Moat Focus IndexSM, Morningstar® US Sustainability Moat Focus Index, Morningstar® US Small-Mid Cap Moat Focus IndexSM, and Morningstar® Global Wide Moat Focus IndexSM are trademarks or service marks of Morningstar, Inc. and have been licensed for use for certain purposes by VanEck. VanEck’s ETFs are not sponsored, endorsed, sold or promoted by Morningstar, and Morningstar makes no representation regarding the advisability of investing in the ETFs. Morningstar bears no liability with respect to the ETFs or any securities.

Effective December 15, 2023, the carbon risk rating screen was removed from the Morningstar® US Sustainability Moat Focus Index. Effective December 17, 2021, the Morningstar® Wide Moat Focus IndexTM was replaced with the Morningstar® US Sustainability Moat Focus Index. Effective June 20, 2016, Morningstar implemented several changes to the Morningstar® Wide Moat Focus Index construction rules. Among other changes, the index increased its constituent count from 20 stocks to at least 40 stocks and modified its rebalance and reconstitution methodology. These changes may result in more diversified exposure, lower turnover, and longer holding periods for index constituents than under the rules in effect prior to that date.

NYSE Arca Gold Miners Index is a service mark of ICE Data Indices, LLC or its affiliates (“ICE Data”) and has been licensed for use by VanEck UCITS ETF plc (the “Fund”) in connection with the ETF. Neither the Fund nor the ETF is sponsored, endorsed, sold or promoted by ICE Data. ICE Data makes no representations or warranties regarding the Fund or the ETF or the ability of the NYSE Arca Gold Miners Index to track general stock market performance. ICE DATA MAKES NO EXPRESS OR IMPLIED WARRANTIES, AND HEREBY EXPRESSLY DISCLAIMS ALL WARRANTIES OF MERCHANTABILITY OR FITNESS FOR A PARTICULAR PURPOSE WITH RESPECT TO THE NYSE ARCA GOLD MINERS INDEX OR ANY DATA INCLUDED THEREIN. IN NO EVENT SHALL ICE DATA HAVE ANY LIABILITY FOR ANY SPECIAL, PUNITIVE, INDIRECT, OR CONSEQUENTIAL DAMAGES (INCLUDING LOST PROFITS), EVEN IF NOTIFIED OF THE POSSIBILITY OF SUCH DAMAGES. ICE Data Indices, LLC and its affiliates (“ICE Data”) indices and related information, the name “ICE Data”, and related trademarks, are intellectual property licensed from ICE Data, and may not be copied, used, or distributed without ICE Data’s prior written approval. The Fund has not been passed on as to its legality or suitability, and is not regulated, issued, endorsed’ sold, guaranteed, or promoted by ICE Data.

The S&P 500 Index (“Index”) is a product of S&P Dow Jones Indices LLC and/or its affiliates and has been licensed for use by Van Eck Associates Corporation. Copyright © 2020 S&P Dow Jones Indices LLC, a division of S&P Global, Inc., and/or its affiliates. All rights reserved. Redistribution or reproduction in whole or in part are prohibited without written permission of S&P Dow Jones Indices LLC. For more information on any of S&P Dow Jones Indices LLC’s indices please visit www.spdji.com. S&P® is a registered trademark of S&P Global and Dow Jones® is a registered trademark of Dow Jones Trademark Holdings LLC. Neither S&P Dow Jones Indices LLC, Dow Jones Trademark Holdings LLC, their affiliates nor their third party licensors make any representation or warranty, express or implied, as to the ability of any index to accurately represent the asset class or market sector that it purports to represent and neither S&P Dow Jones Indices LLC, Dow Jones Trademark Holdings LLC, their affiliates nor their third party licensors shall have any liability for any errors, omissions, or interruptions of any index or the data included therein.

It is not possible to invest directly in an index.

Investing is subject to risk, including the possible loss of principal. Investors must buy and sell units of the UCITS on the secondary market via an intermediary (e.g. a broker) and cannot usually be sold directly back to the UCITS. Brokerage fees may incur. The buying price may exceed, or the selling price may be lower than the current net asset value. The indicative net asset value (iNAV) of the UCITS is available on Bloomberg. The Management Company may terminate the marketing of the UCITS in one or more jurisdictions. The summary of the investor rights is available in English at: complaints-procedure.pdf (vaneck.com). For any unfamiliar technical terms, please refer to ETF Glossary | VanEck.

No part of this material may be reproduced in any form, or referred to in any other publication, without express written permission of VanEck.

© VanEck (Europe) GmbH ©VanEck Switzerland AG © VanEck Securities UK Limited

Fortsätt läsa

Nyheter

BBVAE ETF är en spansk ETF som spårar Eurostoxx 50

Publicerad

den

BBVA Acción Eurostoxx 50 ETF FI Cotizado Armonizado (BBVAE ETF) med ISIN ES0105321030, strävar efter att spåra EURO STOXX® 50-index. EURO STOXX® 50-indexet följer de 50 största företagen i euroområdet.

BBVA Acción Eurostoxx 50 ETF FI Cotizado Armonizado (BBVAE ETF) med ISIN ES0105321030, strävar efter att spåra EURO STOXX® 50-index. EURO STOXX® 50-indexet följer de 50 största företagen i euroområdet.

Den börshandlade fondens TER (total cost ratio) uppgår till 0,20 % p.a. ETFen replikerar resultatet av det underliggande indexet genom full replikering (köper alla indexbeståndsdelar). Utdelningarna i ETFen delas ut till investerarna (halvårsvis).

BBVA Acción Eurostoxx 50 ETF FI Cotizado Armonizado har tillgångar på 133 miljoner euro under förvaltning. Denna ETF lanserades den 3 oktober 2006 och har sin hemvist i Spanien.

Beskrivning BBVA Acción Eurostoxx 50 ETF FI Cotizado Armonizado

Med BBVA Acción Eurostoxx 50 ETF FI Cotizado Armonizado deltar investerare i ökningen av värdet på aktierna i de 50 största konglomeraten i euroområdet (euroområdet). Euro Stoxx 50-indexet inkluderar aktier från 8 länder i euroområdet: Belgien, Finland, Frankrike, Tyskland, Irland, Italien, Nederländerna och Spanien.

Handla BBVAE ETF

BBVA Acción Eurostoxx 50 ETF FI Cotizado Armonizado (BBVAE ETF) är en börshandlad fond (ETF) som handlas på Bolsa de Madrid.

Bolsa de Madrid är en marknad som få svenska banker och nätmäklare erbjuder access till, men DEGIRO gör det.

Börsnoteringar

BörsValutaKortnamn
Bolsa de MadridEURBBVAE

Största innehav

VärdepapperVikt %
ASML Holding NVNL00102732158,59%
Lvmh Moet Hennessy Louis Vuitton SEFR00001210145,60%
SAP SEDE00071646005,16%
TotalEnergies SEFR00001202714,59%
Siemens AGDE00072361013,70%
Schneider Electric SEFR00001219723,46%
Future on Euro Stoxx 503,02%
Sanofi SAFR00001205782,99%
L’Oreal SAFR00001203212,98%
Allianz SEDE00084040052,93%

Innehav kan komma att förändras

Fortsätt läsa

Nyheter

The Art of Meme-ing: How Dogecoin Redefined Value

Publicerad

den

Explore Dogecoin's impact on crypto, turning internet memes into cultural and financial assets.

Explore Dogecoin’s impact on crypto, turning internet memes into cultural and financial assets.

𝕋𝕚𝕞𝕖 ℂ𝕠𝕕𝕖𝕤:

00:00 – Intro

00:27 – Where do Memes come from?

03:13 – What are some of the first Memes you remember?

10:28 – Do these things have value?

14:04 – The different types of cryptocurrencies

17:20 – How did Dogecoin start?

24:26 – What is some of the utility?

28:36 – How does it fit into the portfolio?

30:38 – Final thoughts

Research Newsletter

Each week the 21Shares Research team will publish our data-driven insights into the crypto asset world through this newsletter. Please direct any comments, questions, and words of feedback to research@21shares.com

Disclaimer

The information provided does not constitute a prospectus or other offering material and does not contain or constitute an offer to sell or a solicitation of any offer to buy securities in any jurisdiction. Some of the information published herein may contain forward-looking statements. Readers are cautioned that any such forward-looking statements are not guarantees of future performance and involve risks and uncertainties and that actual results may differ materially from those in the forward-looking statements as a result of various factors. The information contained herein may not be considered as economic, legal, tax or other advice and users are cautioned to base investment decisions or other decisions solely on the content hereof.

Fortsätt läsa

21Shares

Prenumerera på nyheter om ETFer

* indicates required

21Shares

Populära