
Nyheter
Bitcoin Expands Utility and All Eyes on Polygon: What Happened in Crypto in November?
Markets flourished in November. The total crypto market cap increased by ~13%, month-over-month, with increased institutional interest in this burgeoning asset class. Stocks also had a comeback last month, with S&P 500 and Nasdaq recording their best performance since July 2022. In line with the market sentiment, Europe’s inflation dropped more than expected to 2.4% in November, down from 2.9% in October, the lowest over two years. The cost of living has eased with plummeting energy prices, but higher interest rates limit the economy’s ability to grow. However, with a cooling inflation towards the ECB’s 2% target, markets are hopeful that interest rates will stop by April 2024. In the U.S., inflation data is coming out on December 12, with indicators like the personal consumption expenditures price index (+0.2% month-over-month) already pointing towards cooling inflation and potential interest rate cuts in 2024.
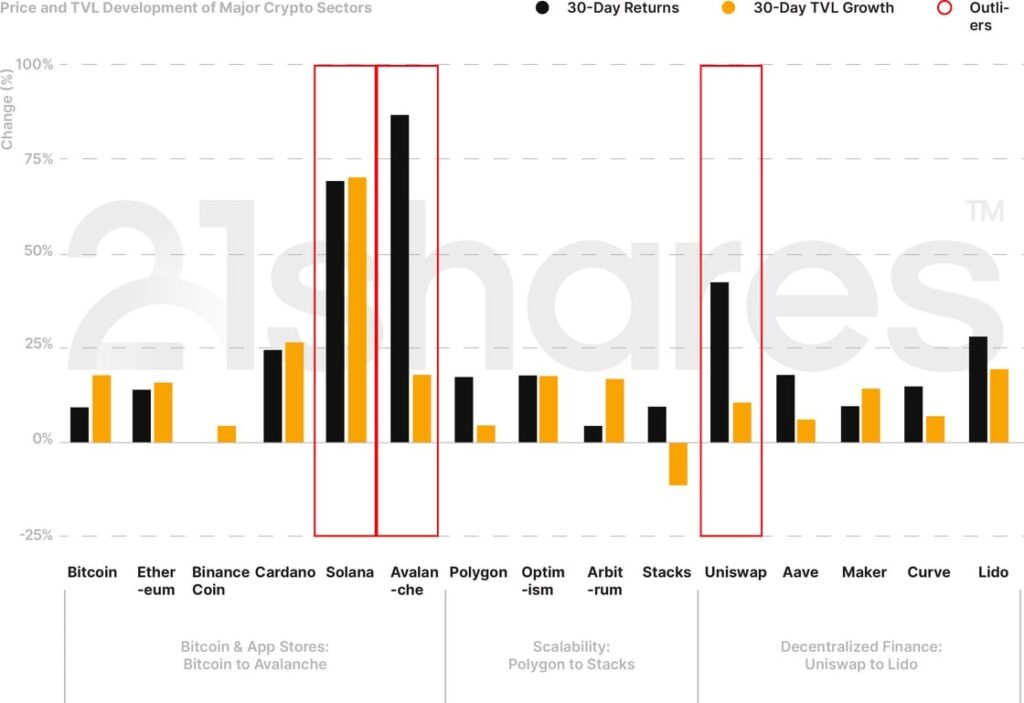
Ahead of the historically calm holiday season, Bitcoin and Ethereum increased by 9.31% and 13.38% in November, respectively, as shown in Figure 1. The biggest winners of last month were Solana (+69.28%), Avalanche (+86.72%), and Uniswap (+42.34%). Additionally, in this report, we’ll explore what Argentina’s new president could mean for South America’s troubled, second-largest economy. We’ll also discuss Bitcoin’s expanding utility and how it reflects on its fundamental metrics; exchanges looking at Polygon for deploying their own custom blockchain; Avalanche aiming to position itself as the platform for financial institutions; and Lido decentralizing its node-infrastructure operations.
Figure 1: Price and TVL Development of Major Crypto Sectors in November 2023
’
Source: 21shares, CoinGecko, DeFi Llama. Data as of November 30, 2023.
5 Trends to Remember from November
Argentina’s New President
Bitcoin rallied back to pass the $37K mark as Argentina elected a pro-Bitcoin, right-wing president, Javier Milei. Although the president-elect made no promise to make Bitcoin a legal tender, the volumes indicate some hope that Milei’s appointment could mean economic revitalization for South America’s second-largest economy with the help of Bitcoin, a la El Salvador. El Salvador’s GDP is expected to reach $33.4B by the end of 2023, a ~20% increase from when it declared Bitcoin as a legal tender in 2021. With an inflation rate exceeding 140% in 2023, Argentina’s GDP growth has been sluggish, averaging 0.51% from 1993 until 2023, as shown in Figure 2.
“The central bank is a scam. What Bitcoin represents is the return of money to its original creator, the private sector,” Argentina’s president-elect said as part of his presidential campaign, vowing to shut down the central bank, replacing the Argentine peso with the US dollar, and embracing decentralized finance. Samson Mow, CEO of JAN3 (a startup scaling Bitcoin) and an advisor to El Salvador during its adoption of Bitcoin, has said he’s planning to meet with Argentina’s new president. Indicators of whether Milei’s plan will work in Argentina’s favor are yet to be discovered.
Figure 2: Argentina’s GDP Growth Rate
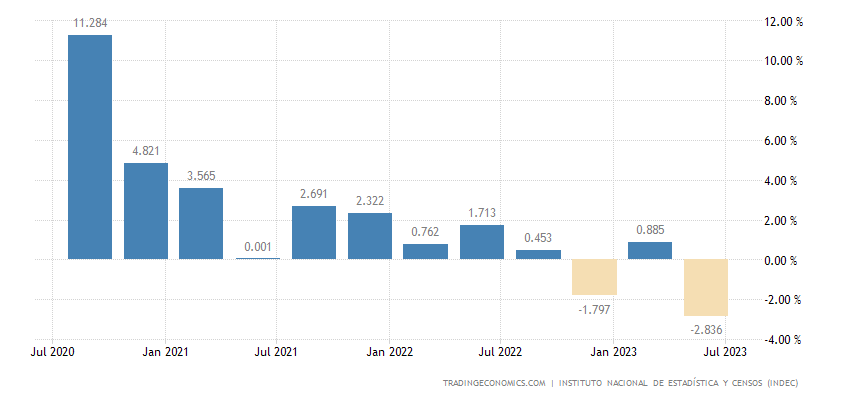
Source: Trading Economics
Bitcoin Fees Skyrocket While the Network Expands its Utility
Bitcoin’s fees have increased by 593.94% over the past month, mostly driven by Ordinals, a protocol that allows users to inscribe digital assets akin to nonfungible tokens. Ordinals have had the most inscriptions since May 2023, as shown in Figure 3. With the backdrop of Ordinals’ success rate, Bitcoin developer Robin Linus introduced BitStream, a decentralized file hosting on Bitcoin, where users can upload unique files, enabling anyone to monetize their excess bandwidth and data storage capacities without relying on trust or heavy-weight cryptography. BitStream’s pay-to-download approach allows the server to charge for each download, ensuring that the revenue scales with the popularity and demand for the media, creating a balanced and profitable ecosystem. This development is another expansion of Bitcoin’s burgeoning use cases and would onboard a diversified audience. With BitStream’s promise, Bitcoin can capture the total addressable market of data storage, which stands at at least $230B. Although BitStream’s pricing scheme is not clear yet, decentralized data storage solutions, like Filecoin and Arweave, have been proven to be a lot cheaper than Google Cloud, Amazon S3, and its other centralized peers, varying by usage, as showcased extensively in the tenth issue of our State of Crypto, which you can find here.
Figure 3: Fees from Ordinals and non-Ordinals (%)
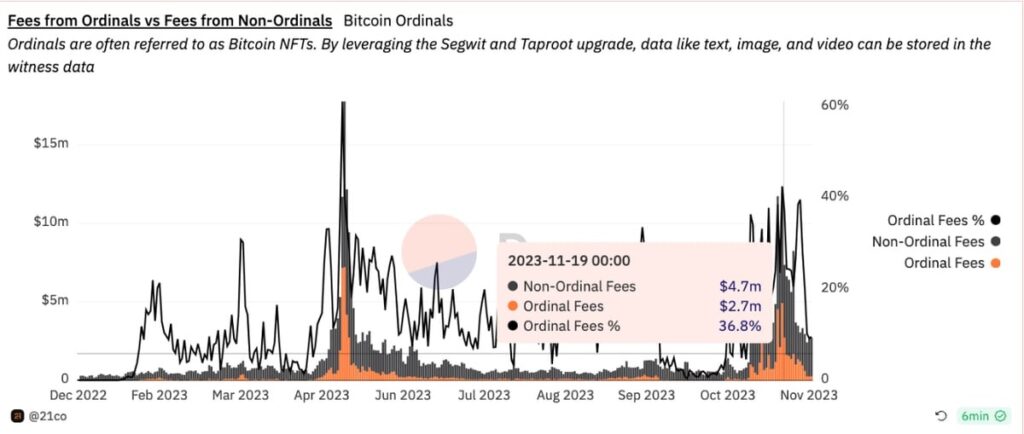
Source: 21.co on Dune Analytics
Exchanges Looking at Polygon for Deploying their Own Custom Blockchain
Kraken and OKX are strategically eyeing the Polygon network, aiming to capitalize on its CDK framework for constructing their individual blockchains. This strategic move aligns with Coinbase Base’s remarkable success, amassing approximately $5.4M in profit since inception, translating to an annualized profit of around $20 million. Boasting 9M and 50M monthly users, respectively, Kraken and OKX processed a daily average of ~$1B in 2023 and would potentially foster substantial growth within the on-chain ecosystem. Both moves would contribute to Ethereum’s revenue via anchored networks paying security costs to settle their transactions. Additionally, leveraging CDK modules proves advantageous for Polygon, empowering network stakers to bond POL and enhance earnings amid escalating network usage — a positive demand loop for the POL token within the new Polygon 2.0 staking layer design. Notably, Polygon’s efforts to onboard diverse companies are gaining traction, surpassing BNB and Ethereum in supporting new applications (Figure 4).
Figure 4: Total number of new applications on the five leading Smart-Contract Platforms
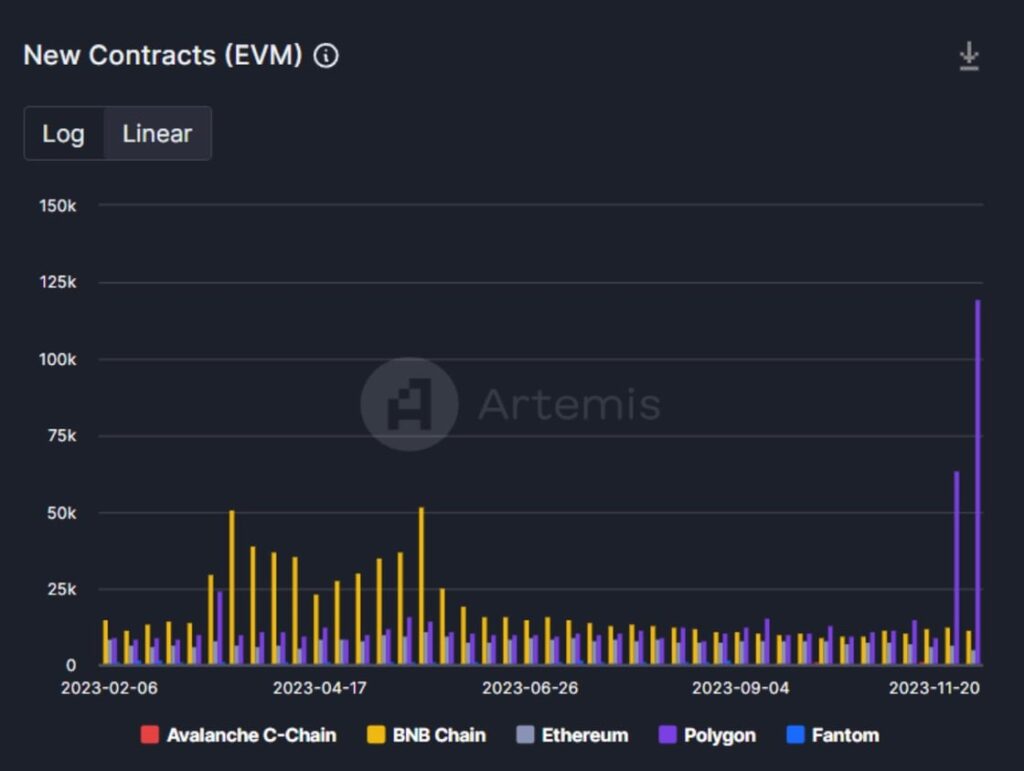
Source: Artemis
Avalanche Aiming to Position themselves as the Platform for Financial Institutions
For instance, Citibank and Fidelity unveiled a foreign FX exchange solution operating on a private permissioned Avalanche Subnet to enable instantaneous settlement and cost-effectiveness. Further, JP Morgan and Apollo Global collaborated on an asset-agnostic portfolio management solution. The latter empowers fund managers to tokenize portfolios using JP Morgan’s ONYX and the Oasis Pro asset-issuing platform while leveraging multiple crypto interoperability protocols to seamlessly exchange and rebalance portfolios across various blockchains, bridging EVM and non-EVM, private and public chains.
The experiment demonstrated the power of smart contracts in automating over +3000 operational steps and reduced costs by almost 20% via programmatic settlement despite involving multiple parties in the asset management process. The experiment also demonstrated the benefits of interoperability, providing a holistic solution for managing traditional and alternative assets in a single discretionary portfolio spanning multiple asset classes.
Both initiatives underscore Avalanche’s unique value proposition, positioning it as a standout choice among smart contract platforms. The Evergreen subnets, designed for compliance with KYC and AML checks, offer native privacy and customizability, providing enterprise-level blockchain support without the constraints of a siloed private blockchain system. The model also facilitates a pioneering connection between traditional finance’s proprietary software and native crypto railways, potentially fostering synergies and accelerating ecosystem integration. Ultimately, despite the initial surge in Avalanche’s transaction volume following these integrations, reaching its peak since inception, as illustrated in Figure 5, the network activity sharply declined after that. This underscores the imperative for the network to intensify its initiatives in onboarding high-demand projects as subnets.
Figure 5: Total number of transactions on the Avalanche Network
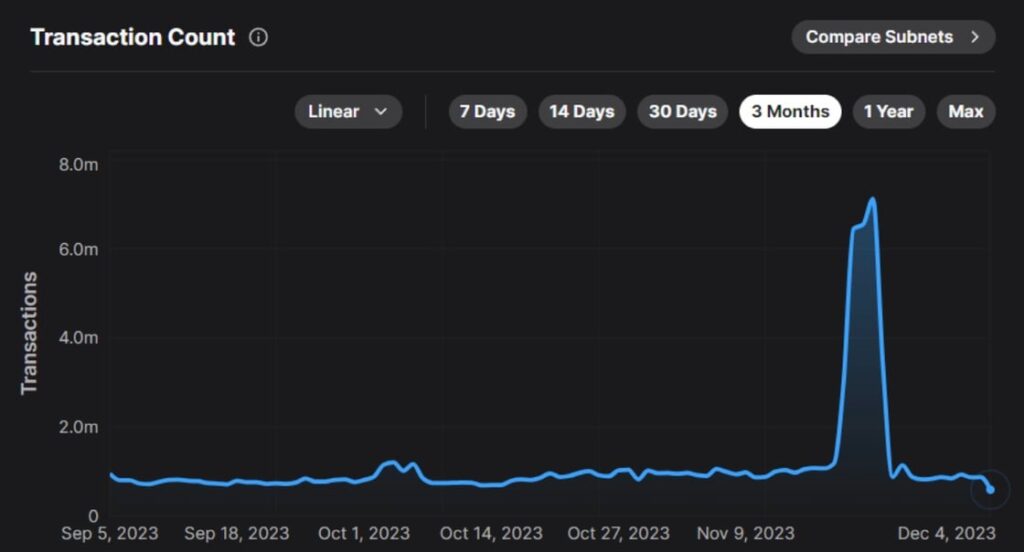
Source: Subnets.avax.network
Lido is Decentralizing its Node-Infrastructure Operations
Lido DAO, the largest non-custodial staking provider, approved two proposals to adopt Distributed Validation Technology. DVT refers to a mechanism spreading out key management and signing responsibilities across multiple parties to reduce single points of failure and increase validator resiliency. That said, Lido will integrate DVT modules with Obol and SSV protocols, which is set to introduce a more diverse profile of node operators beyond its current list of 38 validators and help address a key concern around centralization. This is a key development as Lido stirred a debate since it’s close to accounting for a third of staked ETH (see Figure 6); it could have undesired influence over the network’s validation process and block production. This implementation is crucial to ensure the diversification of the protocol’s node operators and increase their reliability in case of validator failures or censorship attempts. Conversely, SSV and Obol networks represent new primitives, so they must remain vigilant regarding any unforeseen vulnerabilities they could introduce.
Figure 6: Dominance of Entities Staking on the Ethereum Network
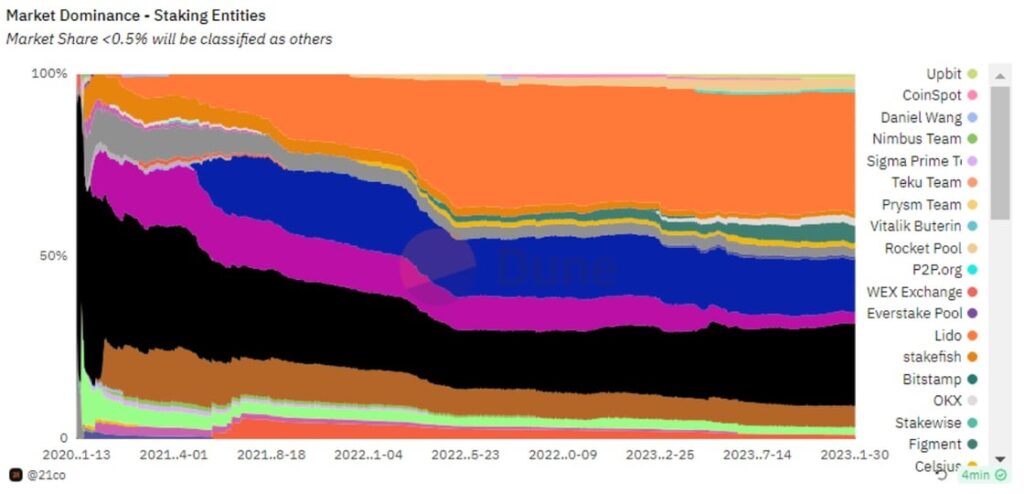
Source: 21co at Dune
What to Expect
Binance, CZ, and the softening headwinds leaning into 2024
On November 21, Binance pleaded guilty and agreed to pay over $4 billion to resolve the Justice Department’s investigation into violations related to the Bank Secrecy Act, failure to register as a money-transmitting business, and the International Emergency Economic Powers Act. Binance’s founder and CEO, Changpeng Zhao (commonly known as CZ), also pleaded guilty to failing to maintain an effective anti-money laundering program and has resigned as CEO of Binance. The world’s biggest crypto exchange by assets under management has experienced $47.3B in outflows and $44.6B in inflows in November, as seen in our Dune Analytics dashboard tracking Binance’s proof of reserves.
What should we expect in 2024? CZ could face up to 18 months in prison after his sentencing in February 2024. Binance’s new CEO Richard Teng, has outlined his vision to continue building on Web 3, with a special focus on decentralized applications that empower data ownership. With Binance’s Greenfield venturing into decentralized file storage, we can expect more investment in this space to diversify revenue streams and return Binance’s brand image to industry leadership. One catalyst for that is the fact that Teng is a member of the World Economic Forum, which can yield further institutional interest in the broader industry of decentralized finance. One challenge remains untackled: Binance’s dwindling market share, especially in derivatives. In the first weeks of November, the Chicago Mercantile Exchange (CME) toppled Binance in Bitcoin futures following speculation around a spot Bitcoin ETF in the U.S.
Figure 7: Binance Asset Flow
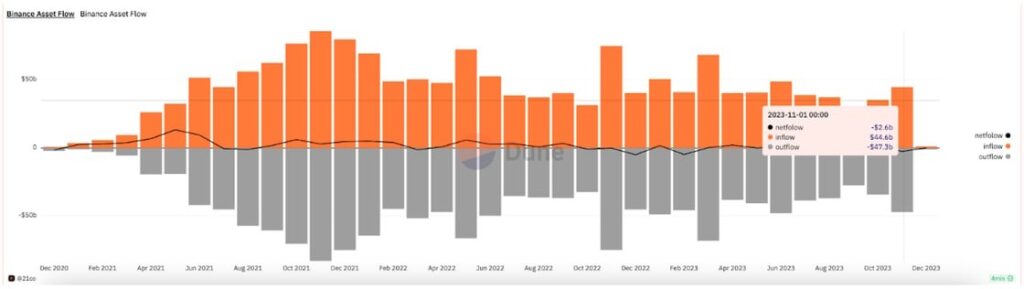
Source: 21.co on Dune Analytics
Interoperability Protocols are Rethinking Strategies to Remain Relevant
Polkadot, for instance, is replacing its long-standing parachain auction system with Bulk Coretime and Instantaneous Coretime. For context, the existing auction system is a model for applications to enter into a competitive bidding war to lease a slot on the Polkadot network as an interconnected network known as a parachain. That said, the new two models would introduce either a pay-as-you-go model where developers rent blockspace as needed for their projects or alternatively use the conventional lease model with shorter rent periods that make it more cost-effective for projects.
Polkadot’s imminent 2.0 system redesign, slated for the second half of 2024, incorporates the aforementioned modules and introduces a trustless bridge to link with the Ethereum ecosystem. These enhancements, addressing the network’s waning interoperability against competitors like Chainlink, are pivotal for Polkadot to sustain its relevance and fortify its accessibility towards more vibrant ecosystems such as Ethereum.
On the Cosmos side, the community approved a proposal to decrease the network’s inflation from 14% to 10%, reducing the staking APR from 19% to 13.4%. While the proposal addresses the challenge of ATOM’s high inflation, which dilutes the token’s value, it highlights a utility conundrum. ATOM lacks a clear role in facilitating access to the Interchain security economy powered by its InterBlockchain Communication protocol (IBC). This absence of a distinct value proposition beyond its attractive yield may prompt smaller validators to unstake, potentially leading to increased centralization and compromising IBC security.
That said, the discord led the founder to propose a hard fork of the network into ATOM1, as he argues the inflation rate cut compromises the security of the Cosmos hub due to the network’s interoperability design, which is more crucial than elevating ATOM as a sound medium of exchange currency akin to ETH. Further, Cosmos’s interoperability technology has also been exported to the Avalanche network on testnet, a significant milestone marking the first integration outside the Cosmos ecosystem and bringing crypto closer to a trustless multichain future. Finally, Cosmos is experiencing heightened chain activity, likely driven by the launch of dYdX and USDC on Cosmos and evidenced by increased fees and active users, reaching a YTD peak, as illustrated in Figure 8, which we’ll be closely monitoring over the next few weeks.
Figure 8: Growth of Active Users and Fees on the Cosmos network
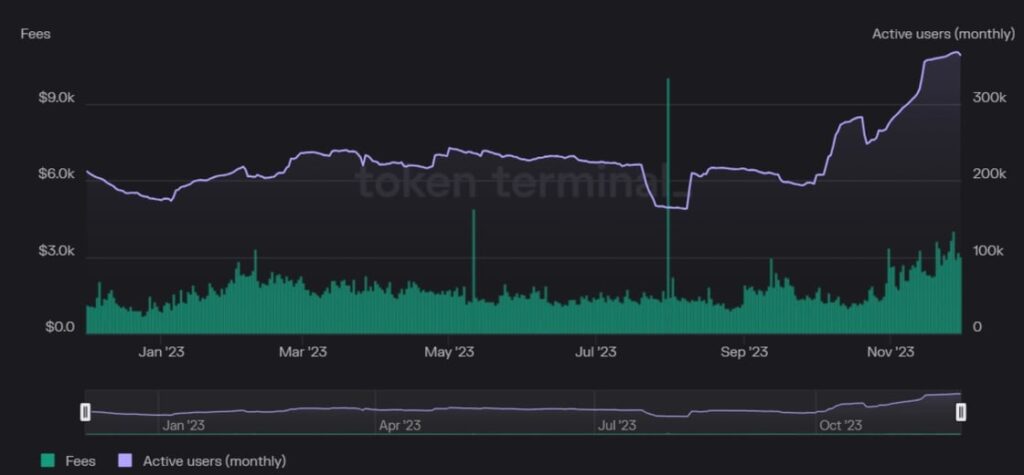
Source: Token Terminal
Bookmarks
• Get a digital copy of State of Crypto issue 10!
• Stay tuned for our Market Outlook for 2024! Join us as we share more details in our next Analyst Call.
Next Month’s Calendar
These are the top events we’re closely monitoring in December.

Source: 21shares, Forex Factory, CoinMarketCal
Research Newsletter
Each week the 21Shares Research team will publish our data-driven insights into the crypto asset world through this newsletter. Please direct any comments, questions, and words of feedback to research@21shares.com
Disclaimer
The information provided does not constitute a prospectus or other offering material and does not contain or constitute an offer to sell or a solicitation of any offer to buy securities in any jurisdiction. Some of the information published herein may contain forward-looking statements. Readers are cautioned that any such forward-looking statements are not guarantees of future performance and involve risks and uncertainties and that actual results may differ materially from those in the forward-looking statements as a result of various factors. The information contained herein may not be considered as economic, legal, tax or other advice and users are cautioned to base investment decisions or other decisions solely on the content hereof.


JP Morgan noterar tre nya ETFer på Xetra en av dem i SEK

OSYU ETF ger exponering mot Secured Overnight Financing Rate

iShares Space Technologies UCITS ETF investera bortom jorden

JIPD ETF delar ut månadsvis

Quantum computers can’t break bitcoin. Yet.

USA satsar 2 miljarder dollar på kvantdatorer – så kan investerare dra nytta av utvecklingen

De bästa ETFerna för att investera i emerging markets

Extrema skillnader: Varför presterar Europas kvantdator-ETFer så olika?

Fastställd utdelning i MONTDIV maj 2026

Varför Plus500 är en dröm för finans-affiliate
-
 Nyheter3 veckor sedan
USA satsar 2 miljarder dollar på kvantdatorer – så kan investerare dra nytta av utvecklingen
-
 Nyheter4 veckor sedan
De bästa ETFerna för att investera i emerging markets
-
 Nyheter2 veckor sedan
Extrema skillnader: Varför presterar Europas kvantdator-ETFer så olika?
-
 Nyheter3 veckor sedan
Fastställd utdelning i MONTDIV maj 2026
-
 Nyheter2 veckor sedan
Varför Plus500 är en dröm för finans-affiliate
-

 Nyheter4 veckor sedan
ASWF ETF är en aktivt förvaltad fond som investerar i Kanada
-

 Nyheter2 veckor sedan
ETFer för fotbolls-VM 2026
-

 Nyheter2 veckor sedan
QQCC ETF följer företag världen över som är aktiva inom kvantberäkning