Trots sitt namn Silver Bullet så investerar inte denna fond i fysiskt silver. Denna aktiefond försöker istället att ha en fokuserad portfölj med 25-30 innehav och hög avkastningspotential. Förvaltarna själva kallar den för Europas mest riskfyllda fond. Silver Bullet är en branschfond med inriktning mot globala ädelmetallsgruvbolag med ett särskilt fokus på överlåtbara värdepapper vars värdeutveckling påverkas av marknadsutvecklingen för silver. Fonden har en årlig förvaltningskostnad på 1,40 procent.
AuAg Silver Bullet är en relativt nylanserad fond som erbjuder en unik exponering mot silver genom investeringar i gruvbolag. Fonden har en låg samvariation med aktier, ger exponering mot en lågt värderad ädelmetall med stor industriell efterfrågan och utgör en värdebestående tillgång i din portfölj. Med AuAg Silver Bullet erhålls en bred exponering mot vad AuAg Fonder anser vara världens mest intressanta investering de kommande tio till tjugo åren.
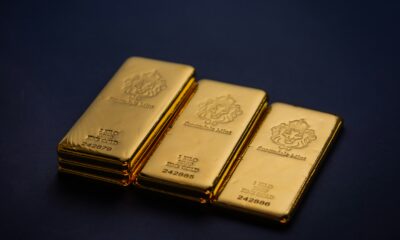
Silver [Ag] är en ädelmetall med hög motståndskraft mot korrosion och oxidation och har den bästa termiska och elektriska ledningsförmågan av alla metaller vilket gör den oumbärlig i vår högteknologiska och gröna värld. Det har också antibakteriella egenskaper som gör det användbart inom medicin, rening av vatten samt andra konsumentprodukter.
Ädelmetaller nådde sin tidigare All Time High under 2011 efterföljt av en björnmarknad. Under 2020 fick vi ett nytt ATH i guld, och förhållandet mellan silverpriset och guldpriset har blivit lägre. Nu är ration runt 60:1 och den naturliga förekomsten är 16:1, vilket den teoretiskt bör gå mot. Det finns i dag inga reservlager av silver vilket leder till en fysisk brist och en potentiell prisökning. Silver är ofta bara en bi-produkt för de största gruvbolagen vilket kan ge förutsättningarna till ett perfekt läge för fokuserade silvergruvbolag.
Varför kallas den för Europas mest riskfyllda fond?
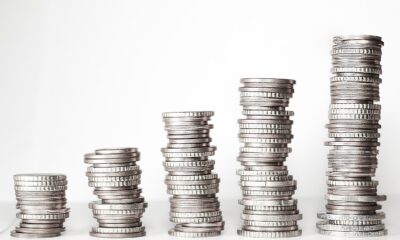
Förvaltarna, AuAg Fonder, kallar fonden för Sveriges kanske mest riskfyllda då den har Riskklass 7, vilket är den högsta risknivån. Det är normalt sett bara hävstångsfonder som har denna riskklass. Fonden är att betrakta som en högriskinvestering då gruvbolagens aktier vanligtvis svänger mer än den underliggande råvaran silver. Samtidigt har uppsidan, jämfört med att köpa en direkt exponering mot metallen, också varit större.
Samtidigt ska den ses i ljuset av vad den kan bidra med i en portfölj. Genom att addera en fond med låg samvariation med dina vanliga aktiefonder sänks totalrisken. Historiskt har en exponering mot silver utvecklats väl under perioder av breda och långvariga aktiefall. Efter tio års uppgång på aktiemarknaden står vi sannolikt inför en miljö där risktillgångar kommer få svårare få det svårare att skapa avkastning. Därutöver är skyddet från obligationsinnehav inte vad de har varit mot bakgrund av rekordlåga räntor. Guld och i synnerhet silver utgör då viktiga komplement i en väldiversifierad portfölj.
Lanserar en guldfond i juni 2021
AuAg Fonder kommer under juni 2021 att lansera en guldfond, The ESG Gold Mining ETF (ESGO) som kommer att handlas på London Stock Exchange, tyska Xetra och Milanobörsen. Temat för denna börshandlade fond kommer att vara guld istället för silver, men i övrigt påminner de mycket om varandra.
Handla AuAg Silver Bullet
AuAg Silver Bullet är tillgänglig på samtliga stora fondplattformar, till exempel Fondo, Avanza, Nordnet och SAVR.
Aktier med låg volatilitet tenderar att ge en överavkastning jämfört med den risk som tas. Denna forskningsbaserade observation kallas lågvolatilitetsfaktorn vilket gynnat uppkomsten av lågvolatilitets ETFer.
Det finns olika möjliga förklaringar till detta: Till exempel kan aktier med låg volatilitet uppfattas som mindre givande av investerare då de är förknippade med mindre risk. En annan teori tyder på att investerare generellt överskattar sin förmåga att prognostisera. För särskilt volatila aktier finns en större oenighet mellan investerare, vilket bör leda till högre volatilitet och lägre avkastning.
Denna faktorstrategi kan även implementeras med hjälp av ett index. I den här investeringsguiden hittar du alla tillgängliga globala ETF:er med låg volatilitet. För närvarande finns det fem index som spåras av åtta olika ETFer tillgängliga. Den årliga förvaltningskostnaden för dessa börshandlade fonder ligger på mellan 0,25 och 0,30 procent.
En jämförelse av olika lågvolatilitets ETFer
Förutom avkastning finns det ytterligare viktiga faktorer att tänka på när du väljer lågvolatilitets-ETFer. För att ge ett bra beslutsunderlag hittar du en lista över olika lågvolatilitets -ETFer med information om kortnamn, kostnad, utdelningspolicy, fondens hemvist och replikeringsmetod.
För ytterligare information om respektive börshandlad fond, klicka på kortnamnet i tabellen nedan.
Amundi MSCI World IMI Value Screened Factor UCITSETFUCITSETFAcc (WMMS ETF) med ISIN IE000AZV0AS3, försöker spåra MSCI World IMI Value Select ESG Low Carbon Target-index. MSCI World IMI Value Select ESG Low Carbon Target-index spårar aktier från utvecklade länder över hela världen som väljs ut enligt värdefaktorstrategin och ESG-kriterier (miljö, social och företagsstyrning). Indexet har som mål att minska utsläppen av växthusgaser och ett förbättrat ESG-poäng jämfört med jämförelseindex. Jämförelseindexet är MSCI World IMI.
Den börshandlade fondens TER (total cost ratio) uppgår till 0,25 % p.a. Amundi MSCI World IMI Value Screened Factor UCITSETFUCITSETFAcc är den enda ETF som följer MSCI World IMI Value Select ESG Low Carbon Target-index. ETFen replikerar det underliggande indexets prestanda genom fullständig replikering (köper alla indexbeståndsdelar). Utdelningarna i ETF:n ackumuleras och återinvesteras.
Denna ETF lanserades den 30 oktober 2024 och har sin hemvist i Irland.
Investeringsmål
Amundi MSCI World IMI Value Screened Factor UCITSETFAcc försöker replikera, så nära som möjligt, oavsett om trenden är stigande eller fallande, resultatet för MSCI World IMI Value Select ESG Low Carbon Target Index (”Indexet”). Delfondens mål är att uppnå en tracking error-nivå för delfonden och dess index som normalt inte överstiger 1 %
Det betyder att det går att handla andelar i denna ETF genom de flesta svenska banker och Internetmäklare, till exempel DEGIRO, Nordnet, Aktieinvest och Avanza.
The iShares 20+ Year Treasury Bond ETF (TLT) holds US government bonds that mature in 20 years or more. Since peaking in March 2020 at $179.90 per share, TLT’s price is still down roughly 50%. Most of that drop happened as US inflation – and then interest rates – rose to multi-decade highs. But with inflation now below 3%, potential interest rate cuts ahead, and an interesting chart setup, the investment case for TLT could be building.
What is TLT?
The iShares 20+ Year Treasury Bond ETF (TLT) is an exchange-traded fund (ETF) that trades on the US stock market. The fund holds “long-dated” US government bonds with maturities of 20 years or more. By holding a basket of them, TLT reflects how investors generally value this part of the bond market.
Each bond in TLT is a 20-plus year loan to the US government. The investor lends money, and in return receives fixed interest payments (coupons) each year. The government sets the coupon rate when it issues (creates) a new bond, and that rate never changes. After issuance, the bond can trade on the bond market, where its price may move up or down.
What affects the value of long-dated US Treasury bonds (and TLT)?
All else being equal, long-dated Treasury bonds tend to be more volatile than shorter-dated ones. Interest rates and inflation expectations are the two main levers that can move their prices – and hence the price of TLT.
Interest rates: When rates rise, newly issued bonds pay higher coupons. Older bonds in TLT can then look relatively less attractive, so their prices may fall. When rates fall, it’s the opposite: new bonds pay lower coupons, so older bonds look “better” and may rise in price. Because TLT only holds long-dated bonds, its price tends to react more to interest rate changes than short-term bond funds. Rate shifts tend to have a bigger impact on long-dated bonds because their fixed coupons extend far into the future. Even a small change in yields can make those older coupons look much better – or much worse – for a very long time.
Inflation expectations: When investors expect higher inflation in the future, the fixed coupons (and principal) in TLT can look less valuable in today’s money. That perception can push bond prices down as investors sell bonds. And when investors think futureinflation will be lower, the same coupons can look more valuable today, which may support bond prices. Because TLT’s bonds mature further into the future, inflation has more time to erode their interest and principal repayments. That’s why long-dated bonds are usually more sensitive to inflation than shorter-dated ones.
The chart below compares the price of TLT (orange) with US interest rates (black) and US inflation (blue). It’s not an exact science, but TLT has tended to move opposite to both of them since the ETF launched in 2003.
Other factors can also play a role. The US government regularly issues (creates) new bonds, and if supply goes up, prices can fall. On the demand side, big buyers like pension funds, insurance companies, or foreign central banks can move the market. Credit risk perception is also key. Investors usually see Treasuries as very low risk, but not “risk-free”. So if they lose confidence in the US government’s repayment ability, it could hurt bond prices.
The investment case for TLT today
We’ve explained how lower interest rates and lower inflation might be a better environment for long-dated US treasury bonds. As explained below, there are reasons to believe we could be moving into that environment now.
The US Federal Reserve (Fed) essentially has two jobs, and it’s a constant balancing act between the two:
Keep inflation down (by raising interest rates to slow the economy).
Keep employment high (by lowering interest rates to speed up the economy).
US inflation peaked above 9% in June 2022, and it’s been trending lower ever since. Inflation isn’t very low yet (2.9% CPI as of August) – but it’s low enough for the Fed to focus more on job number two. Factor in a slowing economy, and the Fed is more likely to cut interest rates from here to boost employment numbers.
The chart below shows the US unemployment rate in orange. It’s now at 4.3% (August) – the highest unemployment rate since November 2021. In the past, unemployment rose gradually at first, before eventually breaking much higher. If that pattern repeats, we could see a bigger spike in unemployment.
Not only is the unemployment rate rising, but the number of new job openings is dropping, too. US nonfarm payrolls (new jobs excluding farming, private households, non-profits, and the military) showed that the US economy added just 22,000 new jobs in August.
And to make matters worse, the government also revised its earlier estimates down. The adjustment meant the US added around 911,000 fewer jobs in the year through March 2025 than first reported.
AI could also factor into these numbers. After all, companies are rolling out AI tech to improve productivity – and that puts pressure on the “human” job market. AI can also make goods and services cheaper to produce, which is inherently disinflationary (the opposite of inflation).
This setup could give the Fed more ammo for bigger rate cuts in the future. Throw in lower inflation, and we could see a solid backdrop for TLT.
The technical picture for TLT
Not many assets are trading near 20-year lows. But as the chart below shows, TLT is trading near technical “support” from the early 2000s (orange). Also note that TLT recently broke above a downward sloping trendline that’s been in play since December 2021. This may signal that selling pressure is easing, and buyers are stepping in.
The chart below shows Bollinger Bands around TLT’s price. Here, the middle band is TLT’s 20-month average price, and each red or green candle represents one month of price movement for TLT.
The further the outer bands are from the middle band, the more volatile TLT’s price, according to the indicator. At this point, the Bollinger Bands are pinching together – a sign of relatively low volatility for TLT. Volatility tends to be “mean reverting” – meaning it usually cycles from periods of lower volatility to higher volatility. If the bands now start to widen, and the price trends higher, we could see a sustained rally for TLT.
The next chart zooms into the weekly timeframe, where each red or green candle represents one week of price movement for TLT. In this case, the Bollinger band width represents the volatility of TLT around its 20-week moving average. The blue line underneath it shows the width of the Bollinger Bands – lower is narrower, and less volatility.
Last month, the Bollinger Bands reached their narrowest level since September 2018. In other words, TLT’s volatility reached its lowest level in seven years, according to the indicator. Now notice how the bands started expanding this month – from that very low volatility base. This suggests TLT could see more volatility going into the end of 2025. Keep in mind that volatility is direction neutral.
Risks
The investment case for TLT depends heavily on inflation staying low and the Fed being willing to cut rates. If inflation rises again, TLT may fall further. Heavy government borrowing could also pressure Treasuries if investors demand more compensation to buy the debt. And if the economy holds up better than expected, the Fed might not need to cut rates.