
Nyheter
All-Time Highs, Dramatic Gas Reduction, and Tokenization
• Dramatic Gas Reduction, Significant Gas Fee Cuts for Ethereum Scaling Solutions and Real-World Asset Tokenization
• Bitcoin Regains its $70K Amid Optimistic Macroeconomic Outlook
• Solana’s “Meme Coin” Frenzy Is More Than Meets the Eye
Bitcoin Regains its $70K Amid Optimistic Macroeconomic Outlook
The US economy continues to slowly be brought back into balance, resulting in the Federal Reserve’s recent dovish tone. During the last FOMC meeting on March 20, Fed Chair Jerome Powell seemed confident, saying that the economy has made considerable progress. GDP grew more than expected by 3.4% over the last quarter of 2023, up from last quarter’s 3.2%. Moreover, the labor market rebounded with resilience as job competition eased amid improving inflation rates. Unemployment declined more than expected in the week ending March 23. There were 210K individuals who filed for unemployment insurance, down from the previous week’s revised level of 212K.
Further, Fed officials are considering slowing the pace of balance sheet reduction. So far, the Fed’s balance sheet has been reduced by over $1.5T since quantitative tightening started in June 2022. Slowing down the pace of runoff will contribute to a smoother transition, minimizing the risk of financial market stress. This will support the gradual decline in the Fed’s securities holdings, aligning with the goal of achieving an appropriate level of ample reserves. We should know more as early as May 1, when the Fed chair is expected to release an updated Balance Sheet Normalization Principles and Plans during the next FOMC meeting.
Figure 1: Flows of U.S. Bitcoin Spot ETF
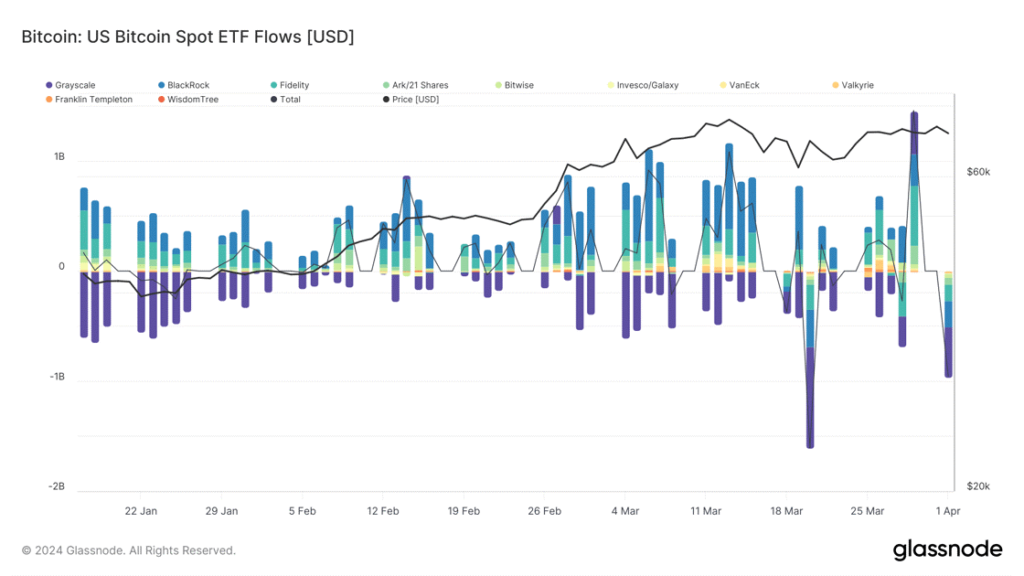
Source: Glassnode
This could pave the way for a rate cut announcement in June, with forecasts of three cuts this year. A rate cut would bode well for risk-on assets like Bitcoin, which saw a monthly return of 14% in March while helping the asset to hit a record seven-month win-streak. In that view, while the U.S. spot exchange-traded funds (ETFs) saw record outflows of $1.6B on March 20th, they ended the month with record inflows of $1.45B on March 29, as shown in Figure 1. In fact, Bitcoin is seeing more institutional appetite from new participants like wealth manager Cetera, which has added four Bitcoin spot ETFs to its platform for financial professionals. With more than $475B in assets under administration and $190B in assets under management, Cetera’s move is just the tip of the iceberg of Bitcoin’s growing institutional adoption. The world’s largest pension fund, the Government Pension Investment Fund (GPIF) of Japan, is also looking to expand its portfolio beyond the illiquid assets it already invests in. While there is no guarantee the GPIF would actually invest in Bitcoin or any other cryptoasset for that matter, the interest of a trillion-dollar pension fund in Bitcoin is a strong enough indicator of the investor appetite yet to be unlocked.
Finally, the countdown has begun. Arguably the industry’s most anticipated event, Bitcoin’s halving is less than three weeks away. While we might see fluctuation in price movement in the run-up, demand for Bitcoin is expected to outpace its supply post-halving, exemplifying its scarcity and underlying value. April is also a seasonally good month for stock market gains and even more so for crypto. Read our report to find more insights on the halving event.
Significant Gas Fee Cuts for Ethereum Scaling Solutions and Real-World Asset Tokenization
Ethereum’s much-anticipated Dencun upgrade was successfully deployed on March 13. The upgrade introduced “blobs,” a novel method for storing scaling solutions or layer 2 (L2) transactions on Ethereum, aimed at substantially reducing their gas fees. Although the upgrade doesn’t directly resolve Ethereum’s elevated fees, it alleviates the costs for L2s built on top of it, such as Arbitrum, Optimism, and Base, by leveraging blobs. It’s important to remember that while the upgrade may initially reduce Ethereum’s revenue, it has already doubled the number of people transacting on L2 solutions, which yields a net positive impact on Ethereum’s revenue streams. That said, most L2s witnessed a dramatic reduction in transaction costs, with some experiencing drops of over 90% following the upgrade. However, networks with heightened demand, such as Base, have seen transaction costs rebound, surging by more than 230% two weeks after Dencun’s activation, as shown below in Figure 2.
In line with this, the growing trend suggests that if demand for blobs surpasses their storage or processing capacity, which can be tracked here, the soaring activity could push L2 fees even further. Nonetheless, it’s worth noting that third-party Data Availability solutions such as Celestia, which acts as a separate cheaper data storage layer for L2 solutions, can be instrumental in further reducing their transaction costs. Since Celestia has already integrated with Arbitrum and Optimism, we anticipate its growing importance as Modularity establishes itself as a novel scaling solution to complement the Ethereum ecosystem. This becomes especially pertinent as networks operating on top of Arbitrum and Optimism start leveraging Celestia’s capabilities in the medium term.
Figure 2: ETH Scaling Solutions (L2s) Average Transaction Costs
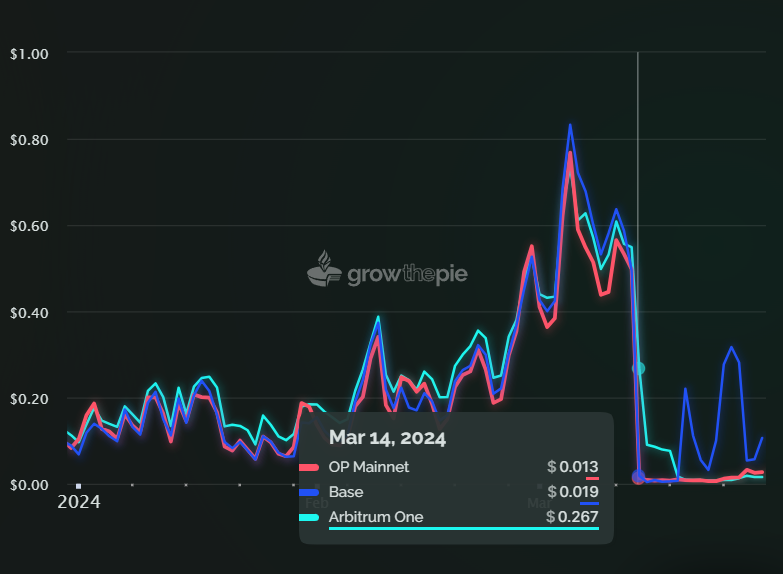
Source: GrowThePie
Beyond the technical advancements, the biggest news for Ethereum was arguably BlackRock’s announcement of tokenizing treasury bonds and repo agreements. The asset manager has partnered with Securitize as a transfer agent and tokenization platform to launch their yield-bearing fund, BUIDL, on top of Ethereum. As shown in Figure 3, Ethereum accounts for 80.33% of tokenized assets if we exclude fiat-collateralized stablecoins. BlackRock has joined the likes of Franklin Templeton and Citigroup, among others, in tokenizing real-world assets. The deployment on Ethereum reiterates our thesis that the network will continue playing a vital role across the tokenization realm. So far, there has been a total of over $2B worth of commodities and government securities, among other traditional assets, tokenized on several networks. Thanks to blockchain technology, these tokenized assets boast several advantages over their traditional form due to their transparency, around-the-clock trading, and faster settlement.
Figure 3: Tokenization Market Share by Chain (Excl. Stablecoins)
Source: 21.co on Dune Analytics
Solana’s “Meme Coin” Frenzy Is More Than Meets the Eye
The recent market rally driven by BTC, has led to a surge in user activity on the Solana network, reaching its highest levels in two years. While this surge is primarily fueled by a frenzy surrounding meme coins like WIF and politically themed tokens such as Tremp and Boden, it highlights a growing preference for Solana among new and retail users who find Ethereum’s high costs prohibitive. While the recent Dencun upgrade has already adjusted this reality for Ethereum’s L2s, transaction costs on Solana still remain significantly lower at a fraction of the cent, as shown below in Figure 4, attracting a large influx of new users.
Figure 4: Average Transaction Costs
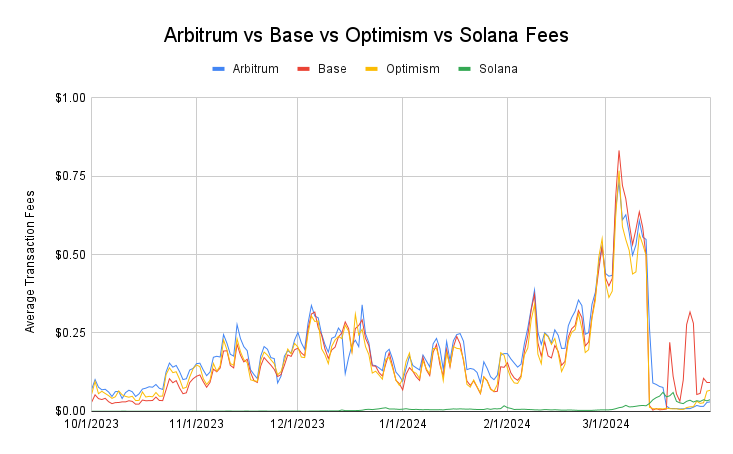
Source: Dune, GrowThePie
For example, Solana saw a new monthly all-time high of 28M new users joining in March, compared to a monthly average of 11M during the heightened activity of the LUNA collapse in 2022. Additionally, daily active users have surged to 1.4M, approaching 2021 levels of 2M. Concurrently, the network is on track to process double the peak transactional volume witnessed in 2021, with February recording $100T and March surging to settle at $140T, surpassing the previous peak of $55T recorded in November 2021. Thus, with minimal transaction fees and a plethora of new tokens—peaking at over 9,000 launched daily, as shown below in Figure 5 — it provides a clearer explanation for SOL’s soaring demand.
Users are rushing to purchase the token to access the network’s thriving on-chain ecosystem, which in turn amplifies the demand for the token in a self-reinforcing cycle. That is reminiscent of the ETH’s demand during the Ethereum ICO craze of 2017. Finally, the recent speculation has propelled Solana’s market cap, not price, to break its ATH reaching $90B. This surge can explain why the network’s decentralized exchanges are logging five times the total volume seen at the end of the last bull cycle. Notably, these exchanges have surpassed established platforms like Uniswap V3 on Ethereum, reaching a new milestone of hitting $60B in monthly volume.
Figure 5: Total Number of New Solana-Based Tokens (SPL) Created on a Daily Basis
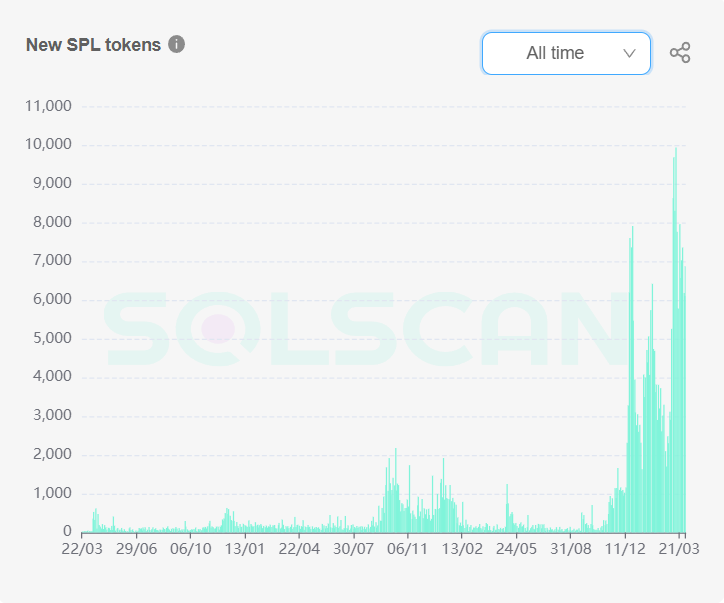
Source: Solscan
Next Month’s Calendar
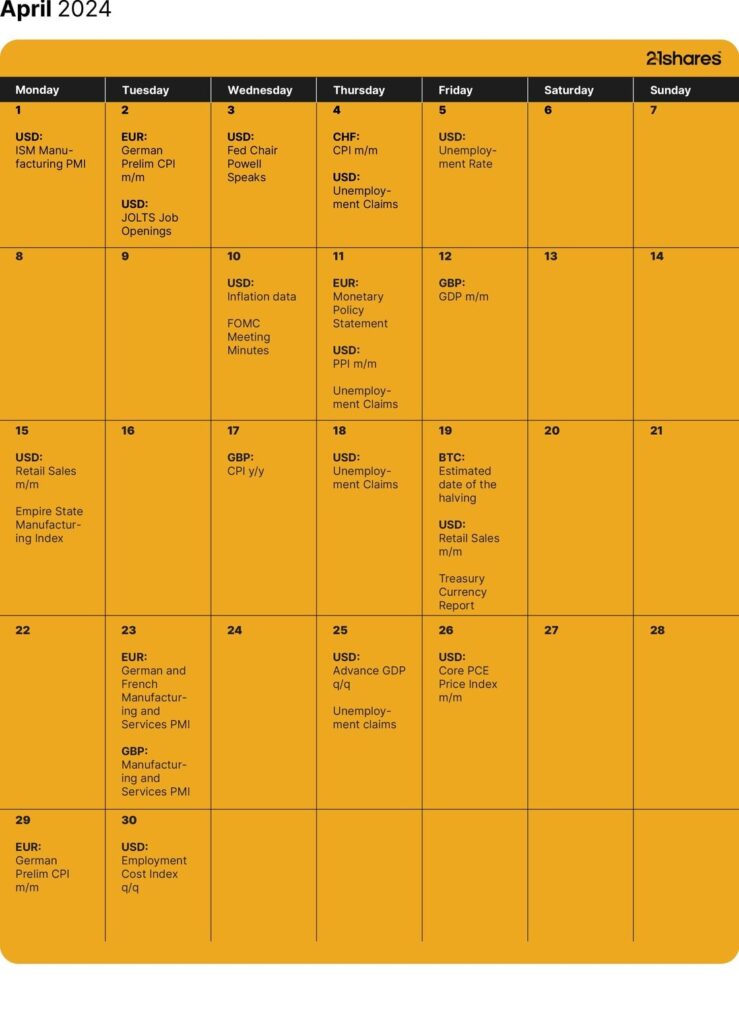
Source: Forex Factory, 21Shares
Research Newsletter
Each week the 21Shares Research team will publish our data-driven insights into the crypto asset world through this newsletter. Please direct any comments, questions, and words of feedback to research@21shares.com
Disclaimer
The information provided does not constitute a prospectus or other offering material and does not contain or constitute an offer to sell or a solicitation of any offer to buy securities in any jurisdiction. Some of the information published herein may contain forward-looking statements. Readers are cautioned that any such forward-looking statements are not guarantees of future performance and involve risks and uncertainties and that actual results may differ materially from those in the forward-looking statements as a result of various factors. The information contained herein may not be considered as economic, legal, tax or other advice and users are cautioned to base investment decisions or other decisions solely on the content hereof.


iShares Space Technologies UCITS ETF investera bortom jorden

JIPD ETF delar ut månadsvis

Quantum computers can’t break bitcoin. Yet.

MMAX ETF är en globalfond

SICE ETF köper investment grade företagsobligationer från hela världen

USA satsar 2 miljarder dollar på kvantdatorer – så kan investerare dra nytta av utvecklingen

De bästa ETFerna för att investera i emerging markets

Extrema skillnader: Varför presterar Europas kvantdator-ETFer så olika?

Fastställd utdelning i MONTDIV maj 2026

Varför Plus500 är en dröm för finans-affiliate
-
 Nyheter3 veckor sedan
USA satsar 2 miljarder dollar på kvantdatorer – så kan investerare dra nytta av utvecklingen
-
 Nyheter4 veckor sedan
De bästa ETFerna för att investera i emerging markets
-
 Nyheter1 vecka sedan
Extrema skillnader: Varför presterar Europas kvantdator-ETFer så olika?
-
 Nyheter3 veckor sedan
Fastställd utdelning i MONTDIV maj 2026
-
 Nyheter2 veckor sedan
Varför Plus500 är en dröm för finans-affiliate
-

 Nyheter4 veckor sedan
ASWF ETF är en aktivt förvaltad fond som investerar i Kanada
-

 Nyheter2 veckor sedan
21shares produkter nu finns tillgängliga hos Revolut
-

 Nyheter2 veckor sedan
QQCC ETF följer företag världen över som är aktiva inom kvantberäkning