Följ oss

Nyheter

All-Time High Season⬆: What Happened in Crypto This Week?

Publicerad

den

Bitcoin above $70K while inflation remains sticky Ethereum’s Dencun Upgrade went live Arbitrum about to experience a massive token unlock event

• Bitcoin above $70K while inflation remains sticky

• Ethereum’s Dencun Upgrade went live

• Arbitrum about to experience a massive token unlock event

Bitcoin above $70K, while inflation remains sticky

Bitcoin doesn’t seem to stop and keeps on reaching higher. On March 11 the biggest crypto asset jumped above the $70K mark and has maintained above it since the time of writing. The main driver continues to be the US Bitcoin Spot ETFs, which experienced record inflows of more than $1 billion on March 12. The “newborn” nine now accumulated more than 400K BTC, double the post-halving issuance of Bitcoin (~165K BTC). If this accumulation persists, a potential supply squeeze is still in play. Additionally, fundamentals also continue to be strong for Bitcoin. Last week, a Bitcoin Ordinal was sold for 17 BTC on Magic Eden, the leading NFT marketplace that has recently launched its multi-chain wallet supporting Solana, Bitcoin, Polygon, and Ethereum. Thanks to its early adoption of Bitcoin Ordinals, Magic Eden has increased in market share to over 35% in daily volumes, toppling Blur and OpenSea. However, attention should be given to Bitcoin’s open interest in futures and perpetual swaps, which remain high. As speculators and leverage traders flock to the market, we might see increased volatility in the short term.

Looking at macro data, consumer prices (CPI) rose by 0.4% in February and 3.2% over the past year, slightly hotter than expectations. Core inflation, which leaves out volatile food and energy prices, was also 0.4% over the month and 3.8% over the last year. Living conditions in the U.S. are becoming more expensive, as costs for shelter, airline tickets, and gasoline, among others, have increased in February. All eyes are on the upcoming FOMC meeting on March 20, which is expected to shed light on the Federal Reserve’s approach to potential rate cuts. According to the CME FedWatch Tool, market participants still anticipate an initial rate cut of 25 basis points (bps) by June. Despite the inflation data, over the past 5 days, markets seemed unfazed, with the S&P 500 and Nasdaq climbing by 0.64% and 0.19%, respectively.

Figure 1: US Bitcoin ETF Flows
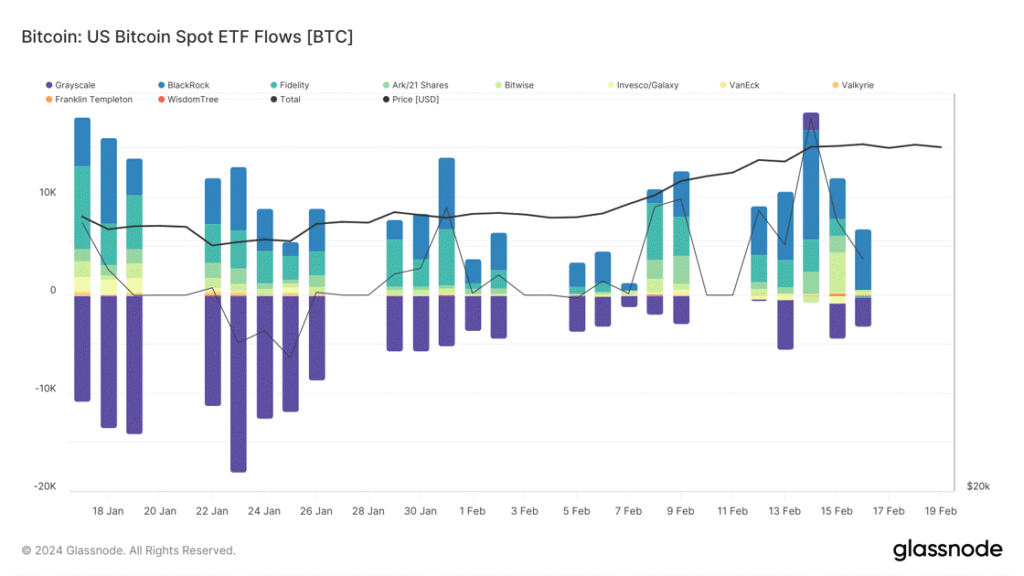
Source: Glassnode

Dencun is live!

Ethereum’s eagerly anticipated ”Dencun” upgrade was activated on Wednesday, paving the way for a significant reduction in the costs associated with using Layer 2 rollups like Arbitrum, Optimism, and Starknet. Thanks to the Dencun upgrade, these costs are expected to decrease by as much as ten times. However, to fully realize these benefits, rollups need to undergo their own updates. The teams behind Arbitrum and Optimism, the two leading rollups, are set to implement these necessary changes on Thursday. This upgrade represents a significant leap forward for Ethereum, which has often been criticized for its slow speeds and high costs, despite aspirations for it to become a ”world computer” that underpins a new era of crypto-based financial services, social networks, and beyond. It’s important to note that while the upgrade improves transaction fees on Layer 2 platforms, it doesn’t directly affect gas fees on the Ethereum mainnet. Although the price of ETH and other Layer 2 solutions has not shown significant movement over the last 24 hours, they have experienced substantial price appreciation in the 30 days leading up to the event. This increase can be partially attributed to the surge in Bitcoin prices and speculation regarding a potential Ethereum ETF, as well as anticipation of this significant event.

Figure 2: Monthly performance of ETH and its leading scalability solution

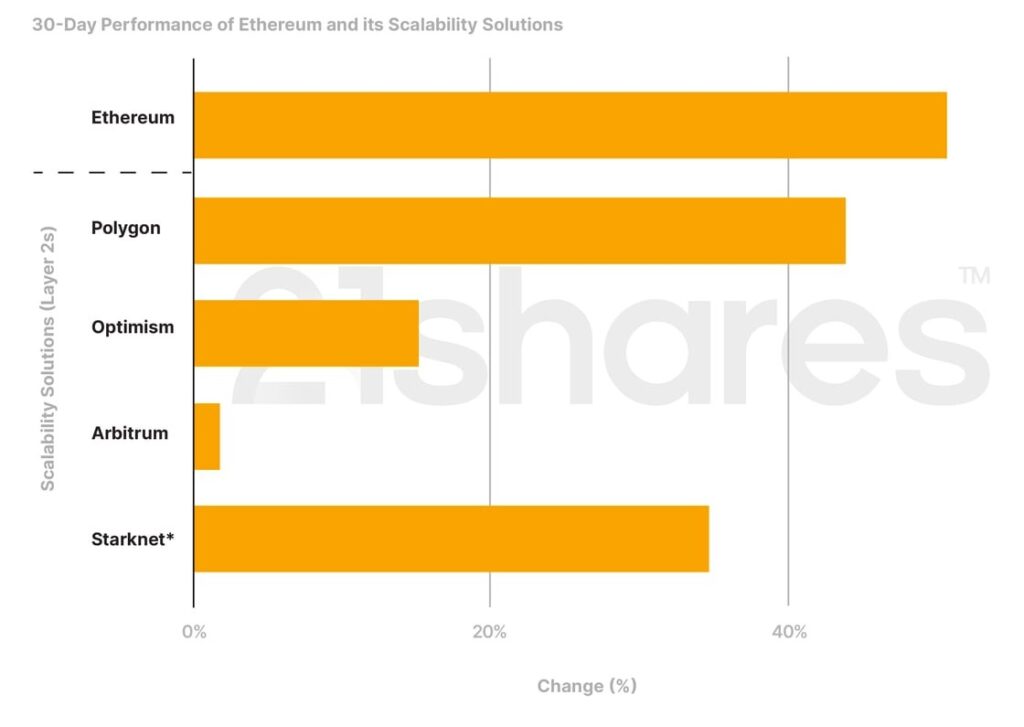
Source: 21Shares, Coingecko (Note: Starknet launched its token on February 20, 2024)

Arbitrum Token Unlock Event

On March 16, Arbitrum plans to release 1.1 billion tokens into circulation, which means over $2 billion worth of vested ARB tokens would be added to the circulating supply. Investors should be aware that the unlock represents a 76.6% increase in the circulating supply of Arbitrum and may lead to selling pressure. However, given that the token unlock is timed closely to Ethereum’s Dencun upgrade and taking into account the current momentum in the market, the demand for ARB could rise, potentially minimizing the impact of the token release. Despite the potential market impact of ARB’s token unlock, users have persistently injected capital into the Arbitrum network, propelling it to achieve an all-time high (ATH) of $3.67 billion in AuM. Notably, it grew by close to 8% over the last week, demonstrating strong confidence in its ecosystem, in contrast to Optimism, which grew by only 0.7% over the same period.

Alternatively, on March 7, the Optimism Foundation sold $90M worth of OP in a private token sale, subject to a two-year lockup. During the lock-up period, the unidentified buyer will be able to delegate the tokens to unaffiliated third parties for governance participation. As previously noted, solutions like Arbitrum and Optimism must upgrade their networks to leverage the advantages of the Dencun upgrade. Thus, it will be intriguing to observe the extent of cost reductions and the onboarding of more users, propelling their adoption in the coming months.

Figure 3: Breakdown of ARB Token Allocation During the Unlock Event

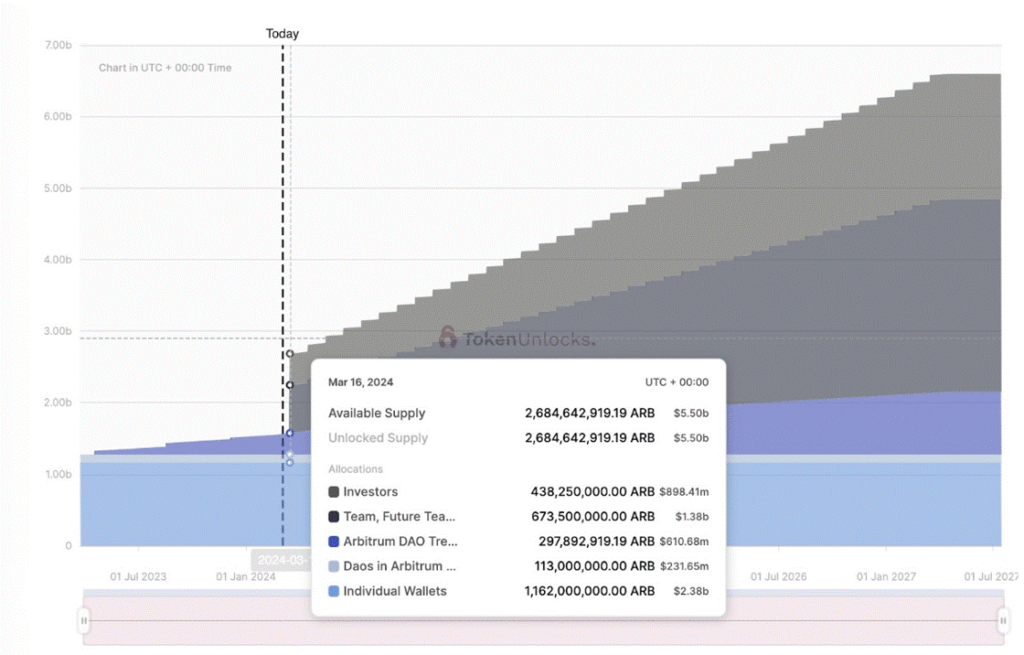
Source: Token Unlocks

This Week’s Calendar

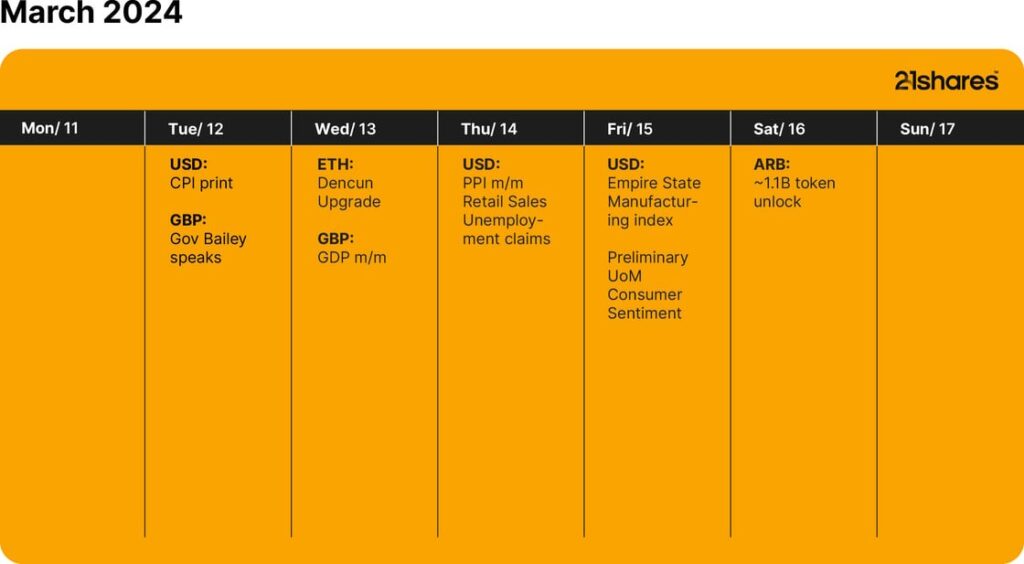
Source: Forex Factory, 21Shares

Research Newsletter

Each week the 21Shares Research team will publish our data-driven insights into the crypto asset world through this newsletter. Please direct any comments, questions, and words of feedback to research@21shares.com

Disclaimer

The information provided does not constitute a prospectus or other offering material and does not contain or constitute an offer to sell or a solicitation of any offer to buy securities in any jurisdiction. Some of the information published herein may contain forward-looking statements. Readers are cautioned that any such forward-looking statements are not guarantees of future performance and involve risks and uncertainties and that actual results may differ materially from those in the forward-looking statements as a result of various factors. The information contained herein may not be considered as economic, legal, tax or other advice and users are cautioned to base investment decisions or other decisions solely on the content hereof.

Fortsätt läsa
Annons
Klicka för att kommentera

Skriv en kommentar

Din e-postadress kommer inte publiceras. Obligatoriska fält är märkta *

Nyheter

Vilken är den bästa fond som följer Nasdaq-100?

Publicerad

den

Nasdaq 100-indexet följer de 100 största aktierna noterade på Nasdaq-börsen. De utvalda företagen kommer huvudsakligen från sektorer som hårdvara och mjukvara, telekommunikation, detaljhandel och bioteknik – inklusive alla stora amerikanska teknikföretag. Däremot ingår inte företag från energi-, finans- och fastighetssektorerna i Nasdaq-100. Vilken är den bästa fond som följer Nasdaq-100?

Nasdaq 100-indexet följer de 100 största aktierna noterade på Nasdaq-börsen. De utvalda företagen kommer huvudsakligen från sektorer som hårdvara och mjukvara, telekommunikation, detaljhandel och bioteknik – inklusive alla stora amerikanska teknikföretag. Däremot ingår inte företag från energi-, finans- och fastighetssektorerna i Nasdaq-100. Vilken är den bästa fond som följer Nasdaq-100?

I USA har den populära QQQ ETF, som spårar Nasdaq 100, varit tillgänglig sedan 1999. Den förvaltas av Invesco. Den europeiska motsvarigheten till denna ETF använder tickersymbolen eQQQ. Till skillnad från den amerikanska marknaden finns det dock flera ETF-leverantörer i Europa som spårar Nasdaq 100 – så det är värt att jämföra.

ETF-investerare kan dra nytta av värdeökningar och utdelningar från Nasdaq 100-beståndsdelarna. För närvarande spåras Nasdaq 100-indexet av tretton ETFer.

Förvaltningsarvode fond som följer Nasdaq-100

Nedan har vi listat förvaltningsarvoden för fond som följer Nasdaq-100. Samtliga dessa ETFer har en konkurrenskraftig prissättning, allt från AXA IM Nasdaq 100 UCITS ETF USD Acc, som debiterar sina andelsägare 0,14 procent per år till iShares Nasdaq 100 UCITS ETF (Acc) som tar ut 0,33 procent i arvode. I jämförelse kostar de flesta aktivt förvaltade fonder mycket mer avgifter per år.

NamnValutaISINKortnamnFörvaltningsavgift
AXA IM Nasdaq 100 UCITS ETF USD AccUSDIE000QDFFK00ANAU0.14%
Invesco Nasdaq-100 Swap UCITS ETF AccUSDIE00BNRQM384EQQX0.20%
Invesco Nasdaq-100 Swap UCITS ETF DistUSDIE000RUF4QN8EQQD0.20% p.a.
Xtrackers Nasdaq 100 UCITS ETF 1CUSDIE00BMFKG444XNAS0.20%
Amundi Nasdaq-100 II UCITS ETF AccEURLU1829221024LYMS0.22%
Amundi Nasdaq-100 II UCITS ETF DistUSDLU2197908721NADQ0.22%
Amundi Nasdaq 100 UCITS ETF EUR (C)EURLU16810382436AQQ0.23%
Amundi Nasdaq 100 UCITS ETF USDUSDLU168103832610A40.23%
Deka Nasdaq-100® UCITS ETFEURDE000ETFL623D6RH0.25%
Invesco EQQQ Nasdaq-100 UCITS ETFUSDIE0032077012EQQQ0.30%
Invesco EQQQ Nasdaq-100 UCITS ETF AccUSDIE00BFZXGZ54EQQB0.30%
iShares Nasdaq 100 UCITS ETF (DE)USDDE000A0F5UF5EXXT0.31%
iShares Nasdaq 100 UCITS ETF (Acc)USDIE00B53SZB19SXRV0.33%

Som alltid vill vi påminna att om det finns flera olika börshandlade fonder som täcker samma index eller segment är det förvaltningskostnaden som avgör. Antar vi att dessa Nasdaqfonder ger samma avkastning kommer den som har lägst avgift att utvecklas bäst, allt annat lika. Grundregeln är alltså, betala aldrig för mycket då detta kommer att äta upp din avkastning.

Nasdaq 100 ETFer i jämförelse

Förutom avkastning finns det ytterligare viktiga faktorer att tänka på när du väljer en Nasdaq 100 ETF. För att ge ett bra beslutsunderlag hittar du en lista över alla Nasdaq 100 ETFer med detaljer om vinstanvändning, fondens hemvist och replikeringsmetod.

NamnUtdelningspolicyHemvistReplikeringsmetod
iShares Nasdaq 100 UCITS ETF (Acc)AckumulerandeIrlandFysisk replikering
Invesco EQQQ Nasdaq-100 UCITS ETFUtdelandeIrlandFysisk replikering
iShares Nasdaq 100 UCITS ETF (DE)UtdelandeTysklandFysisk replikering
Amundi Nasdaq-100 II UCITS ETF AccAckumulerandeLuxemburgOfinansierad swap
Invesco EQQQ Nasdaq-100 UCITS ETF AccAckumulerandeIrlandFysisk replikering
Amundi Nasdaq 100 UCITS ETF EUR (C)AckumulerandeLuxemburgOfinansierad swap
Amundi Nasdaq-100 II UCITS ETF DistUtdelandeLuxemburgOfinansierad swap
AXA IM Nasdaq 100 UCITS ETF USD AccAckumulerandeIrlandFysisk replikering
Xtrackers Nasdaq 100 UCITS ETF 1CAckumulerandeIrlandFysisk replikering
Invesco Nasdaq-100 Swap UCITS ETF AccAckumulerandeIrlandOfinansierad swap
Amundi Nasdaq 100 UCITS ETF USDAckumulerandeLuxemburgOfinansierad swap
Invesco Nasdaq-100 Swap UCITS ETF DistUtdelandeIrlandOfinansierad swap
Deka Nasdaq-100® UCITS ETFUtdelandeTysklandFysisk replikering

Handla fond som följer Nasdaq-100

Samtliga dessa ETFer är europeiska börshandlade fonder. Dessa fond handlas på flera olika börser, till exempel Deutsche Boerse Xetra och London Stock Exchange.

Det betyder att det går att handla andelar i denna ETF genom de flesta svenska banker och Internetmäklare, till exempel DEGIRONordnet, Aktieinvest och Avanza.

Fortsätt läsa

Nyheter

Inevitable in India: Crowds, cricket and capital gains tax

Publicerad

den

capital gains tax India’s vibrant economy and structural growth opportunities continue to be the envy of many emerging markets. But somewhat unique to this market are tax implications that investors should be aware of. Our Franklin Templeton Global ETF team examines these structural issues in Asia’s third-largest economy.

India’s vibrant economy and structural growth opportunities continue to be the envy of many emerging markets. But somewhat unique to this market are tax implications that investors should be aware of. Our Franklin Templeton Global ETF team examines these structural issues in Asia’s third-largest economy.

In merely a decade, India has taken a quantum leap from the world’s 11th largest economy to become its fifth largest. By many accounts, it is expected to remain one of the world’s fastest-growing major economies over the coming years. And even after a banner 2023 during which the country’s benchmark indexes surged and Indian Prime Minister Narendra Modi celebrated high-profile successes—from historic technological and space exploration achievements to rising global diplomatic clout—this election year has already marked more progress in supporting Modi’s pro-growth, pro-jobs efforts.

The world’s most populous nation has advanced ties with Western countries over free trade. In addition to agreements with Australia and the United Arab Emirates, it has worked to better integrate the “Global South’s” development needs and ambitions with that of the G20. Modi has touted innovative partnerships for a new multilateral rail and sea corridor to connect India with the Middle East and the European Union (EU)—seen as a counterweight to China’s vast Belt-and-Road infrastructure corridor.

India reached its latest notable trade pact, nearly 16 years in the making, in March with the European Free Trade Association—Iceland, Liechtenstein, Norway and Switzerland. The agreement lifts Indian tariffs to secure US$100 billion in foreign direct investment commitments from the non-EU markets to India across multiple sectors.

With India still an enviable investment powerhouse, it seems important to clarify a few aspects of this dynamic equity market.

How exchange-traded funds (ETFs) treat India capital gains tax (CGT)

Foreign investors should be aware that CGT is an integral part of investing in Indian equities that cannot be circumvented. Investors in India funds are subject to CGT implications regardless of fund provider, and CGT is based and calculated on a fund as a whole, not an individual investor’s position.

The details: Foreign investors owning local Indian stocks are subject to taxation on capital gains at a short-term rate of 15% for positions held for less than one year and at a long-term rate of 10% for positions held over one year.

To accrue or not to accrue: Consistent with market practice for US-listed India ETF providers, Franklin Templeton accrues unrealized CGT in its daily net asset value (NAV). This can lead to differences in performance relative to the benchmark, which does not include CGT. As a result, rising markets will typically lead to fund underperformance against a benchmark, while weaker market environments will typically generate outperformance (provided the fund is in an unrealized capital gain position where the current market value of fund holdings is above their historical book cost). See chart below.

For UCITS-listed India funds, there is a divergence in methods utilized by fund providers in accruing and reporting CGT. Some do not accrue unrealized CGT in the NAV, but will charge CGT to investors directly at redemption, which we believe leaves investors with a level of opaqueness and uncertainty over their ultimate proceeds. This method also creates an elevated NAV compared to what investors will actually experience. While Franklin Templeton’s approach to CGT may at times lead to a higher tracking difference,1 we believe investors benefit from increased transparency and a more reflective experience.

The magnitude and impact of CGT for a specific fund is heavily dependent on several variables, such as the timing of purchases and sales, performance of the holdings and their volatility, and the size of flows in and out of the fund relative to its assets under management (AUM).

Understanding the impact: The CGT impact to fund performance is driven by the path of returns, timing of individual lots and price points. Very broadly speaking, in rising markets, an NAV-accruing fund will likely underperform its benchmark and vice versa.

Consideration of comparability: Because different providers handle CGT differently, the comparability of fund performance metrics may be affected. As investors, it’s prudent to consider how these nuances may influence investment decisions within the broader context of your financial strategy.

The bigger picture: While CGT considerations are important, they should be viewed within the broader spectrum of investment objectives and risk tolerance. Taking a long-term perspective and being mindful of other important characteristics of the investment vehicle of choice may aid in the decision-making process.

In summary, India remains an attractive investment destination with compelling growth prospects for its equity markets. Investors seeking India allocation through an ETF should be aware of the current tax regime and what varying methods of accounting methodologies really mean for fund valuation.

Fortsätt läsa

Nyheter

XB33 ETF köper företagsobligationer i euro som förfaller 2033

Publicerad

den

Xtrackers II Target Maturity Sept 2033 EUR Corporate Bond UCITS ETF 1D (XB33 ETF) med ISIN LU2673523564, försöker följa Bloomberg MSCI Euro Corporate September 2033 SRI-index. Bloomberg MSCI Euro Corporate September 2033 SRI-index följer företagsobligationer denominerade i EUR. Indexet speglar inte ett konstant löptidsintervall (som är fallet med de flesta andra obligationsindex). Istället ingår endast obligationer som förfaller mellan oktober 2032 och september 2033 i indexet (ETF kommer att stängas i efterhand). Indexet består av ESG (environmental, social and governance) screenade företagsobligationer. Betyg: Investment Grade.

Xtrackers II Target Maturity Sept 2033 EUR Corporate Bond UCITS ETF 1D (XB33 ETF) med ISIN LU2673523564, försöker följa Bloomberg MSCI Euro Corporate September 2033 SRI-index. Bloomberg MSCI Euro Corporate September 2033 SRI-index följer företagsobligationer denominerade i EUR. Indexet speglar inte ett konstant löptidsintervall (som är fallet med de flesta andra obligationsindex). Istället ingår endast obligationer som förfaller mellan oktober 2032 och september 2033 i indexet (ETF kommer att stängas i efterhand). Indexet består av ESG (environmental, social and governance) screenade företagsobligationer. Betyg: Investment Grade.

Den börshandlade fondens TER (total cost ratio) uppgår till 0,12 procent p.a. Xtrackers II Target Maturity Sept 2033 EUR Corporate Bond UCITS ETF 1D är den enda ETF som följer Bloomberg MSCI Euro Corporate September 2033 SRI-index. ETFen replikerar det underliggande indexets prestanda genom samplingsteknik (köper ett urval av de mest relevanta indexbeståndsdelarna). Ränteintäkterna (kupongerna) i ETFen delas ut till investerarna (Minst årligen).

Denna ETF lanserades den 8 november 2023 och har sin hemvist i Luxemburg.

Bloomberg MSCI Euro Corporate SRI PAB Index syftar till att spegla resultatet på följande marknad:

  • EUR-denominerade företagsobligationer
  • Endast obligationer med investeringsklass
  • Obligationer med en löptid på minst 1 år
  • Minsta utestående belopp på 300 miljoner euro per obligation
  • Endast obligationer utgivna av företag med en MSCI ESG-rating på BBB eller högre och en MSCI ESG Impact Monitor över 1 ingår

Indexet övervakar absoluta växthusgasutsläpp (“GHG”) genom att sätta en initial 50 % avkolning av absoluta växthusgasutsläpp i förhållande till moderuniversumet följt av en årlig 7 % avkolningsbana för absoluta växthusgasutsläpp.

Obligationer utgivna av företag som är involverade i alkohol, tobak, hasardspel, vuxenunderhållning, genetiskt modifierade organismer (GMO), kärnkraft, civila skjutvapen, militära vapen (inklusive minor, klusterbomber, kemiska vapen) är undantagna.

Handla XB33 ETF

Xtrackers II Target Maturity Sept 2033 EUR Corporate Bond UCITS ETF 1D (XB33 ETF) är en europeisk börshandlad fond. Denna fond handlas på Deutsche Boerse Xetra.

Det betyder att det går att handla andelar i denna ETF genom de flesta svenska banker och Internetmäklare, till exempel DEGIRONordnet, Aktieinvest och Avanza.

Börsnoteringar

BörsValutaKortnamn
XETRAEURXB33

Största innehav

ISINNamnVikt %Land
IE00BZ3FDF20DEUTSCHE GLOBAL LIQUIDITY SERI0.54%Irland
CH1214797172BBG01BFYVYX8 CREDIT SUISSE GROUP AG 3/290.18%Schweiz
XS0525602339RABOBANK 07/250.14%Holland
FR0000471930FRANCE TELECOM 01/330.13%Frankrike
FR0013324357SANOFI SA 1.375% 2030-03-210.12%Frankrike
XS1001749289MICROSOFT CORP 12/280.12%USA
XS1372839214VODAFONE GROUP PLC 08/26 EUR515200.12%Storbritannien
XS2461234622BBG0162QT3D3 JPMORGAN CHASE AND CO 3/300.11%USA
XS2235996217NOVARTIS FINANCE SA 9/280.11%Spanien
XS2705604234BBG01JPP1244 BANCO SANTANDER SA 10/310.11%Spanien
FR0013398070BNP PARIBAS 01/26 AW7468680.11%Frankrike
XS2180007549AT&T INC 5/280.11%Frankrike
XS2149207354GOLDMAN SACHS GROUP INC 3/250.10%USA
XS1603892149MORGAN STANLEY DEAN WITTER 04/27 AN3187610.10%USA
CH0537261858CREDIT SUISSE GROUP AG SR UNSECURED REGS 04/26 VAR 4/250.10%Schweiz

Innehav kan komma att förändras

Fortsätt läsa

Populära