Följ oss

Nyheter

A closer look at emerging market equities

Publicerad

den

A closer look at emerging market equities Global equities have been rallying in 2017, led by Asian emerging countries and North America to a lesser extent

ETF Securities Portfolio Insights:  A closer look at emerging market equities

Summary

  • Global equities have been rallying in 2017, led by Asian emerging countries and North America to a lesser extent.
  • The IMF expects Asian economies to continue to drive global growth while central banks in advanced economies are gradually reducing their financial support.
  • We believe US equities are overvalued and see greater opportunities within Latin American and Asian equities for 2018.

Global equities have been rallying since the end of 2016 as strong economic data from major advanced and developing countries combined with a decline in perceived political uncertainty has led to a surge of optimism on the global financial market. Extremely accommodative monetary policies in place since the great financial crisis are bearing fruit. 2018 will likely see these accommodative policies gradually dismantled, opening the path to new investment opportunities.

2017 performance

This year has seen global equities rallying since November 2016 as market participants are more confident that global economic growth has returned and will continue. While few risks remain, with the Italian election next year and the ongoing fight against terrorism and North Korea, the populist threat seen in 2016 has faded away. Unemployment is near its lowest in the US and UK with central banks now focussing on dismantling quantitative easing and tackling the inflation issue.

Looking at 2017 performance so far, the MSCI AC World index rose by 22%, driven by the rally of emerging markets (EM) and more specifically, emerging countries from Asia (39%). The developed markets (DM) with North America come second at 19.5%, followed by emerging Latin America at 18.5%. While one would expect volatility to pick up, 2017 saw the market volatility index (VIX) at its lowest level ever, at 9.6 on average, compared to 20 its historical average, suggesting that investors could increase their allocation to equities almost risk free.

Of the top 20 performers, 75% are emerging market countries. Argentina is leading the board with 62.6% year-to-date while China comes fourth (52%) and India eleventh (25.7%).

In its October World Economic Outlook, the International Monetary Fund (IMF) estimated global growth at 3.6% in 2017 and 3.7% in 2018 from 3.2% in 2016 driven by rising industrial activities and business and consumer confidence. Global growth will be mainly driven by EM countries projected at 4.6% in 2017 and 4.9% in 2018. China GDP has been revised upward by 0.2% compared to April, at 6.8% in 2017 and 6.5% in 2018 while India GDP for 2017 was revised down from 7.2% to 6.7%. In Latin America, Argentina is expected to rebound after last year’s recession with growth projected at 2.5% for 2017 and 2018 as consumption and investment recover.

What are the ratios saying?

The cyclically adjusted price to earnings ratio (CAPE) of DM over EM shows that developing countries remain attractive from a valuation point of view. Whilst the MSCI Emerging Market index has returned 30% year-to-date, the below chart suggests there is still scope for further gains in 2018.

In the following chart, the Latin American countries Argentina, Brazil, Colombia, Mexico and Chile, appear to be the most undervalued. Despite prices for these countries rising by 23% on average, the CAPE ratio remains below their respective historical averages driven by lower-than-average real earnings. However, all except Chile saw their real earnings growing this year in absolute terms, suggesting further potential catch-up of their earnings in the near term.

At the other end of the spectrum, US, Japan and few European countries are considered as overvalued. The CAPE ratio for each stands above their historical level due to real earnings having already catched up with its respective historical level and price rally. Further gains would be more difficult to justify.

A closer look at China

Xi Jinping came out of the 19th Congress of the Chinese Communist Party stronger than ever. Elevated to the same level as Mao Zedong, the president of the Republic of China has been given more power than any of his contemporary predecessors and with no one in its close committee potentially qualified to replace him in five years. With Xi having a history of stalling reform, we may see the implementation of short term stimulus, as opposed to long term structural reforms, continue. This should be positive for Chinese equities as the country focuses on sustainable growth, attracting foreign investment and remaining the largest consumers of commodities to meet the need of its economy and population. The outcome has initially been positively received as the MSCI China Index gained 8% one month following the Congress before declining recently as Chinese economic activities continue to show signs of a mild slowdown.

The above chart shows that China CAPE ratio currently stands above its historical level, suggesting that Chinese equities are overvalued. However, the surge of the MSCI China Index price level has been the main driver of the increase in the CAPE ratio. The index real earnings per share have been below its historical average over the past two years but are gradually recovering toward its mean since the beginning of the year. This picture combined with the potential decade length investiture of the “Strongman” suggests further potential upside for Chinese equities in the medium term.

Non-resident capital inflows in EM, mainly China, reached a bottom in 2015, according to the IMF, on concerns over the impact the US taper tantrum could have on EM asset prices and the potential depreciation of the Yuan. Inflows have revived since but is still half of the volume seen at its peak in Q1 2013. The recovery of investor sentiment regarding the global economy should see capital inflows in EM assets increase further in 2018.

Important Information

General

This communication has been issued and approved for the purpose of section 21 of the Financial Services and Markets Act 2000 by ETF Securities (UK) Limited (“ETFS UK”) which is authorised and regulated by the United Kingdom Financial Conduct Authority (the “FCA”).

The information contained in this communication is for your general information only and is neither an offer for sale nor a solicitation of an offer to buy securities. This communication should not be used as the basis for any investment decision. Historical performance is not an indication of future performance and any investments may go down in value.

Fortsätt läsa
Annons
Klicka för att kommentera

Skriv en kommentar

Din e-postadress kommer inte publiceras. Obligatoriska fält är märkta *

Nyheter

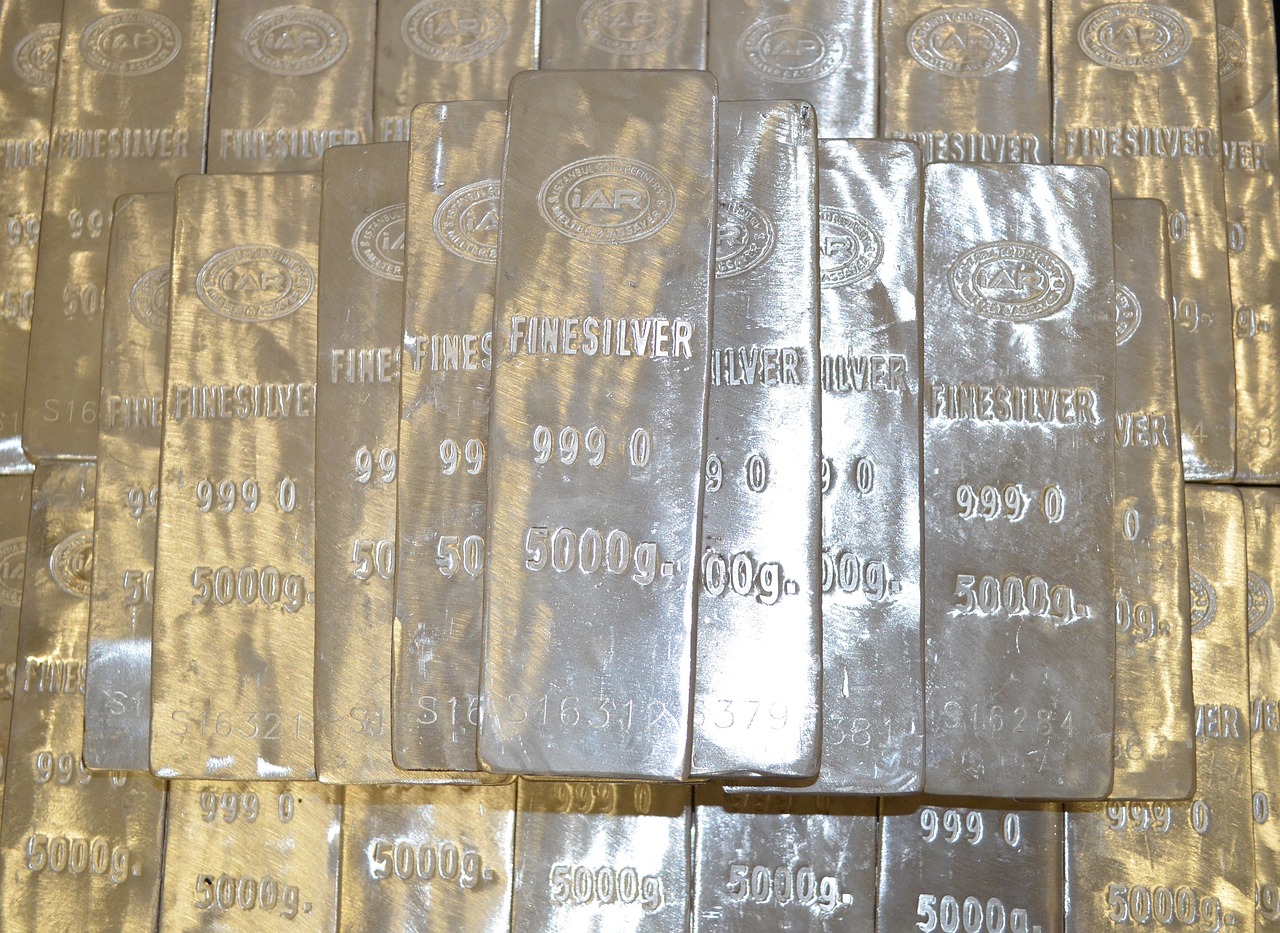
SGS5 ETP spårar priset på silverterminer

Publicerad

den

SG ETC Silver Futures-Kontrakt (SGS5 ETP) med ISIN DE000ETC0746, spårar priset på terminskontrakt på silver i form av terminspriset.

SG ETC Silver Futures-Kontrakt (SGS5 ETP) med ISIN DE000ETC0746, spårar priset på terminskontrakt på silver i form av terminspriset.

Den börshandlade produktens TER (total cost ratio) uppgår till 1,00 % p.a. Denna ETC replikerar resultatet för det underliggande indexet syntetiskt med en swap.

Denna ETC lanserades den 9 december 2022 och har sin hemvist i Tyskland.

Handla SGS5 ETP

SG ETC Silver Futures-Kontrakt (SGS5 ETP) är en europeisk börshandlad råvara. Denna ETC handlas på Deutsche Boerse Xetra.

Det betyder att det går att handla andelar i denna ETF genom de flesta svenska banker och Internetmäklare, till exempel DEGIRONordnet, Aktieinvest och Avanza.

Börsnoteringar

BörsValutaKortnamn
XETRAEURSGS5

Produktinformation

ISINDE000ETC0746
WKNETC074
ProdukttypETC/ETN utan hävstång
StrategiLång
Faktor1
SlutdatumEvig löptid
EmittentSG Issuer, Luxemburg
TillsynBundesanstalt für Finanzdienstleistungsaufsicht (BaFin)

Fortsätt läsa

Nyheter

GIGU ETF investerar aktivt i USD-denominerade företagsobligationer

Publicerad

den

Goldman Sachs USD Investment Grade Corporate Bond Active UCITS ETF CLASS USD (Dist) (GIGU ETF) med ISIN IE000RRCJI06, är en aktivt förvaltad ETF.

Goldman Sachs USD Investment Grade Corporate Bond Active UCITS ETF CLASS USD (Dist) (GIGU ETF) med ISIN IE000RRCJI06, är en aktivt förvaltad ETF.

Den börshandlade fonden investerar i USD-denominerade företagsobligationer. Alla löptider ingår. Rating: Investment Grade.

ETFens TER (total expense ratio) uppgår till 0,25 % per år. Ränteintäkterna (kuponger) i ETFen delas ut till investerarna (halvårsvis).

Goldman Sachs USD Investment Grade Corporate Bond Active UCITS ETF CLASS USD (Dist) är en mycket liten ETF med 19 miljoner euro under förvaltning. Denna lanserades den 21 januari 2025 och har sitt säte i Irland.

Mål

Delfonden strävar efter att uppnå en långsiktig avkastning genom att aktivt investera huvudsakligen i investment grade-denominerade räntebärande värdepapper i amerikanska dollar från företagsemittenter.

Riskprofil

  • Risk med villkorade konvertibla obligationer (”Coco”) – investeringar i denna specifika typ av obligation kan resultera i väsentliga förluster för delfonden baserat på vissa utlösande händelser. Förekomsten av dessa utlösande händelser skapar en annan typ av risk än traditionella obligationer och kan mer sannolikt resultera i en partiell eller total värdeförlust, eller alternativt kan de konverteras till aktier i det emitterande företaget som också kan ha lidit en värdeförlust.
  • Motpartsrisk – en part som delfonden gör transaktioner med kan misslyckas med att uppfylla sina skyldigheter, vilket kan orsaka förluster.
  • Kreditrisk – om en motpart eller en emittent av en finansiell tillgång som innehas inom delfonden misslyckas med att uppfylla sina betalningsskyldigheter kommer det att ha en negativ inverkan på delfonden.
  • Förvaringsrisk – insolvens, brott mot omsorgsplikt eller misskötsel från en förvaringsinstituts eller underförvaringsinstituts sida som ansvarar för förvaringen av delfondens tillgångar kan det leda till förlust för delfonden.
  • Derivatrisk – derivatinstrument är mycket känsliga för förändringar i värdet på den underliggande tillgången de baseras på. Vissa derivat kan resultera i förluster som är större än det ursprungligen investerade beloppet.
  • Tillväxtmarknadsrisk – tillväxtmarknader bär sannolikt högre risk på grund av lägre likviditet och eventuell brist på tillräckliga finansiella, juridiska, sociala, politiska och ekonomiska strukturer, skydd och stabilitet samt osäkra skattepositioner.
  • Valutakursrisk – förändringar i växelkurser kan minska eller öka den avkastning en investerare kan förvänta sig att få oberoende av tillgångarnas resultat. Om tillämpligt kan investeringstekniker som används för att försöka minska risken för valutakursförändringar (hedging) vara ineffektiva. Hedging innebär också ytterligare risker i samband med derivat.
  • Ränterisk – när räntorna stiger faller obligationspriserna, vilket återspeglar investerares förmåga att få en mer attraktiv ränta på sina pengar någon annanstans. Obligationspriserna är därför föremål för ränteförändringar som kan röra sig av ett antal skäl, både politiska och ekonomiska.
  • Hållbarhetsrisk – en miljömässig, social eller styrningsmässig händelse eller ett förhållande som kan orsaka att delfondens värde sjunker. Exempel på hållbarhetsrisker inkluderar fysiska miljörisker, risker för klimatomställningen, störningar i leveranskedjan, otillbörliga arbetsmetoder, bristande mångfald i styrelsen och korruption.
  • Likviditetsrisk – delfonden kanske inte alltid hittar en annan part som är villig att köpa en tillgång som delfonden vill sälja, vilket kan påverka delfondens förmåga att möta inlösenförfrågningar på begäran.
  • Marknadsrisk – värdet på tillgångar i delfonden dikteras vanligtvis av ett antal faktorer, inklusive förtroendenivåerna på den marknad där de handlas.
  • Operativ risk – väsentliga förluster för delfonden kan uppstå till följd av mänskliga fel, system- och/eller processfel, otillräckliga rutiner eller kontroller.

Fullständig information om riskerna med att investera i fonden finns i fondens prospekt.

Handla GIGU ETF

Goldman Sachs USD Investment Grade Corporate Bond Active UCITS ETF CLASS USD (Dist) (GIGU ETF) är en europeisk börshandlad fond. Denna fond handlas på flera olika börser, till exempel Deutsche Boerse Xetra och London Stock Exchange.

Det betyder att det går att handla andelar i denna ETF genom de flesta svenska banker och Internetmäklare, till exempel  Nordnet, SAVR, DEGIRO och Avanza.

Börsnoteringar

BörsValutaKortnamn
Borsa ItalianaEURGIGU
London Stock ExchangeGBPGIGP
London Stock ExchangeUSDGIGU
SIX Swiss ExchangeUSDGIGU
XETRAEURGIGU

Fortsätt läsa

Nyheter

UK looking to lift the retail ban on crypto ETPs

Publicerad

den

The UK is shaking up crypto. This month, the Financial Conduct Authority (FCA) proposed lifting its ban on crypto exchange-traded notes for retail investors, a positive step in a global race to regulate digital assets and provide consumer protection.

The UK is shaking up crypto. This month, the Financial Conduct Authority (FCA) proposed lifting its ban on crypto exchange-traded notes for retail investors, a positive step in a global race to regulate digital assets and provide consumer protection.

Key metrics show Bitcoin’s rally isn’t over

Bitcoin is above $100K, and key indicators suggest a growing momentum and a potential for further upside. The Bitcoin Fear & Greed Index sits at 62, reflecting a sentiment that remains near neutral. This lack of extreme greed suggests that the rally may still have room to run in the near term.

Apple wants to enter Circle’s orbit. Why are stablecoins the tech world’s new darling?

Stablecoin issuer Circle made a blockbuster debut on the New York Stock Exchange earlier this month. Now, tech giants like Apple, Meta, and Google are reportedly exploring stablecoin integrations, marking another major step toward merging digital assets with mainstream technology.

Research Newsletter

Each week the 21Shares Research team will publish our data-driven insights into the crypto asset world through this newsletter. Please direct any comments, questions, and words of feedback to research@21shares.com

Disclaimer

The information provided does not constitute a prospectus or other offering material and does not contain or constitute an offer to sell or a solicitation of any offer to buy securities in any jurisdiction. Some of the information published herein may contain forward-looking statements. Readers are cautioned that any such forward-looking statements are not guarantees of future performance and involve risks and uncertainties and that actual results may differ materially from those in the forward-looking statements as a result of various factors. The information contained herein may not be considered as economic, legal, tax or other advice and users are cautioned to base investment decisions or other decisions solely on the content hereof.

Fortsätt läsa

21Shares

Prenumerera på nyheter om ETFer

* indicates required

21Shares

21Shares

Populära