
Nyheter
A closer look at emerging market equities

ETF Securities Portfolio Insights: A closer look at emerging market equities
Summary
- Global equities have been rallying in 2017, led by Asian emerging countries and North America to a lesser extent.
- The IMF expects Asian economies to continue to drive global growth while central banks in advanced economies are gradually reducing their financial support.
- We believe US equities are overvalued and see greater opportunities within Latin American and Asian equities for 2018.
Global equities have been rallying since the end of 2016 as strong economic data from major advanced and developing countries combined with a decline in perceived political uncertainty has led to a surge of optimism on the global financial market. Extremely accommodative monetary policies in place since the great financial crisis are bearing fruit. 2018 will likely see these accommodative policies gradually dismantled, opening the path to new investment opportunities.
2017 performance
This year has seen global equities rallying since November 2016 as market participants are more confident that global economic growth has returned and will continue. While few risks remain, with the Italian election next year and the ongoing fight against terrorism and North Korea, the populist threat seen in 2016 has faded away. Unemployment is near its lowest in the US and UK with central banks now focussing on dismantling quantitative easing and tackling the inflation issue.

Looking at 2017 performance so far, the MSCI AC World index rose by 22%, driven by the rally of emerging markets (EM) and more specifically, emerging countries from Asia (39%). The developed markets (DM) with North America come second at 19.5%, followed by emerging Latin America at 18.5%. While one would expect volatility to pick up, 2017 saw the market volatility index (VIX) at its lowest level ever, at 9.6 on average, compared to 20 its historical average, suggesting that investors could increase their allocation to equities almost risk free.

Of the top 20 performers, 75% are emerging market countries. Argentina is leading the board with 62.6% year-to-date while China comes fourth (52%) and India eleventh (25.7%).

In its October World Economic Outlook, the International Monetary Fund (IMF) estimated global growth at 3.6% in 2017 and 3.7% in 2018 from 3.2% in 2016 driven by rising industrial activities and business and consumer confidence. Global growth will be mainly driven by EM countries projected at 4.6% in 2017 and 4.9% in 2018. China GDP has been revised upward by 0.2% compared to April, at 6.8% in 2017 and 6.5% in 2018 while India GDP for 2017 was revised down from 7.2% to 6.7%. In Latin America, Argentina is expected to rebound after last year’s recession with growth projected at 2.5% for 2017 and 2018 as consumption and investment recover.
What are the ratios saying?
The cyclically adjusted price to earnings ratio (CAPE) of DM over EM shows that developing countries remain attractive from a valuation point of view. Whilst the MSCI Emerging Market index has returned 30% year-to-date, the below chart suggests there is still scope for further gains in 2018.

In the following chart, the Latin American countries Argentina, Brazil, Colombia, Mexico and Chile, appear to be the most undervalued. Despite prices for these countries rising by 23% on average, the CAPE ratio remains below their respective historical averages driven by lower-than-average real earnings. However, all except Chile saw their real earnings growing this year in absolute terms, suggesting further potential catch-up of their earnings in the near term.

At the other end of the spectrum, US, Japan and few European countries are considered as overvalued. The CAPE ratio for each stands above their historical level due to real earnings having already catched up with its respective historical level and price rally. Further gains would be more difficult to justify.
A closer look at China
Xi Jinping came out of the 19th Congress of the Chinese Communist Party stronger than ever. Elevated to the same level as Mao Zedong, the president of the Republic of China has been given more power than any of his contemporary predecessors and with no one in its close committee potentially qualified to replace him in five years. With Xi having a history of stalling reform, we may see the implementation of short term stimulus, as opposed to long term structural reforms, continue. This should be positive for Chinese equities as the country focuses on sustainable growth, attracting foreign investment and remaining the largest consumers of commodities to meet the need of its economy and population. The outcome has initially been positively received as the MSCI China Index gained 8% one month following the Congress before declining recently as Chinese economic activities continue to show signs of a mild slowdown.

The above chart shows that China CAPE ratio currently stands above its historical level, suggesting that Chinese equities are overvalued. However, the surge of the MSCI China Index price level has been the main driver of the increase in the CAPE ratio. The index real earnings per share have been below its historical average over the past two years but are gradually recovering toward its mean since the beginning of the year. This picture combined with the potential decade length investiture of the “Strongman” suggests further potential upside for Chinese equities in the medium term.
Non-resident capital inflows in EM, mainly China, reached a bottom in 2015, according to the IMF, on concerns over the impact the US taper tantrum could have on EM asset prices and the potential depreciation of the Yuan. Inflows have revived since but is still half of the volume seen at its peak in Q1 2013. The recovery of investor sentiment regarding the global economy should see capital inflows in EM assets increase further in 2018.
Important Information
This communication has been issued and approved for the purpose of section 21 of the Financial Services and Markets Act 2000 by ETF Securities (UK) Limited (“ETFS UK”) which is authorised and regulated by the United Kingdom Financial Conduct Authority (the “FCA”).


Den amerikanska centralbanken Federal Reserve sänkte räntorna med 0,25 % i veckan– men vad kan det betyda för den amerikanska aktiemarknaden?
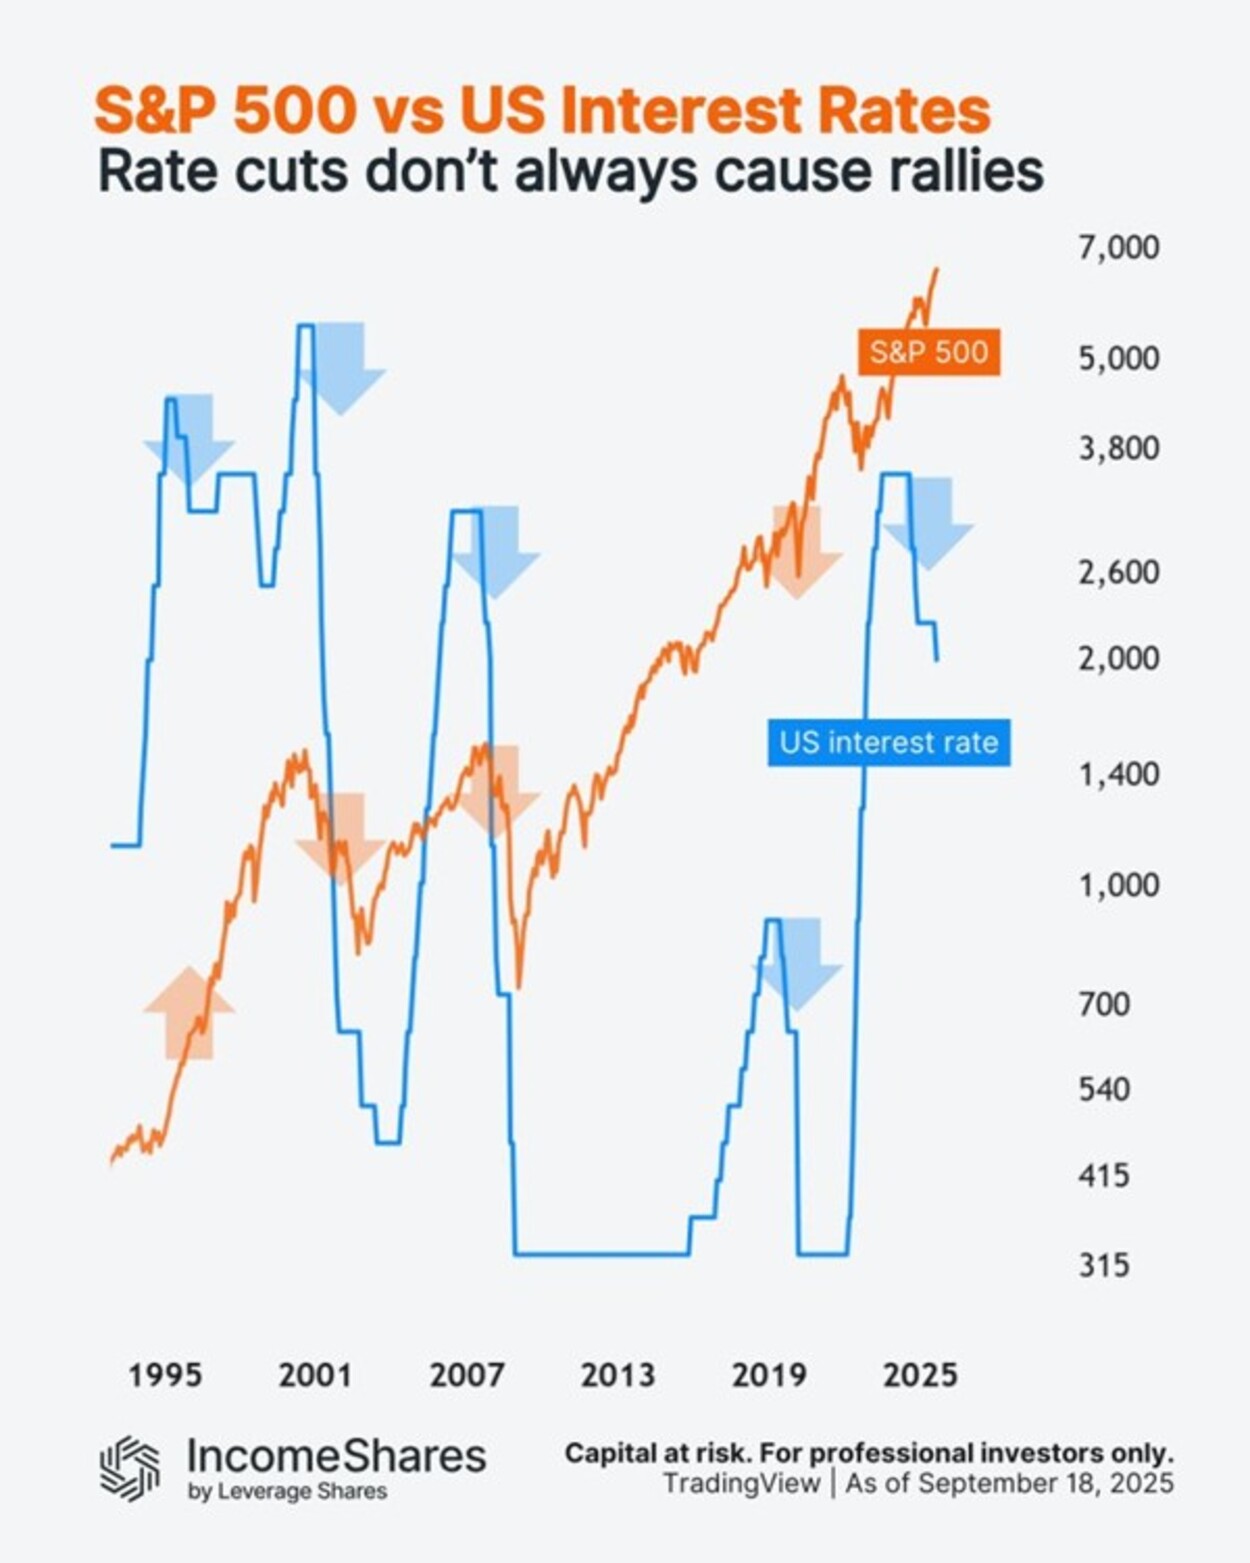
Detta diagram följer S&P 500-indexet (orange linje) mot amerikanska räntor (blå linje) sedan 1990-talet.
Här är vad som hände med aktierna de senaste gångerna Fed började sänka räntorna från tidigare ränte”toppar”:
• 1995: aktierna steg (före dotcom-bubblan).
• 2000: aktierna föll (dotcom-bubblan sprack).
• 2007: ytterligare en björnmarknad (före finanskrisen 2008).
• 2019: aktierna steg först (sedan föll de in i Covid-kraschen 2020).
Fyra av fem gånger sammanföll räntesänkningarna med stora nedgångar. Men orsakerna var alltid olika. Korrelation innebär inte kausalitet.
Och nu, 2024/25, befinner vi oss i en ny sänkningscykel. Aktierna sjönk med cirka 20 % i början av 2025, men har sedan dess stigit till nya toppar. Frågan är, vad händer härnäst?
IncomeShares S&P500 Options (0DTE) ETP har exponering mot S&P 500 och säljer dagliga säljoptioner för potentiell inkomst.
Följ IncomeShares EU för marknadsinsikter.


HANetfs VD kommenterar kärnkraftsavtalet mellan Storbritannien och USA

WMSE ETF en global momentumfond som handlas i euro och pund

Federal Reserve sänkte räntorna med 0,25 %

ARAY ETP följer priset på kryptovalutan Raydium

Bellevue lanserar aktiv hälso-ETF på Xetra

Utdelningar och försvarsfonder lockade i augusti

Månadsutdelande ETFer uppdaterad med IncomeShares produkter

HANetfs analyserar hur ett fredsavtal kan påverka det europeiska försvaret

ADLT ETF investerar bara i riktigt långa amerikanska statsobligationer

Septembers utdelning i XACT Norden Högutdelande
-
 Nyheter3 veckor sedan
Utdelningar och försvarsfonder lockade i augusti
-
 Nyheter4 veckor sedan
Månadsutdelande ETFer uppdaterad med IncomeShares produkter
-
 Nyheter4 veckor sedan
HANetfs analyserar hur ett fredsavtal kan påverka det europeiska försvaret
-
 Nyheter4 veckor sedan
ADLT ETF investerar bara i riktigt långa amerikanska statsobligationer
-
 Nyheter2 veckor sedan
Septembers utdelning i XACT Norden Högutdelande
-

 Nyheter4 veckor sedan
Fastställd utdelning i MONTDIV augusti 2025
-

 Nyheter2 veckor sedan
HANetf kommenterar mötet mellan Kina, Ryssland och Nordkorea vid militärparad
-

 Nyheter4 veckor sedan
AICT ETF investerar i obligationer utgivna av företag från tillväxtmarknader