
Nyheter
50 ETFer för daytraders


Nyheter
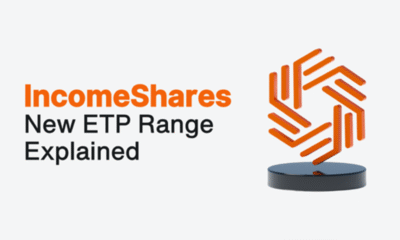
HANetf och Infrastructure Capital Advisors samarbetar för att lansera aktivt förvaltad preferensavkastnings-ETF i Europa


Nyheter3 timmar sedan
HANetf och Infrastructure Capital Advisors samarbetar för att lansera aktivt förvaltad preferensavkastnings-ETF i Europa

Nyheter4 timmar sedan
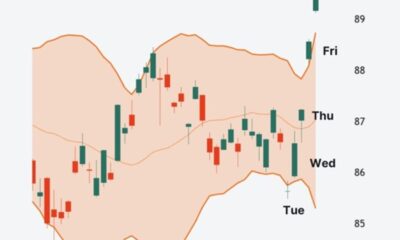
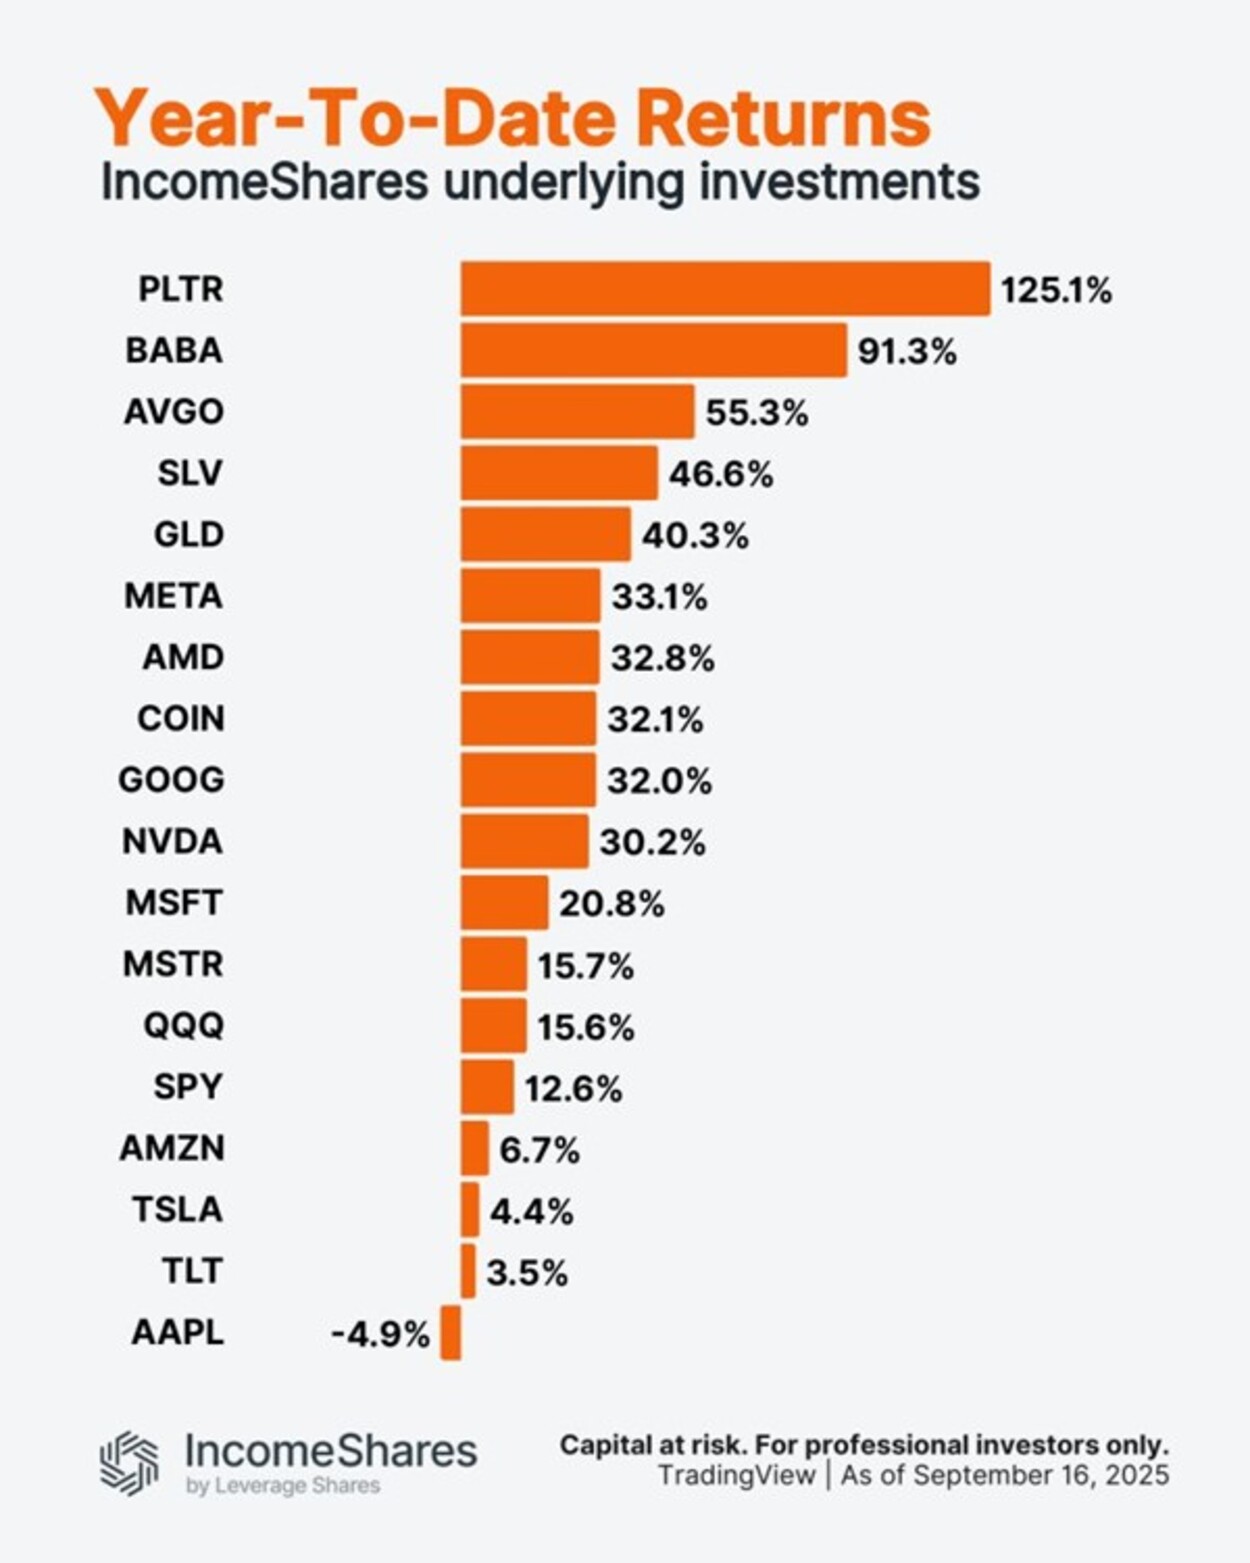
Palantir är upp 125 % i år. Apple är ner 5 %.

Nyheter5 timmar sedan
Utforska framtiden för AI och DeFi

Nyheter6 timmar sedan
ONCC ETP spårar den schweiziska dagslåneräntan

Nyheter7 timmar sedan
HANetf kommenterar kopparuppgången

Nyheter3 veckor sedan
Utdelningar och försvarsfonder lockade i augusti

Nyheter4 veckor sedan
Månadsutdelande ETFer uppdaterad med IncomeShares produkter

Nyheter4 veckor sedan
HANetfs analyserar hur ett fredsavtal kan påverka det europeiska försvaret

Nyheter4 veckor sedan
ADLT ETF investerar bara i riktigt långa amerikanska statsobligationer

Nyheter2 veckor sedan
Septembers utdelning i XACT Norden Högutdelande
-
 Nyheter3 veckor sedan
Utdelningar och försvarsfonder lockade i augusti
-
 Nyheter4 veckor sedan
Månadsutdelande ETFer uppdaterad med IncomeShares produkter
-
 Nyheter4 veckor sedan
HANetfs analyserar hur ett fredsavtal kan påverka det europeiska försvaret
-
 Nyheter4 veckor sedan
ADLT ETF investerar bara i riktigt långa amerikanska statsobligationer
-
 Nyheter2 veckor sedan
Septembers utdelning i XACT Norden Högutdelande
-

 Nyheter3 veckor sedan
Fastställd utdelning i MONTDIV augusti 2025
-

 Nyheter2 veckor sedan
HANetf kommenterar mötet mellan Kina, Ryssland och Nordkorea vid militärparad
-

 Nyheter4 veckor sedan
AICT ETF investerar i obligationer utgivna av företag från tillväxtmarknader