
Nyheter
Why Are DEXs the Undisputed Game-Changer of Modern Digital Finance?
The decentralized finance (DeFi) sector is poised for explosive growth, with estimates projecting at least an $80B valuation by the end of 2025. This remarkable trajectory is fueled by a confluence of factors, including favorable regulatory shifts and the pivotal role of decentralized exchanges (DEXs) in driving market trends. At the heart of the DeFi landscape are four key exchanges that exemplify the sector’s dynamism and potential:
- Uniswap: The industry titan with multi-chain dominance
- Aerodrome: Base network’s powerhouse
- Raydium: Solana’s DeFi cornerstone
- Jupiter: The innovative aggregator reshaping Solana’s ecosystem
Why focus on these exchanges now? The DeFi sector is at a critical juncture:
• Imminent protocol upgrades promise to reshape market dynamics.
• Institutional participation is surging, driven by regulatory clarity.
• The Total Value Locked (TVL) in DeFi is expected to surpass $250B by year-end.
• DEXs are playing a crucial role in emerging trends, including the rise of memecoins, AI agents and tokenized real-world assets.
As we delve into these four pivotal exchanges, we’ll uncover the technological advancements, market strategies, and regulatory adaptations that are set to define DeFi’s trajectory in 2025 and beyond.
For starters, what are Decentralized Exchanges (DEXs)?
DEXs are non-custodial exchanges empowering users to trade assets directly via self-executing smart contracts, bypassing traditional intermediaries. By linking non-custodial wallets like MetaMask and Phantom, traders retain full control of their funds while swapping tokens across different blockchains. Instead of centralized order books, DEXs leverage automated market makers (AMMs)—algorithmic liquidity pools that set prices and enable anyone to contribute capital, democratizing market access for both users and liquidity providers. As seen below, the ratio of volume between decentralized vs. centralized venues has reached its highest level to date.
Figure 1: Decentralized to Centralized Exchange Spot Volumes
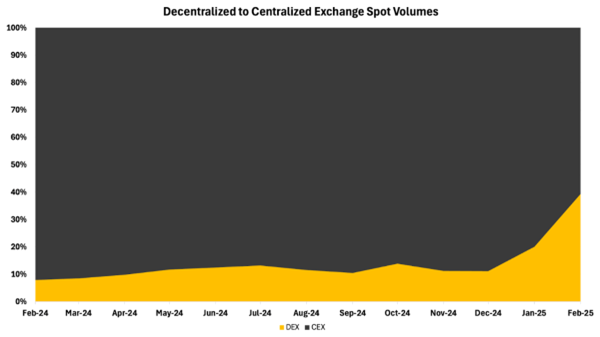
Source: 21Shares, TheBlock
Why are DEXs important?
DEXs dismantle financial gatekeepers, democratizing access through unstoppable, open-source protocols that fuel permissionless innovation. Unlike centralized giants like Mt. Gox or Bitfinex—whose catastrophic hacks exposed systemic fragility—DEXs are immune to single-point failures due to the decentralized nature of their underlying networks. Their censorship-resistant design ensures no entity can freeze assets or halt transactions. For example, the SEC sent a Wells notice to Uniswap Labs alleging they’re facilitating the trading of unregistered securities. While the foundation removed the tokens from its front end, the underlying smart contracts remained accessible on Ethereum. This meant that users could still interact with these tokens through alternative front-ends or by directly engaging with underlying smart contracts. This reinforces that while regulators target surface-level interfaces, the core infrastructure remains immutable—a testament to DeFi’s immutable foundational promise.
Having said that, aggregators also play an important role. Just as brokerage platforms consolidate fragmented liquidity across centralized exchanges, DEX aggregators in crypto fulfill a similar role. These tools optimize trade execution by intelligently routing orders, reducing slippage and costs by 2-5%. Working symbiotically with DEXs like Uniswap, aggregators drive 20-35% of DEX volume, creating a win-win ecosystem: DEXs gain increased activity, while aggregators thrive on consolidated liquidity. This collaboration transforms isolated pools into a cohesive financial network.
Why are we talking about them now?
For one, DeFi ranks among the highest revenue-generating sectors in the crypto ecosystem, as seen in Figure 2. This stems from DeFi’s early maturity and its strong Product-Market Fit due to its vital role in enabling access to emerging sectors.
Figure 2: Breakdown of the top 20 revenue-generating protocols, categorized by sectors, over the last year.
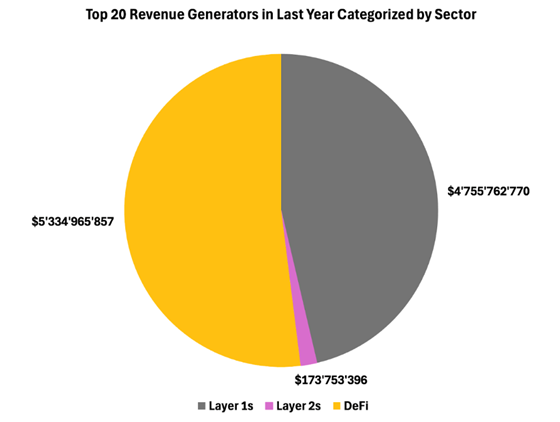
Source: 21Shares, TokenTerminal
Specifically, DEXs dominate blockchain activity as the primary gas consumers, with platforms like Uniswap and Raydium consistently ranking as top spenders across the landscape, as seen in Figure 3. Furthermore, exchanges have a symbiotic relationship with stablecoins: over half of Tether’s on-chain transactions originate from trading, creating a self-reinforcing cycle where Tether liquidity fuels DEX volume. At the same time, DEX demand solidifies Tether’s dominance. By driving 60-75% of on-chain activity through token swaps, stablecoin demand, and dApp liquidity provision, exchanges act as a foundational access point for the crypto ecosystem.
Figure 3: Top 10 Gas Spenders in Last Year
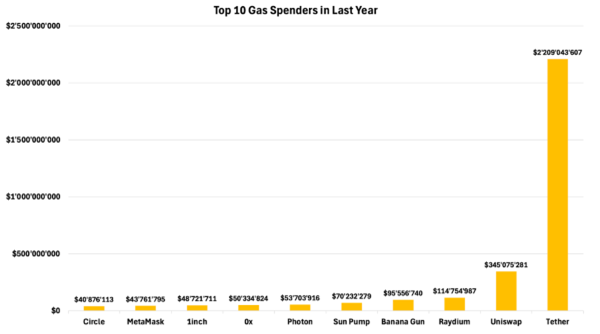
Source: 21Shares, TokenTerminal
In a sense, DEXs not only drive their own ecosystem but also generate a significant portion of the demand for the underlying blockchains they operate on. However, they can capture even more value and strengthen the investment case for their native tokens by positioning them as the gas token for their dApp. Given the self-reinforcing ecosystem and user loop they create, it becomes increasingly logical for DEXs to evolve into their own app-chains—allowing them to fully internalize transaction fees, optimize performance, and enhance user experience while maintaining sovereignty over their liquidity and trading infrastructure.
We are seeing this starting to materialize, both with Uniswap’s Unichain, which we wrote an entire previous newsletter on, and Jupiter’s Jupnet. The latter is a new omnichain network aiming to unify liquidity across multiple blockchains into one platform, creating a decentralized ledger that enhances usability for both users and developers. Jupnet envisions a future where a single account can seamlessly access all chains, currencies, and commodities—referred to as the ”1A3C” vision. This approach is designed to simplify blockchain interactions while empowering new innovations in cross-chain liquidity and usability.
The evolution of Uniswap and Jupiter into application-specific chains represents a strategic shift in the DeFi landscape driven by similar motivations. Both protocols aim to optimize their ecosystems by vertically integrating their operations. Uniswap’s upcoming Unichain and Jupiter’s cross-chain network are designed to significantly reduce fees, enhance trading speeds, and consolidate fragmented liquidity across multiple chains. In addition, it also creates new revenue streams by capturing MEV —estimated at over $400M annually—that previously leaked to third parties. By internalizing these value streams, both protocols transform from mere liquidity providers into self-sustaining trading ecosystems while building defensible moats against competitors
Beyond this strategic shift, Uniswap is also setting itself up for success with the release of v4, which was just deployed this week. The latest upgrade enhances v3’s efficiency with optimizable adapters that enable custom logic during swaps, liquidity actions, or fee collection. This modular design supports advanced features like limit orders, dynamic fees, and automated liquidity management without core protocol changes. Traders and liquidity providers benefit from reduced costs and flexible fee structures that optimize value distribution.
DEX Memecoin Frenzy
The surge in non-custodial infrastructure adoption has been significantly propelled by memecoins, offering an accessible gateway for newcomers to the crypto ecosystem, especially as these tokens are often unavailable on centralized exchanges during their initial launch. This trend has been a major catalyst for DEX growth over the past year, peaking with Trump’s memecoin launch. A prime example is Raydium, Solana’s largest DEX, where memecoin trading dominates activity. In the last 24 hours, memecoins represented 7 of the top 10 most traded tokens on the platform, accounting for over 30% of its total volume. Expanding this view, 41 of the top 50 traded tokens were memecoins, contributing to more than 50% of Raydium’s daily trading volume. These statistics underscore the pivotal role of memecoin speculation in driving DEX activity and liquidity in decentralized markets.
Figure 4: Raydium 24-Hour Spot Trading Volume
Source: 21Shares, Coingecko
$TRUMP, World Liberty Financial (WLFI) Convergence, What’s Next?
The Trump ecosystem appears poised to expand its crypto footprint. Following their DeFi lending platform (WLF), a Trump-branded DEX could emerge as the logical next step—transforming TRUMP from a memecoin into the cornerstone of a self-sustaining DeFi network. Despite ranking 40th in market cap, TRUMP already claims a top-10 trading volume spot, signaling robust demand. A dedicated DEX would amplify this activity while unlocking fee-based revenue, solidifying Trump’s crypto influence through an integrated swap-lend-earn ecosystem.
Looking ahead, a Trump Layer 2 or appchain could elevate this vision. By designating TRUMP as the network’s native gas token, the ecosystem could internalize transaction fees, enhance scalability, and deepen token utility. Such a move would transcend memecoin status, potentially reshaping how public figures monetize digital influence and the overall perception of these tokens.
Having established the critical role of DEXs, let’s now explore the key factors that set them apart and their key value propositions:
Total Value Locked serves as DeFi’s primary metric for measuring capital deployed across protocols. Initially, Uniswap dominated this space by capitalizing on Ethereum’s first-mover advantage and network effects, reaching a peak TVL of $10B. Despite severe market fluctuations during recent crypto winters, DEX TVL remained stable – demonstrating DeFi’s market maturity and sustainable product-market fit.
Figure 5: Total Value Locked Across Major DEXs
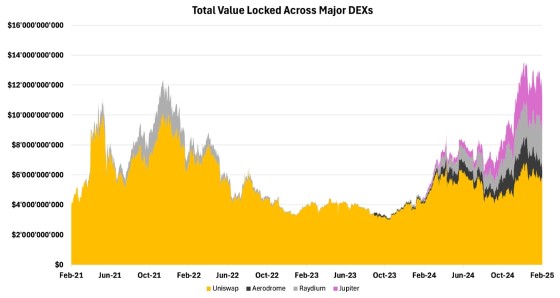
Source: 21Shares, DeFiLlama
The competitive landscape has shifted significantly with new entrants challenging Ethereum’s dominance. Aerodrome leveraged Coinbase’s Base network integration to streamline user onboarding, while Solana’s low-cost infrastructure fueled growth of protocols like Raydium and Jupiter, which now collectively hold over $5B in TVL. These developments reduced Uniswap’s market share from near-total dominance to roughly 50% of the combined TVL held by these three emerging rivals. This redistribution highlights DeFi’s evolution into a multi-chain ecosystem where scalability and user experience increasingly dictate platforms’ success.
Daily active users follow a similar trend. Uniswap, benefiting from Ethereum’s ecosystem, once dominated but Solana-based apps, especially Raydium, surged. By late last year, Raydium captured over 80% of daily active users, driven by memecoin trading’s retail appeal.
Figure 6: Daily Active Users Across Major DEXs
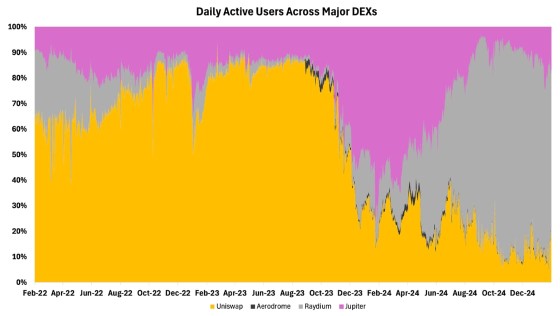
Figure 7: Total Volume Across Major DEXs
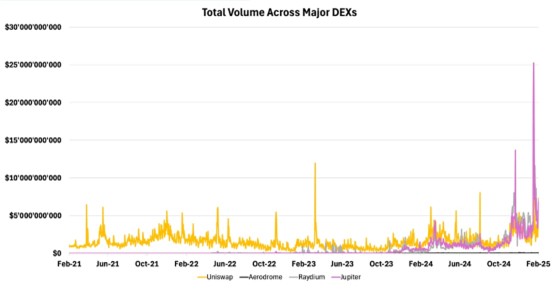
Source: 21Shares, TokenTerminal, Artemis
Transaction counts also highlight the rapid growth of Solana-based platforms, particularly Raydium, driven by speculative trading and low costs. As shown in Figure 8, Raydium reached a peak of over 25M transactions in a single day, more than double its other competitors, showcasing its dominance in the current DEX landscape.
Figure 8: Total Transaction Count Across Major DEXs
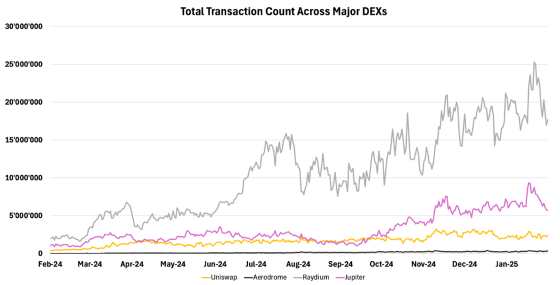
Source: 21Shares, Token Terminal, Dune
Figure 9 highlights that Raydium’s significant activity translates into equally notable revenue generation, making nearly $30M in revenue the weekend ahead of the inauguration. Meanwhile, Aerodrome generates substantial revenue due to the vote-escrow mechanism which is explored in a later section.
Figure 9: Total Revenue Generated
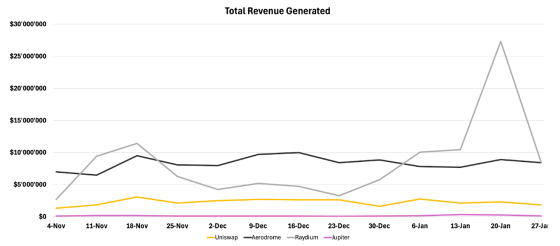
Source: 21Shares, TokenTerminal, Dune
For the technically curious, the following section delves deep into the intricacies that distinguish these DEXs.
Figure 10: Comparing the Different DEX Platforms
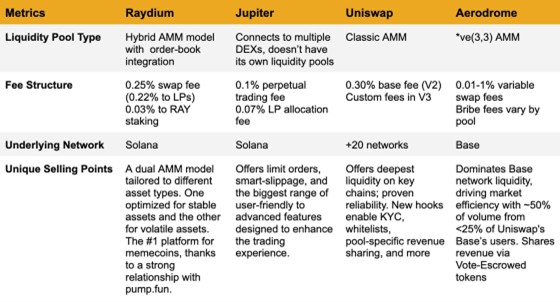
Source: 21Shares
The main differentiating feature amongst DEXs is how they operate their liquidity models. For example, Raydium’s Hybrid AMM model combines Concentrated Liquidity Market Maker (CLMM) with Central Limit Order Book (CLOB), offering both customizable liquidity ranges and traditional order matching. This model provides flexibility for traders and liquidity providers. Alternatively, Uniswap’s Classic AMM, maintains liquidity across all price points, ensuring continuous liquidity. However, this model may be less capital efficient and more rigid.
Finally, Aerodrome’s *ve(3,3) AMM, inspired by Curve Finance, introduces vote-escrowed tokens and bribes to incentivize liquidity provision. This model allows token holders to lock their tokens for voting rights and elevated rewards, potentially creating a more engaged and stickier liquidity base. As such, each model offers a unique balance between simplicity, capital efficiency, and user incentives.
To summarize, these are the key distinctions between all 4 models:
• Raydium offers customizable liquidity ranges and traditional order matching.
• Jupiter is an aggregator that lacks its own liquidity engine. However, it offers centralized exchange-level features like limit orders and dynamic slippage calculator,upgrading the typical DEX user-experience.
• Uniswap V3 pioneered concentrated liquidity, enabling roughly 4000x capital efficiency vs V2 in stablecoin pairs.
• Aerodrome uses Curve-style vote-escrow tokens (veAERO) with bribes directing 73% of revenue.
Having identified the differences between the platforms’ technologies, let’s compare the valuation of their respective tokens:
Figure 11: DEXs’ Tokens Valuation Metrics
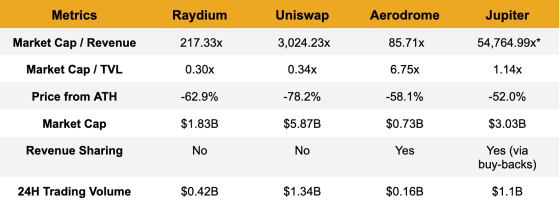
Source: 21Shares, TokenTerminal
*Jupiter’s revenue here only accounts for its spot market activity, although the bulk of its activity actually comes from its derivatives platform, that’s why it has such a seemingly unfavorable market cap / revenue ratio.
As seen, Aerodrome stands out as a remarkably undervalued token compared to its peers, driven by its impressive revenue generation and dominance on the Base network. Despite operating on a single chain and capturing less than 25% of Uniswap’s user base, Aerodrome’s performance underscores the power of strong product-market fit. Its success, particularly when compared to multi-chain platforms like Uniswap, highlights the potential for focused, chain-specific exchanges. In terms of Market Cap to TVL, Uniswap and Raydium’s low ratio suggest undervaluation, reflecting high capital efficiency and stronger usage. However, relative valuation is just one factor to consider, as these protocols are at varying stages of maturity. The evolving DeFi landscape suggests a future where multiple specialized exchanges can thrive simultaneously, each carving out its niche in the broader ecosystem.
All in all, DeFi emerges as a 2025 standout sector, fueled by regulatory tailwinds and accelerating institutional adoption of on-chain infrastructure. At its core, DEXs like Uniswap and Jupiter are evolving into critical infrastructure, leveraging innovations such as Unichain and Jupnet to achieve institutional-grade scalability while pioneering app-chain architectures. As the DEX/CEX volume ratio reaches record highs just shy of 40%, these platforms are uniquely positioned to capitalize on the migration to decentralized markets. Their growing emphasis on user-aligned tokenomics—where revenue-sharing mechanisms transform governance tokens into yield-generating assets—creates a compelling value proposition for investors navigating this new era of value accrual in DeFi.
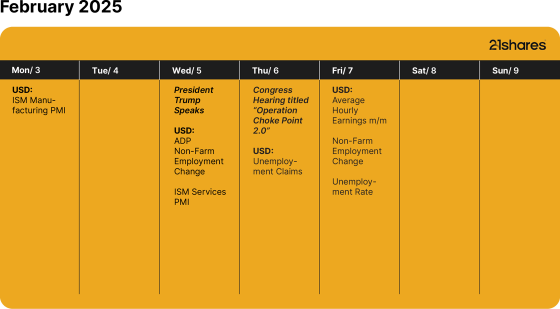
What’s happening this week?
Research Newsletter
Each week the 21Shares Research team will publish our data-driven insights into the crypto asset world through this newsletter. Please direct any comments, questions, and words of feedback to research@21shares.com
Disclaimer
The information provided does not constitute a prospectus or other offering material and does not contain or constitute an offer to sell or a solicitation of any offer to buy securities in any jurisdiction. Some of the information published herein may contain forward-looking statements. Readers are cautioned that any such forward-looking statements are not guarantees of future performance and involve risks and uncertainties and that actual results may differ materially from those in the forward-looking statements as a result of various factors. The information contained herein may not be considered as economic, legal, tax or other advice and users are cautioned to base investment decisions or other decisions solely on the content hereof.


JOGS ETF investerar aktivt i small caps från hela världen

Nya ETF- och ETP-noteringar den 10 juni 2026 på Deutsche Börse

A1P0 ETF ger riktad exponering mot nästa generations artificiell intelligens
Interactive Brokers lanserar provisionsfria iShares ETFer från BlackRock genom Recurring Investment-funktionen i hela Europa

Nya ETF- och ETP-noteringar den 9 juni 2026 på Deutsche Börse

USA satsar 2 miljarder dollar på kvantdatorer – så kan investerare dra nytta av utvecklingen

De bästa ETFerna för att investera i emerging markets

Fastställd utdelning i MONTDIV maj 2026

Varför Plus500 är en dröm för finans-affiliate

Extrema skillnader: Varför presterar Europas kvantdator-ETFer så olika?
-
 Nyheter2 veckor sedan
USA satsar 2 miljarder dollar på kvantdatorer – så kan investerare dra nytta av utvecklingen
-
 Nyheter3 veckor sedan
De bästa ETFerna för att investera i emerging markets
-
 Nyheter3 veckor sedan
Fastställd utdelning i MONTDIV maj 2026
-
 Nyheter1 vecka sedan
Varför Plus500 är en dröm för finans-affiliate
-
 Nyheter1 vecka sedan
Extrema skillnader: Varför presterar Europas kvantdator-ETFer så olika?
-

 Nyheter3 veckor sedan
ASWF ETF är en aktivt förvaltad fond som investerar i Kanada
-

 Nyheter2 veckor sedan
21shares produkter nu finns tillgängliga hos Revolut
-

 Nyheter2 veckor sedan
Olja och Hormuzsundet fick flest sökningar i maj 2026