
Nyheter
When Will Commodities Recover?
When Will Commodities Recover? Commodities have been in a multi-year bear market, with especially sharp drops in the past year. As commodity investors, this begs the question: When will commodities bottom and begin to recover?
The history of markets suggests that an upward cycle in prices is inevitable. Putting aside the fact that the fundamentals, in general, may support a turnaround, if this is a traditional commodity cycle – and that is a big caveat – investors may continue to wonder when the mayhem will end. We believe that it could be reasonably soon.
Non-fundamental, or technical, analyses can be helpful for timing cycles. Markets often move regardless of what fundamentals may indicate. The third quarter was a prime example of this phenomenon. We saw a huge, sudden fall in commodity prices, but there were no material changes in global demand. Additionally, there was no significant change in China’s economic growth; China’s growth was slowing well before the third quarter and we believe this trend will continue.
Our Analyses Point to the First Half of 2016
Assuming this is a normal cycle, and unless commodity prices fall much further, most of our analyses suggest a bottom may occur during the first half of 2016, and most likely in the first quarter.
We examined two different indicators: the length of prior cycles and long-term price momentum.
1) Prior Commodity Cycles
First, we looked at commodity cycles historically, as shown below in Chart A. Prior cycles suggest to us that the end of March 2016 might be the time to start buying. Past commodity downturns have generally lasted approximately 18 months. We’re 11 to 12 months into the current downturn, and six months more bring us to March, or the end of the first quarter of 2016.
Chart A: Commodity Cycles Usually Last 18 Months
Measure: CRB Commodity Composite Price Index1

1See CRB Commodity Composite Price Index definition below.
Notes: Shaded areas are longer periods of falling commodity prices (> 10 months).
Source: Financial Times, Haver Analytics, Deutsche Bank Research. Data as of October 2015.
A Closer Look at Oil Prices
Let’s look specifically at historical oil prices. WTI crude oil returns are currently near historic lows as shown in Chart B below. The lows of trailing 18-month price returns for WTI have historically been tested at approximately -50%. We have already seen these levels this year: as recently as September, October, and November.
Taking a different perspective on oil, we note that price cycles generally last 15 months. The length of the current downturn is 15 months. At least one prior crude supply/oversupply cycle (1994-2003) suggests getting invested now.
Chart B: Oil Prices Don’t Typically Correct More than 50%
Measure: WTI Crude Oil Price Returns, Trailing 18 Months

Notes: Red Line at -50%: Lows have historically been tested at approximately -50%.
Dotted Yellow Line at -25%: Longest period of < -25%=”” trailing=”” return=”” is=”” 17=”” />
Average period of < -25%=”” trailing=”” return=”” is=”” 6=”” />
Current period of < -25%=”” trailing=”” return=”” is=”” approximately=”” 11=”” months=”” (nov.=”” 2014=”” to=”” />
Source: Bloomberg. Data as of September 30, 2015.
2) Long-Term Price Momentum
We also looked at a long-term commodities momentum signal: the 250-day moving average. This indicator signals a ”buy” when the current price is above the 250-day moving average. As shown below in Chart C, the Morningstar Long/Flat Commodity Index (which uses the 250-day moving average) currently is less than 2% invested/long exposure in commodities. Let’s look forward and assume two possible price scenarios: 1) a bullish scenario that assumes prices increase 20%; and 2) a flat scenario that assumes commodity prices stay at current levels. The bullish scenario indicates that the Morningstar Long/Flat Commodity Index signal would be more than 50% invested in commodities by April 2016. The flat scenario pushes this 50% invested date out to August 2016. If you are a bullish investor, we believe the time to invest is some time in the first quarter of 2016, well before the final signal in August should prices stay flat.
Chart C: Using a Longer-Term Signal to Get Reinvested in Commodities
Measure: Morningstar Long/Flat Commodity Index2

2See Morningstar Long/Flat Commodity Index definition below.
Notes: Calculation based on current commodity weightings in Index and uses each commodity’s 250-day moving average; Index weightings adjusted on third Friday of month.
Source: Morningstar, Van Eck Research. Data as of November 5, 2015.
Van Eck’s Approach
Here at Van Eck, we are generally bottom-up investors, i.e., we deal in fundamentals. More precisely, we focus most of our attention on companies that can provide shareholder return despite what the markets might be doing. Of course you cannot really escape the markets, but we focus on companies with quality management teams that have the potential to add value.
Supply Drives Markets, Not Demand
Similarly, when we look at commodity markets, we focus primarily on supply. We don’t believe demand drives markets. We think that supply drives markets and that analyzing supply is a bottom-up, fundamental exercise. We look at particular markets for commodities and whether supply will increase or decrease based on the behavior of suppliers and producers.
When it comes to timing cycles, however, fundamentals may not always be the best bet. We believe it makes sense to mix technical and fundamental analyses, and given our current findings, we believe you should give serious thought to allocating to commodities.
Video: Commodities Poised to Rebound in 2016
My colleague Roland Morris, Commodities Strategist, goes into greater depth on how the current supply dynamics in commodity markets are positioning the space for a likely rebound in 2016.
Van Eck Views Blog

November 25, 2015
by Jan van Eck, CEO
An innovator of investment solutions, Jan van Eck has created a multitude of strategies spanning international, emerging markets, and commodities opportunities. van Eck plays a very active role in helping to shape the firm’s mutual fund, ETF, and alternative investment offerings. As CEO, his approach is guided by the wisdom gained from the firm’s 60 year history.
Important Information For Foreign Investors
This document does not constitute an offering or invitation to invest or acquire financial instruments. The use of this material is for general information purposes.
Please note that Van Eck Securities Corporation offers actively managed and passively managed investment products that invest in the asset class(es) included in this material. Gold investments can be significantly affected by international economic, monetary and political developments. Gold equities may decline in value due to developments specific to the gold industry, and are subject to interest rate risk and market risk. Investments in foreign securities involve risks related to adverse political and economic developments unique to a country or a region, currency fluctuations or controls, and the possibility of arbitrary action by foreign governments, including the takeover of property without adequate compensation or imposition of prohibitive taxation.
Please note that Joe Foster is the Portfolio Manager of an actively managed gold strategy.
Any indices listed are unmanaged indices and include the reinvestment of all dividends, but do not reflect the payment of transaction costs, advisory fees or expenses that are associated with an investment in the Fund. An index’s performance is not illustrative of the Fund’s performance. Indices are not securities in which investments can be made.
1NYSE Arca Gold Miners Index (GDMNTR) is a modified market capitalization-weighted index comprised of publicly traded companies involved primarily in the mining for gold. 2Market Vectors Junior Gold Miners Index (MVGDXJTR) is a rules-based, modified market capitalization-weighted, float-adjusted index comprised of a global universe of publicly traded small- and medium-capitalization companies that generate at least 50% of their revenues from gold and/or silver mining, hold real property that has the potential to produce at least 50% of the company’s revenue from gold or silver mining when developed, or primarily invest in gold or silver. 3Tail risk is the risk of an asset or portfolio of assets moving more than three standard deviations from its current price. 4S&P 500® Index (S&P 500) consists of 500 widely held common stocks covering industrial, utility, financial, and transportation sectors. 5Dot-com bubble grew out of a combination of the presence of speculative or fad-based investing, the abundance of venture capital funding for startups and the failure of dotcoms to turn a profit. Investors poured money into internet startups during the 1990s in the hope that those companies would one day become profitable, and many investors and venture capitalists abandoned a cautious approach for fear of not being able to cash in on the growing use of the internet. 6Source: Bloomberg.
Please note that the information herein represents the opinion of the author and these opinions may change at any time and from time to time. Not intended to be a forecast of future events, a guarantee of future results or investment advice. Historical performance is not indicative of future results; current data may differ from data quoted. Current market conditions may not continue. Non-Van Eck Global proprietary information contained herein has been obtained from sources believed to be reliable, but not guaranteed. No part of this material may be reproduced in any form, or referred to in any other publication, without express written permission of Van Eck Global. ©2015 Van Eck Global.


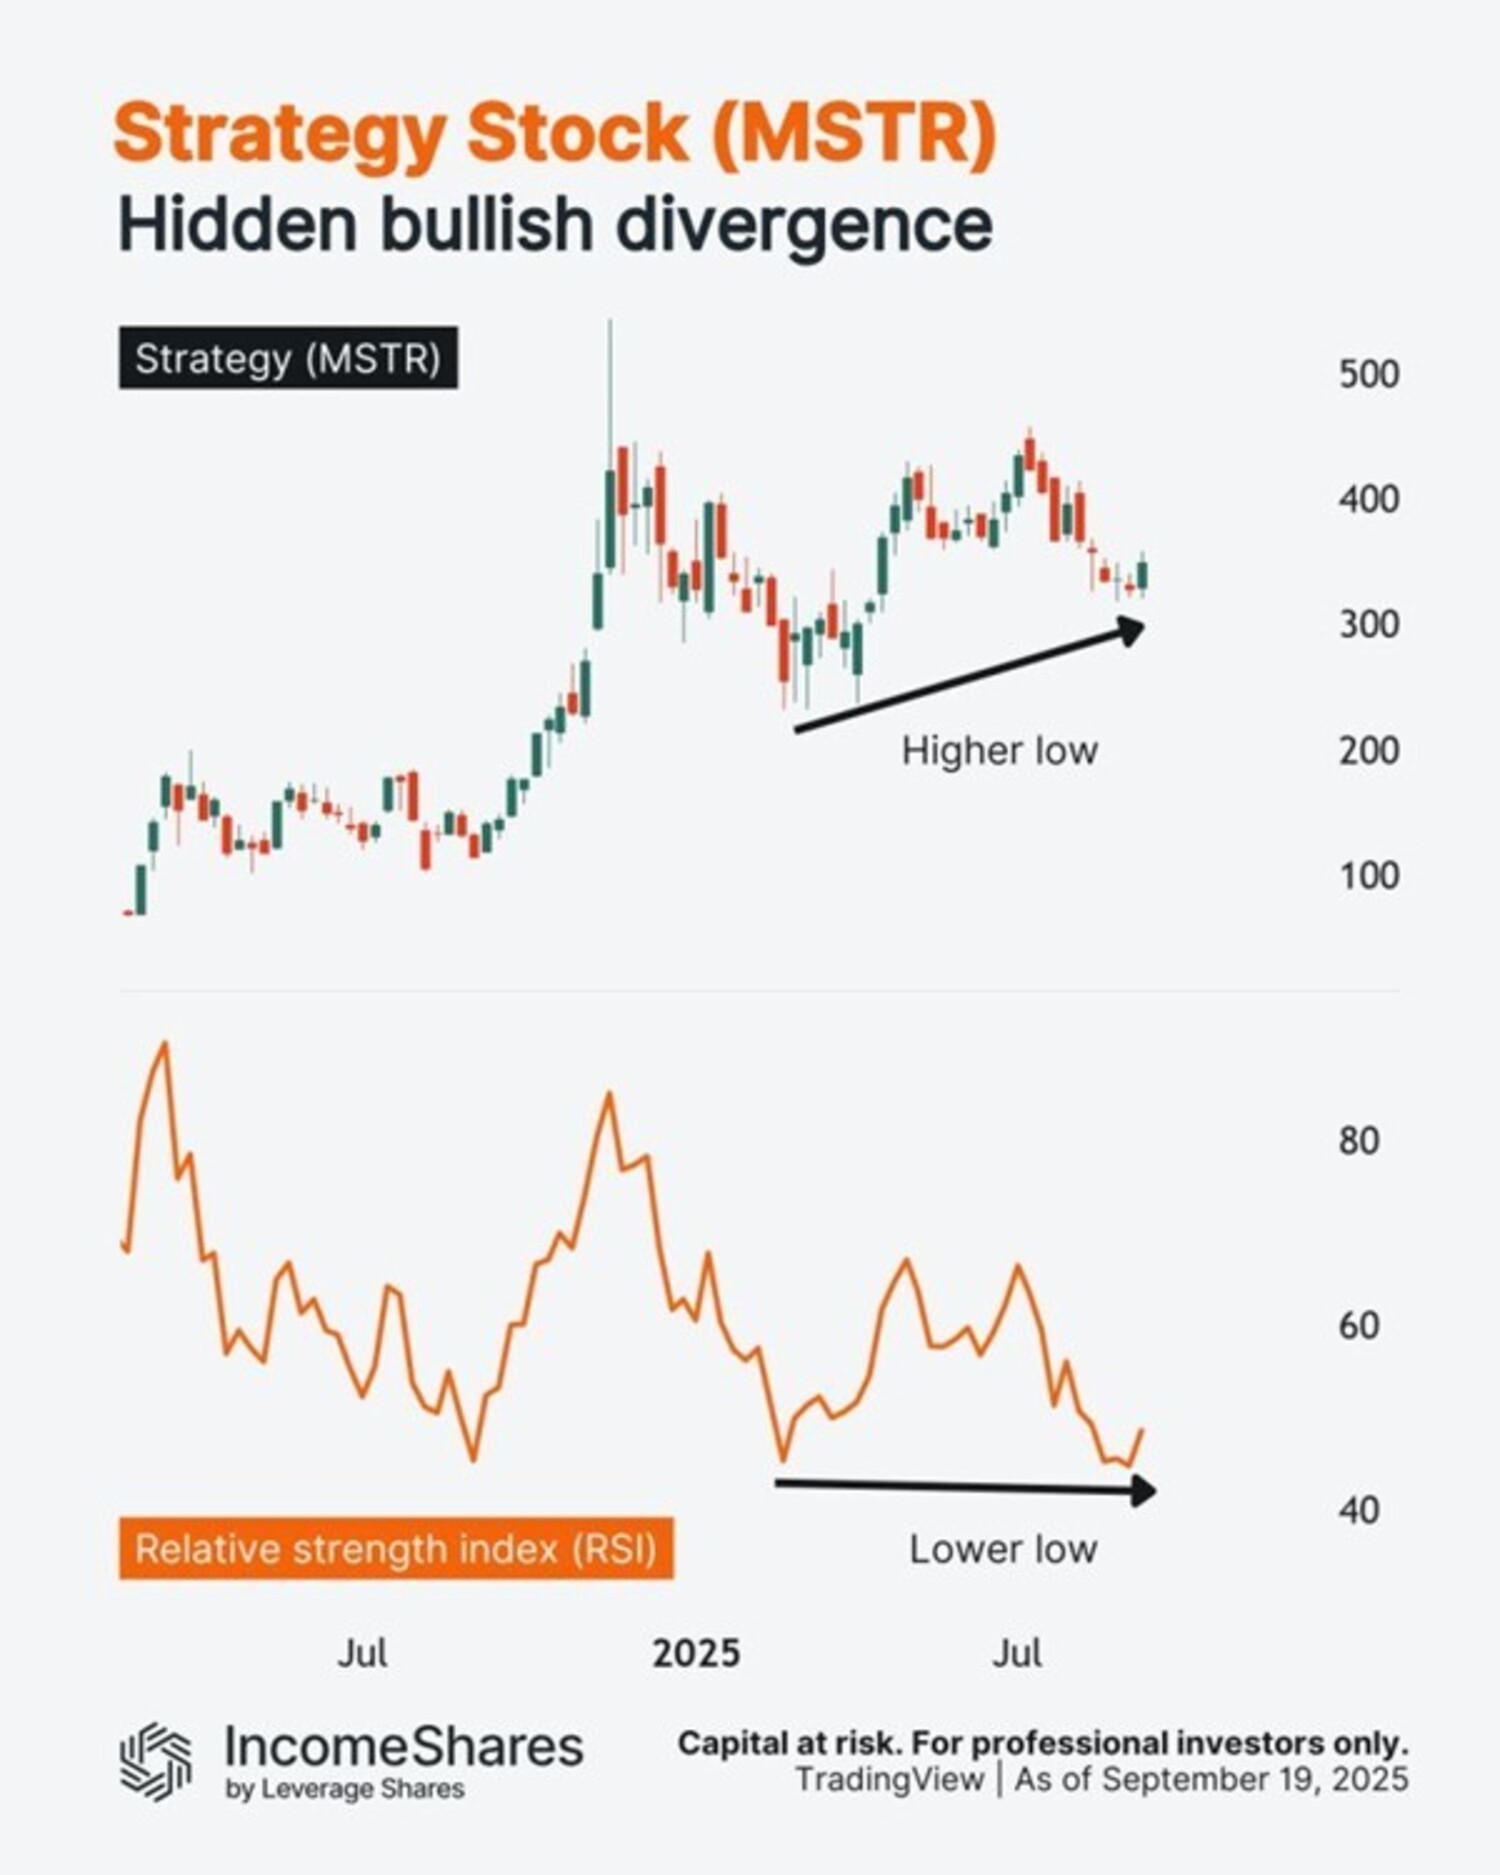
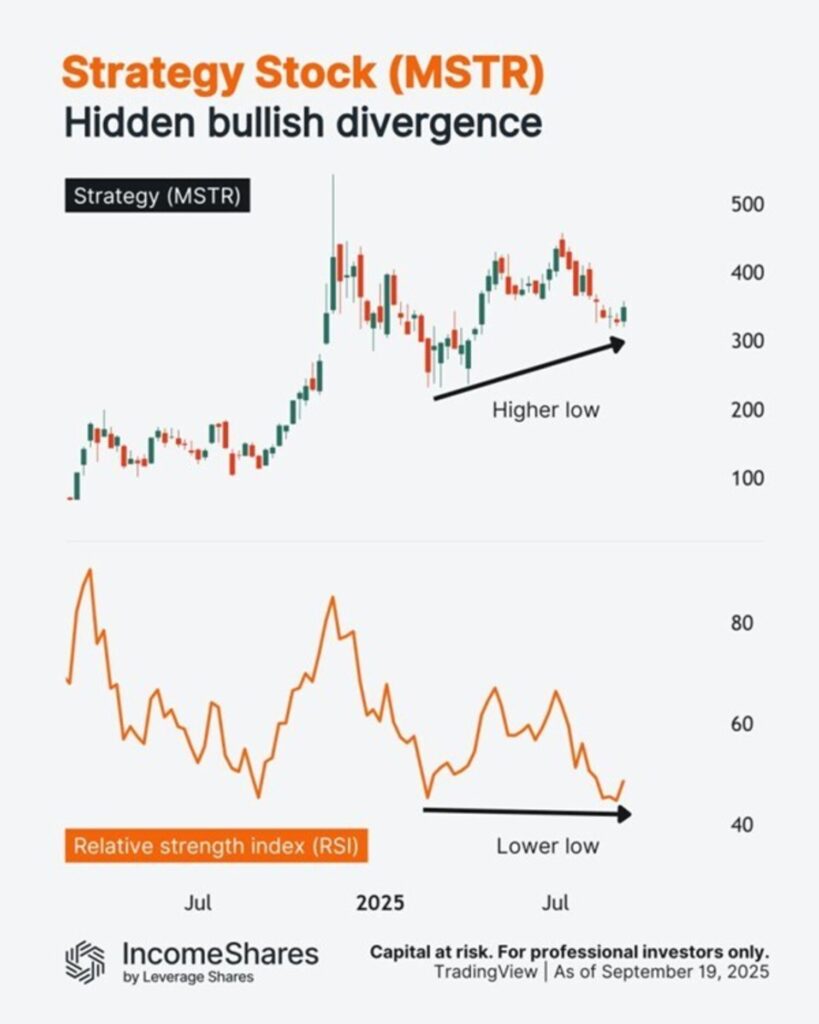
Strategy (MSTR) steg med cirka 5 % igår – och är nu upp cirka 10 % från sin ”botten” i september.
Hittills är det lägsta läget högre än det lägsta läget tidigare i år. Samtidigt kan RSI (relative strength index) potentiellt bilda ett lägre lägsta.
Den tekniska termen för detta är dold hausseartad divergens.
Så här fungerar det. RSI-linjen i diagrammet jämför de genomsnittliga vinsterna under ”uppåtgående veckor” med de genomsnittliga förlusterna under ”nedåtgående veckor” under de senaste 14 veckorna. Eftersom RSI nu är lägre betyder det att de genomsnittliga förlusterna har ökat i förhållande till de genomsnittliga vinsterna.
Med andra ord har säljtrycket ökat i ”relativ styrka” kontra köptryck (enligt indikatorn).
Men trots all denna säljstyrka har MSTR fortfarande stigit i pris totalt sett.
IncomeShares MicroStrategy Options ETP säljer säljoptioner på MSTR-aktier i syfte att generera månatlig inkomst. Den har också exponering mot aktiens prisrörelser.


ONCE ETP spårar den schweiziska dagslåneräntan och hedgas i euro

Strategy (MSTR) steg med cirka 5 %

7MAG ETP ger månatlig utdelning tack vare optioner

HANetfs VD kommenterar kärnkraftsavtalet mellan Storbritannien och USA

WMSE ETF en global momentumfond som handlas i euro och pund

Utdelningar och försvarsfonder lockade i augusti

Månadsutdelande ETFer uppdaterad med IncomeShares produkter

HANetfs analyserar hur ett fredsavtal kan påverka det europeiska försvaret

ADLT ETF investerar bara i riktigt långa amerikanska statsobligationer

Septembers utdelning i XACT Norden Högutdelande
-
 Nyheter3 veckor sedan
Utdelningar och försvarsfonder lockade i augusti
-
 Nyheter4 veckor sedan
Månadsutdelande ETFer uppdaterad med IncomeShares produkter
-
 Nyheter4 veckor sedan
HANetfs analyserar hur ett fredsavtal kan påverka det europeiska försvaret
-
 Nyheter4 veckor sedan
ADLT ETF investerar bara i riktigt långa amerikanska statsobligationer
-
 Nyheter2 veckor sedan
Septembers utdelning i XACT Norden Högutdelande
-

 Nyheter4 veckor sedan
Fastställd utdelning i MONTDIV augusti 2025
-

 Nyheter2 veckor sedan
HANetf kommenterar mötet mellan Kina, Ryssland och Nordkorea vid militärparad
-

 Nyheter4 veckor sedan
AICT ETF investerar i obligationer utgivna av företag från tillväxtmarknader