Ett kapitalviktat index är en typ av marknadsindex med enskilda komponenter eller värdepapper, viktade enligt deras totala börsvärde. Börsvärdet använder det totala marknadsvärdet av företagets utestående aktier. Beräkningen multiplicerar utestående aktier med det aktuella priset på en enda aktie. Utestående aktier är de som ägs av enskilda aktieägare, institutionella blockinnehav och innehav av företagsinsider.
Komponenterna med högre marknadsvärde har en högre viktprocent i indexet. Omvänt har komponenter med mindre marknadsvärde lägre vikter i indexet. Ett kapitalviktat index är också känt som ett marknadsvärderat index.
Kapitalviktat index
• Ett kapitalviktade index är en typ av marknadsindex med enskilda komponenter som viktas enligt deras totala börsvärde. • Komponenterna med högre marknadsvärde har en högre viktprocent i indexet. Omvänt har komponenter med mindre marknadsvärde lägre vikt i indexet. • Kritiker av kapitalviktade index kan hävda att överviktningen mot större företag ger en snedvridning av marknaden.
Förstå kapitalviktade index
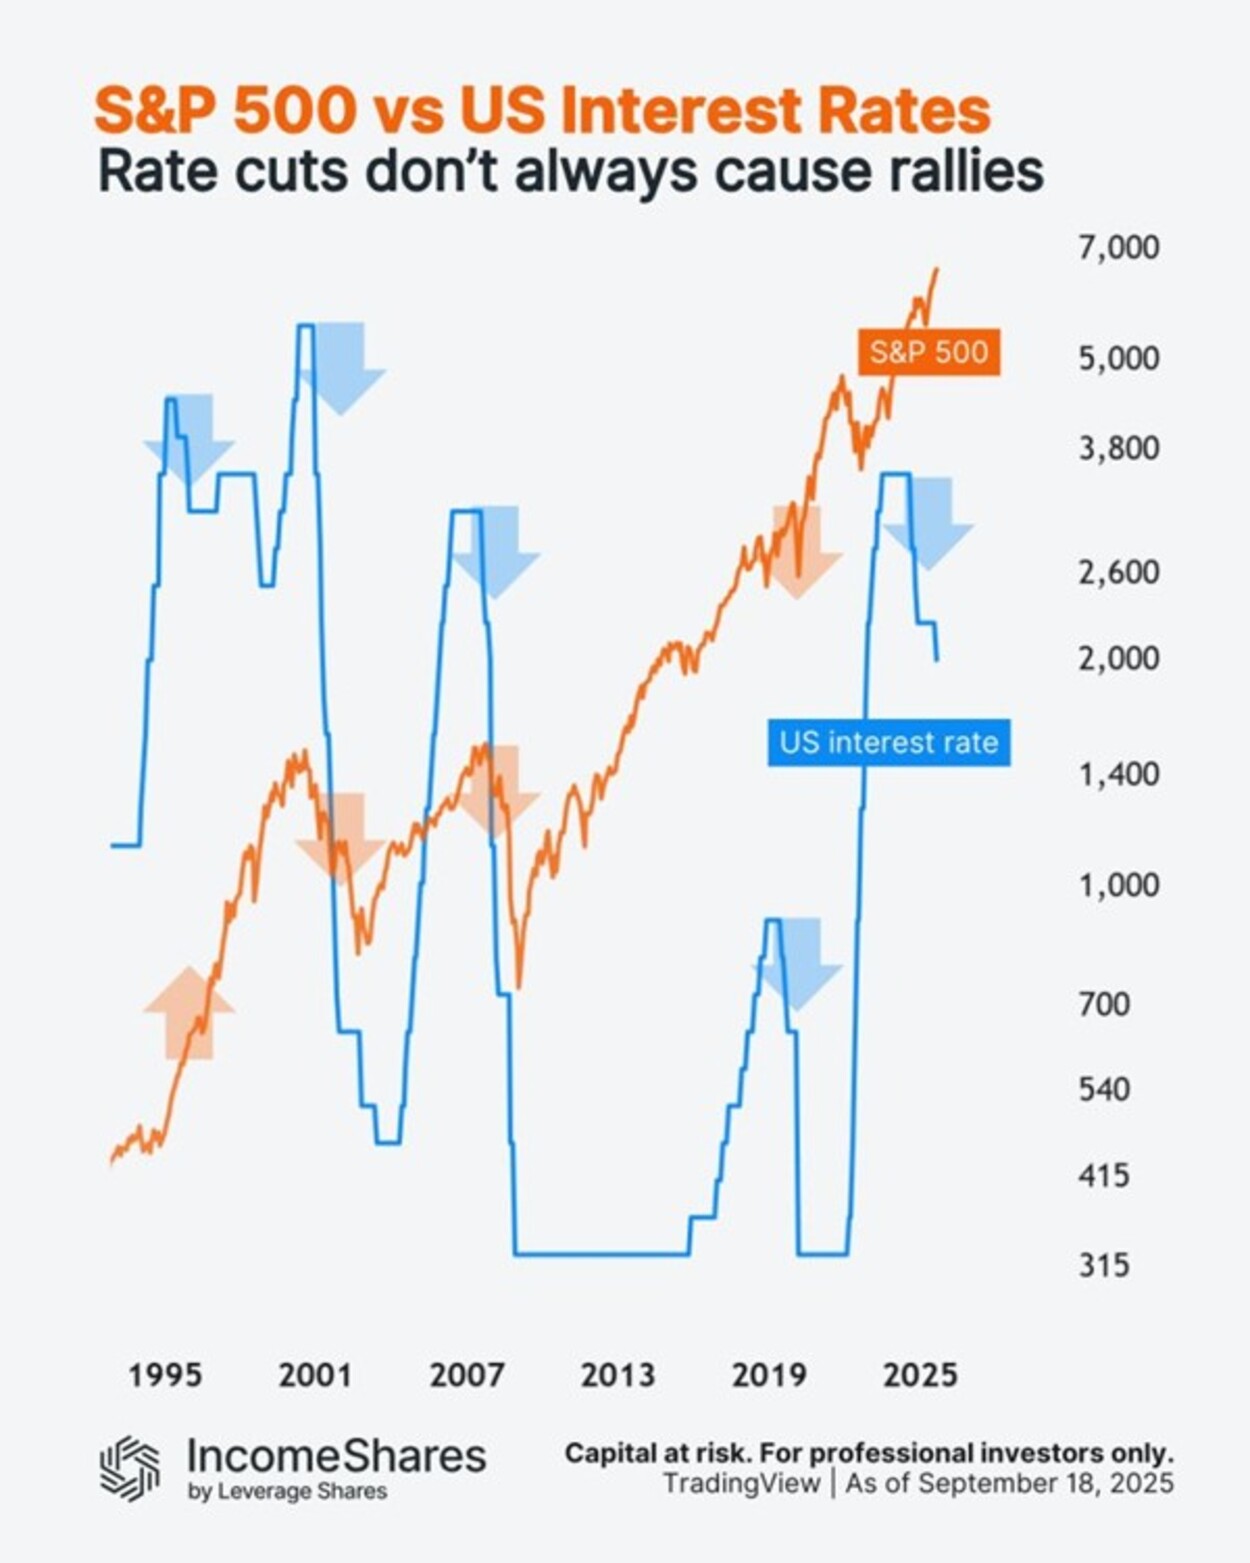
De flesta aktiemarknadsindex är kapitalviktade index, inklusive Standard and Poor’s (S&P) 500-index, Wilshire 5000 Total Market Index (TMWX) och Nasdaq Composite Index (IXIC). Marknadsindex ger investerare tillgång till en mängd olika företag, både stora och små.
Det kapitalviktade indexet använder ett aktiens börsvärde för att bestämma hur stor inverkan den aktuella aktien kan ha på det totala indexresultatet. Som nämnts tidigare kommer marknadsvärde eller marknadsvärde från värdet på utestående aktier. Investeringsgemenskapen använder denna siffra för att bestämma företagets storlek, i motsats till att använda försäljnings- eller totalsumman.
Som ett resultat, i sammansättningen eller sammansättningen av ett kapitalviktat index, kan stora rörelser i aktievärde för de största indexföretagen påverka värdet på det totala indexet betydligt. Eftersom stora företag med många utestående aktier tenderar att vara mer stabila intäktsproducenter kan de emellertid ge en stadig tillväxt för indexet. Å andra sidan tenderar små företag att ha en lägre vikt, vilket kan minska risken om företagen inte presterar bra.
Kritiker av de kapitalviktade indexen kan hävda att övervikt mot de större företagen ger en snedvridning av marknaden. De största företagen har emellertid också de största aktieägarbaserna, vilket gör det möjligt att ha en högre vikt i indexet.
Beräkning av ett kapitalviktat index
För att hitta värdet på ett kapitalviktat index kan vi multiplicera varje komponents marknadspris med dess totala utestående aktier för att nå det totala marknadsvärdet. Andelen av aktiens värde till det totala marknadsvärdet för indexkomponenterna ger företagets vikt i indexet. Tänk till exempel på följande fem företag:
• Företag A: 1 miljon utestående aktier, det aktuella priset per aktie motsvarar 45 USD • Företag B: 300 000 utestående aktier, det aktuella priset per aktie motsvarar 125 USD • Företag C: 500 000 utestående aktier, det aktuella priset per aktie motsvarar 60 USD • Företag D: 1,5 miljoner utestående aktier, det aktuella priset per aktie är 75 dollar • Företag E: 1,5 miljoner utestående aktier, det aktuella priset per aktie motsvarar 5 USD
Det totala marknadsvärdet för varje företag skulle beräknas som:
• Marknadsvärde för företag A = (1.000.000 x $ 45) = 45.000.000 $ • Marknadsvärde för företag B = (300 000 x 125 $) = 37 500 000 $ • Företags C marknadsvärde = (500 000 x $ 60) = $ 30 000 000 • Företags D marknadsvärde = (1 500 000 x 75 $) = 112 500 000 $ • Företags E marknadsvärde = (1 500 000 x 5 dollar) = 7 500 000 dollar
Hela marknadsvärdet på indexkomponenterna motsvarar 232,5 miljoner dollar med följande viktningar för varje företag:
• Företag A har en vikt på 19,4 procent (45,000,000 USD/232,5 miljoner USD) • Företag B har en vikt på 16,1 procent (37,500,000 USD/232,5 miljoner USD) • Företag C har en vikt på 12,9 procent (30,000,000 USD/232,5 miljoner USD) • Företag D har en vikt på 48,4 procent (112,500,000 USD/232,5 miljoner USD) • Företag E har en vikt på 3,2 procent (7500000 USD/232,5 miljoner USD)
Även om företagen D och E har lika många utestående aktier, 1 500 000, representerar de de högsta respektive lägsta vikterna i indexet, på grund av deras effekter på deras individuella marknadsvärden.
Nackdelen med kapitalviktade index
Med tiden kan företag växa i den utsträckning att de utgör en alltför stor vikt av ett index. När ett företag växer är indexdesigners skyldiga att allokera en större andel av företaget till indexet, vilket kan äventyra ett diversifierat index genom att lägga för mycket vikt på ett enskilt företags resultat.
Dessutom köper indexfonder eller börshandlade fonder ytterligare aktier i ett aktie när dess börsvärde ökar eller när aktiekursen ökar. Med andra ord, när aktiekursen stiger, köper fonderna fler aktier till de högre priserna, vilket kan vara kontraintuitivt för det investeringsmantra att köpa lågt och sälja högt.
Om ett företags aktier är övervärderade ur en grundläggande synpunkt kan inköp av aktien som dess börsvärde och prisökningar skapa en bubbla i aktiens pris. Som ett resultat kan köp av aktier baserade på marknadsvikten leda till en aktiemarknadsbubbla och öka risken för att bubblan spricker och skickar aktiekurser i fritt fall.
Fördelar
• Marknadsindex ger investerare tillgång till en mängd olika företag, både stora och små • Stora väletablerade företag har en större vikt som ger en stadig tillväxt för indexet • Små företag tenderar att ha en lägre vikt, vilket kan minska risken om företagen inte överlever
Nackdelar
• När ett aktiekurs stiger kan ett företag komma att få en alltför stor vikt i ett index • Företag med större vikt kan ha en oproportionerlig inverkan på indexets resultat • Fondförvaltare kan tvingas köpa aktier i övervärderade aktier som ger en större vikt och skapar en bubbla
Verkligt exempel
S&P 500 är ett vägt index med marknadsvärde som innehåller några av de mest väletablerade företagen i USA.
• Den 22 mars 2019 stängde Boeing Co. (BA) -2,83 procent till 362,17 USD medan Microsoft Corp (MSFT) stängde -2,64 procent till 117,05 USD för dagen. • Boeing hade ett marknadsvärde på 209 miljarder dollar och en vikt på mindre än 1 procent i S&P 500 den dagen. • Microsoft Corp. hade ett marknadsvärde på 909 miljarder dollar och en viktning på över 3 procent i S&P 500. • Som ett resultat hade Boeings prisnedgång en mindre påverkan på S&P 500 än Microsofts påverkan trots att båda aktierna minskade med nästan samma procentandel. • Med andra ord, Microsoft drog ner S&P 500 mer än Boeing för den dagen eftersom Microsoft hade ett större marknadsvärde än Boeing.
Det är viktigt att notera att marknadsvärderingarna förändras dagligen med företagens utestående aktier och deras priser, vilket resulterar i varierande påverkan på indexvärdet.
As April winds down, markets remain on edge, with escalating tariffs and renewed trade tensions keeping volatility in focus. In this summary of our full-length newsletter, we spotlight gold and gold equities, both of which have surged to record levels. We also take a step back from the day-to-day noise in crypto to explore the broader shifts in the regulatory landscape in our latest Whitepaper and present Celestia in detail. Finally, we assess how Moat indexes have held up and evolved amid the turbulence.
Gold & Gold mining equities tend to shine during stress periods
Source: VanEck, World Gold Council.
Gold has attracted renewed interest from investors amid concerns about inflation, currency volatility, and overall market uncertainty. Gold mining companies have recently reported improved profit margins and cash generation, with some initiating share buybacks and maintaining relatively strong balance sheets. Despite these developments, many continue to trade below their historical valuation averages.
While historical trends indicate that gold and gold mining equities have outperformed during certain periods of market stress, these patterns may not repeat under different economic conditions. Performance can be influenced by a range of factors including interest rates, central bank policy, geopolitical developments, and investor sentiment.
⚖️ Whitepaper Highlights: How New Crypto Regulations May Shape the Future
Cryptocurrencies are entering a new era. With the re-election of Donald Trump and the implementation of the European Union’s Markets in Crypto-Assets (MiCA) regulation, digital assets are moving into a landscape defined not just by innovation, but also by regulatory clarity.
MiCA’s structured and transparent approach aims to promote legitimacy, safeguard investors, and enhance trust in digital asset markets across Europe. It could also serve as a blueprint for other jurisdictions looking to regulate crypto effectively.
Most blockchains, like Ethereum or Bitcoin, are monolithic which means they perform all major functions (consensus, data availability, and execution) on a single layer. This design ensures security but according to new modular networks, limits scalability and flexibility.
The modular blockchain thesis, which Celestia is leading, proposes separation of layers and respective responsibilities in the network.
Note: This article in not accessible to our UK readers.
🌊 Riding the Gold Wave
Chasing the Vein: Fund Flows into Gold Miners
Source: Mining.com. Data as of 21 March 2025. Note: Data covers 493 funds with combined assets under management of $62 billion.
U.S. equity markets experienced significant declines during the month of March. Meanwhile, spot gold price recorded new all-time highs, surpassing the $3,000 per ounce mark on 14 March and closing at a record price of $3123.57 on March 31, a 9.30% ($265.73) monthly gain. As of 31 March, gold prices have risen by 93.61% over the past five years (1). Investors should keep in mind that past performance is not representative of future results.
The gold miners, as represented by the NYSE Arca Gold Miners Index (GDMNTR), outperformed significantly, up 15.51% during March (2). This gain reflects both their operational leverage to rising gold prices and market perceptions of relative value. However, gold miners can also be subject to heightened volatility, operational risks, and sensitivity to commodity price swings.
While gold and gold equities may serve as diversifiers in a portfolio due to their historically low correlations with many asset classes, investors should remain mindful of the inherent risks, including price volatility, currency movements, and shifts in investor sentiment that can lead to rapid reversals in performance.
Market turbulence in March weighed on stocks. The Moat Index was not immune to the market turmoil, as it declined along with the broad U.S. equity market ending the month lower. However, the Moat Index showed resilience relative to the S&P 500—thanks in part to defensive sector resilience and underweight exposure to mega-caps.
At the same time, the SMID Moat Index lagged small and mid-caps in March. Smaller U.S. stocks were also impacted by global trade tensions and economic growth concerns with the broad small- and mid-cap benchmarks falling during the month. However, year-to-date, the SMID Moat Index remains ahead of the broader small- and mid-cap markets.
(1) Source: World Gold Council, ICE Data Services, FactSet Research Systems Inc.
(2) Source: Financial Times.
IMPORTANT INFORMATION
This is marketing communication. Please refer to the prospectus of the UCITS and to the KID/KIID before making any final investment decisions. These documents are available in English and the KIDs/KIIDs in local languages and can be obtained free of charge at www.vaneck.com, from VanEck Asset Management B.V. (the “Management Company”) or, where applicable, from the relevant appointed facility agent for your country.
For investors in Switzerland: VanEck Switzerland AG, with registered office in Genferstrasse 21, 8002 Zurich, Switzerland, has been appointed as distributor of VanEck´s products in Switzerland by the Management Company. A copy of the latest prospectus, the Articles, the Key Information Document, the annual report and semi-annual report can be found on our website www.vaneck.com or can be obtained free of charge from the representative in Switzerland: Zeidler Regulatory Services (Switzerland) AG, Neudtadtgasse 1a, 8400 Winterthur, Switzerland. Swiss paying agent: Helvetische Bank AG, Seefeldstrasse 215, CH-8008 Zürich.
For investors in the UK: This is a marketing communication targeted to FCA regulated financial intermediaries. Retail clients should not rely on any of the information provided and should seek assistance from a financial intermediary for all investment guidance and advice. VanEck Securities UK Limited (FRN: 1002854) is an Appointed Representative of Sturgeon Ventures LLP (FRN: 452811), which is authorised and regulated by the Financial Conduct Authority (FCA) in the UK, to distribute VanEck´s products to FCA regulated firms such as financial intermediaries and Wealth Managers.
This information originates from VanEck (Europe) GmbH, which is authorized as an EEA investment firm under MiFID under the Markets in Financial Instruments Directive (“MiFiD). VanEck (Europe) GmbH has its registered address at Kreuznacher Str. 30, 60486 Frankfurt, Germany, and has been appointed as distributor of VanEck products in Europe by the Management Company. The Management Company is incorporated under Dutch law and registered with the Dutch Authority for the Financial Markets (AFM).
This material is only intended for general and preliminary information and shall not be construed as investment, legal or tax advice. VanEck (Europe) GmbH and its associated and affiliated companies (together “VanEck”) assume no liability with regards to any investment, divestment or retention decision on the basis of this information. The views and opinions expressed are those of the author(s) but not necessarily those of VanEck. Opinions are current as of the publication date and are subject to change with market conditions. Information provided by third party sources is believed to be reliable and have not been independently verified for accuracy or completeness and cannot be guaranteed.
Morningstar® Wide Moat Focus IndexSM, Morningstar® US Sustainability Moat Focus Index, Morningstar® US Small-Mid Cap Moat Focus IndexSM, and Morningstar® Global Wide Moat Focus IndexSM are trademarks or service marks of Morningstar, Inc. and have been licensed for use for certain purposes by VanEck. VanEck’s ETFs are not sponsored, endorsed, sold or promoted by Morningstar, and Morningstar makes no representation regarding the advisability of investing in the ETFs. Morningstar bears no liability with respect to the ETFs or any securities.
Effective December 15, 2023, the carbon risk rating screen was removed from the Morningstar® US Sustainability Moat Focus Index. Effective December 17, 2021, the Morningstar® Wide Moat Focus IndexTM was replaced with the Morningstar® US Sustainability Moat Focus Index. Effective June 20, 2016, Morningstar implemented several changes to the Morningstar® Wide Moat Focus Index construction rules. Among other changes, the index increased its constituent count from 20 stocks to at least 40 stocks and modified its rebalance and reconstitution methodology. These changes may result in more diversified exposure, lower turnover, and longer holding periods for index constituents than under the rules in effect prior to that date.
NYSE Arca Gold Miners Index is a service mark of ICE Data Indices, LLC or its affiliates (“ICE Data”) and has been licensed for use by VanEck UCITSETF plc (the “Fund”) in connection with the ETF. Neither the Fund nor the ETF is sponsored, endorsed, sold or promoted by ICE Data. ICE Data makes no representations or warranties regarding the Fund or the ETF or the ability of the NYSE Arca Gold Miners Index to track general stock market performance. ICE DATA MAKES NO EXPRESS OR IMPLIED WARRANTIES, AND HEREBY EXPRESSLY DISCLAIMS ALL WARRANTIES OF MERCHANTABILITY OR FITNESS FOR A PARTICULAR PURPOSE WITH RESPECT TO THE NYSE ARCA GOLD MINERS INDEX OR ANY DATA INCLUDED THEREIN. IN NO EVENT SHALL ICE DATA HAVE ANY LIABILITY FOR ANY SPECIAL, PUNITIVE, INDIRECT, OR CONSEQUENTIAL DAMAGES (INCLUDING LOST PROFITS), EVEN IF NOTIFIED OF THE POSSIBILITY OF SUCH DAMAGES. ICE Data Indices, LLC and its affiliates (“ICE Data”) indices and related information, the name “ICE Data”, and related trademarks, are intellectual property licensed from ICE Data, and may not be copied, used, or distributed without ICE Data’s prior written approval. The Fund has not been passed on as to its legality or suitability, and is not regulated, issued, endorsed’ sold, guaranteed, or promoted by ICE Data.
It is not possible to invest directly in an index.
Investing is subject to risk, including the possible loss of principal. Investors must buy and sell units of the UCITS on the secondary market via an intermediary (e.g. a broker) and cannot usually be sold directly back to the UCITS. Brokerage fees may incur. The buying price may exceed, or the selling price may be lower than the current net asset value. The indicative net asset value (iNAV) of the UCITS is available on Bloomberg. The Management Company may terminate the marketing of the UCITS in one or more jurisdictions. The summary of the investor rights is available in English at: complaints-procedure.pdf (vaneck.com). For any unfamiliar technical terms, please refer to ETF Glossary | VanEck.
No part of this material may be reproduced in any form, or referred to in any other publication, without express written permission of VanEck.
BBVA Acción Eurostoxx 50 ETF FI Cotizado Armonizado (BBVAE ETF) med ISIN ES0105321030, strävar efter att spåra EURO STOXX® 50-index. EURO STOXX® 50-indexet följer de 50 största företagen i euroområdet.
Den börshandlade fondens TER (total cost ratio) uppgår till 0,20 % p.a. ETFen replikerar resultatet av det underliggande indexet genom full replikering (köper alla indexbeståndsdelar). Utdelningarna i ETFen delas ut till investerarna (halvårsvis).
BBVA Acción Eurostoxx 50 ETF FI Cotizado Armonizado har tillgångar på 133 miljoner euro under förvaltning. Denna ETF lanserades den 3 oktober 2006 och har sin hemvist i Spanien.
Beskrivning BBVA Acción Eurostoxx 50 ETF FI Cotizado Armonizado
Med BBVA Acción Eurostoxx 50 ETF FI Cotizado Armonizado deltar investerare i ökningen av värdet på aktierna i de 50 största konglomeraten i euroområdet (euroområdet). Euro Stoxx 50-indexet inkluderar aktier från 8 länder i euroområdet: Belgien, Finland, Frankrike, Tyskland, Irland, Italien, Nederländerna och Spanien.
Explore Dogecoin’s impact on crypto, turning internet memes into cultural and financial assets.
𝕋𝕚𝕞𝕖 ℂ𝕠𝕕𝕖𝕤:
00:00 – Intro
00:27 – Where do Memes come from?
03:13 – What are some of the first Memes you remember?
10:28 – Do these things have value?
14:04 – The different types of cryptocurrencies
17:20 – How did Dogecoin start?
24:26 – What is some of the utility?
28:36 – How does it fit into the portfolio?
30:38 – Final thoughts
Research Newsletter
Each week the 21Shares Research team will publish our data-driven insights into the crypto asset world through this newsletter. Please direct any comments, questions, and words of feedback to research@21shares.com
Disclaimer
The information provided does not constitute a prospectus or other offering material and does not contain or constitute an offer to sell or a solicitation of any offer to buy securities in any jurisdiction. Some of the information published herein may contain forward-looking statements. Readers are cautioned that any such forward-looking statements are not guarantees of future performance and involve risks and uncertainties and that actual results may differ materially from those in the forward-looking statements as a result of various factors. The information contained herein may not be considered as economic, legal, tax or other advice and users are cautioned to base investment decisions or other decisions solely on the content hereof.