Följ oss

Nyheter

Uranium Bull Market: Ska juniora gruvbolag vara på din radar?

Publicerad

den

gruvbolag För nästan 70 år sedan, i Shippingport, Pennsylvania, började världens första kärnkraftverk producera elektricitet. Detta kraftverk hade en relativt liten effekt och kunde producera bara 60 megawatt kraft. Det är förvärrat av moderna kärnkraftverk, som Bruce Nuclear Generating Station i Kanada, med förmågan att producera 6550 megawatt. Men den lilla kärnkraften i Pennsylvania visade att uran kunde utnyttjas för att producera riklig och pålitlig elektricitet. Den så kallade atomåldern hade börjat.

För nästan 70 år sedan, i Shippingport, Pennsylvania, började världens första kärnkraftverk producera elektricitet. Detta kraftverk hade en relativt liten effekt och kunde producera bara 60 megawatt kraft. Det är förvärrat av moderna kärnkraftverk, som Bruce Nuclear Generating Station i Kanada, med förmågan att producera 6550 megawatt. Men den lilla kärnkraften i Pennsylvania visade att uran kunde utnyttjas för att producera riklig och pålitlig elektricitet. Den så kallade atomåldern hade börjat.

Men sedan vacklade det. Medan kärnkraften åtnjöt växande stöd på 1970-talet, särskilt mot bakgrund av OPECs oljeembargo, gick användandet ner i slutet av århundradet. Kärnenergi som andel av global elektricitet nådde en topp på 17,6 procent i slutet av 1990-talet, och sjönk till cirka 10 procent. I USA har den andelen sjunkit från cirka 20 procent på 1990-talet till cirka 18 procent idag. Atomåldern verkar aldrig riktigt komma igång.

Nu, med de dubbla hoten om klimatförändringar och energisäkerhet, kan kärnenergin nu befinna sig vid en vändpunkt. Vid COP 28 såg vi 22 länder, inklusive USA och Storbritannien, förbinda sig att tredubbla sin kärnenergikapacitet till 2050. Detta är på baksidan av en växande konsensus om att kärnkraft är avgörande för alla möjliga vägar till nettonoll. Kärnenergi producerar nästan inga koldioxidutsläpp, samtidigt som man undviker intermittensproblem som fortfarande plågar förnybara energiformer. Medan sol och vind kommer att spela en roll för att minska koldioxidutsläppen av elnät, kommer kärnenergi att krävas för pålitlig baslastgenerering.

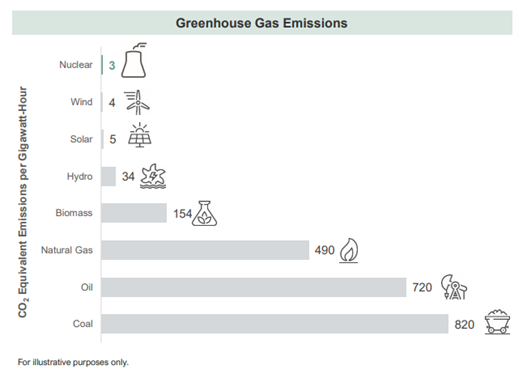
Källa: Energy.gov. Mäter CO2-ekvivalent per gigawattimme el under ett kraftverks livscykel.

När det gäller energisäkerhet sticker kärnkraften ut. Till skillnad från de flesta energikällor kommer kärnkraft normalt att ha två års bränsle lagrat på plats.

Som ett resultat är kärnkraften mycket mindre sårbar för störningar i bränsletillförseln. Efter invasionen av Ukraina valde Europa bort rysk gas, vilket resulterade i energiprisstopp. Detta gör kärnkraften mycket tilltalande. Samtidigt utgör kostnaden för kärnenergibränsle – uran – en relativt liten del av driftkostnaderna för ett kärnkraftverk. Som ett resultat är kärnkraften mycket mindre sårbar för prischocker jämfört med olja och gas.

Vad betyder denna kärnkraftsrenässans för investerare?

Denna förväntade utbyggnad av kärnkraft sammanfaller med relativt låga nivåer av uranproduktion. Försörjningen av primära uranbolag är avsevärt sämre efterfrågan, med ett förutspått kumulativt utbudsunderskott på cirka 1,5 miljarder pound till 2040.

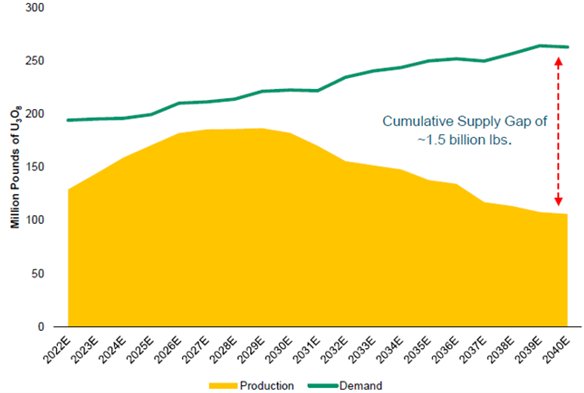
Källor: UxC LLC. Data från Q2 2023. World Nuclear Association per 8/1/2023. Ingår endast i illustrativt syfte.

Vi har också sett Kazatomprom, världens största uranproducent, minska sin prognostiserade produktion för 2024 med 14 procent. Företaget noterade också att det sannolikt skulle missa sina prognostiserade produktioner för 2025.

Med tanke på dessa utbuds- och efterfrågedynamik har spotpriset på uran stigit. År 2023 gick priset på ett pound uran från 48 dollar till 91 dollar, medan priset 2024 översteg 106 dollar per pound.

Som ett resultat kan uranbolag vara redo att generera högre intäkter och potentiella vinster när gruvproduktionen ökar. Medan uranbolag 2023 släpade efter spotprisets utveckling, har gruvbolag historiskt sett presterat bättre.

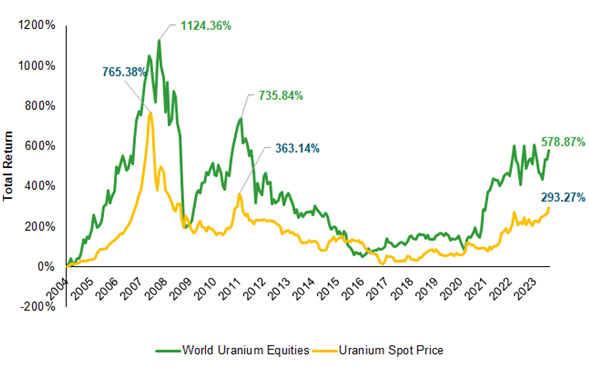
Källor: Bloomberg och TradeTech LLC. Data från 2004-01-30 till 2023-06-30 återspeglar de längsta tillgängliga uppgifterna. World Uranium Equities mäts av URAX Index, som spårar utvecklingen för aktier globalt som bedriver affärer med uran. URAX och Uranium Spot är denominerade i amerikanska dollar. Du kan inte investera direkt i ett index. Ingår endast i illustrativt syfte.

I synnerhet finns det ett växande intresse för möjligheterna för mindre bolag – eller ”juniora” – urangruvbolag. Med uranpriserna nu runt 100 dollar per pound, blir det ekonomiskt för många av dessa nya producenter att antingen börja eller starta om produktionen. Samtidigt kan yngre gruvbolag ha bättre förutsättningar att delta i ökningen av uranpriserna. Även om många av de större producenterna har kontrakterat sin framtida produktion till historiskt lägre priser, är det ofta inte fallet för de yngre gruvbolagen. Produktionen från de mindre producenterna har potential att säljas in på marknaden med högre priser.

Kommer uranmarknaden att stabiliseras?

Som med all gruvdrift och all material är uran teoretiskt cykliskt. Högre priser skickar en signal till producenterna att öka produktionen, vilket i sin tur får priserna tillbaka. Även om denna cykliska dynamik har potential att spela ut på längre sikt, kommer utbudsökningar inte att komma snabbt eller lätt. Som vi redan har noterat kämpar världens största producent, Kazatomprom, för att nå sin prognostiserade produktion för både i år och nästa. Samtidigt kommer det att ta år för nya storskaliga gruvprojekt att börja ge leverans. Som Cantor Fitzgerald noterar:

”Nästa kohort av nya storskaliga urangruvor förväntas inte komma på nätet förrän under tidsperioden 2028-2030. Detta schema är tillstånds-/byggtidslinjeberoende och kan inte dras framåt oavsett uranpris.”

Som ett resultat har uranpriserna potential att öka ytterligare.

Alternativt, när priset på en vara fortfarande är relativt knapphändigt, med höga priser och utbudet inte kan öka, ser vi ibland ”efterfrågedestruktion”. Slutanvändare antingen upphör med driften eller byter till alternativ. Risken att detta händer för uran tror vi är relativt låg. Som nämnts ovan är kärnenergi avgörande för att uppnå nettonoll och energisäkerhet.

Samtidigt kan kärnkraftverken absorbera dessa högre kostnader. Som nämnts ovan står uran för cirka 4-8 procent av ett kärnkraftverks löpande kostnader. Det gör kärnbränsleköpare prisagnostiska. Som Ocean Wall noterar:

– Bränsleköparen vid kärnkraftverket kommer aldrig att hamna i problem för det pris de betalar för uran, utan istället för att inte säkra tillgången på det. För världens kärnkraftverk är uran helt prisoelastiskt – de måste ha det.”

Priset på uran, tillsammans med urangruvarbetare, är därför potentiellt positionerat för stark uppskattning, eftersom efterfrågan fortsätter att stiga på en marknad som står inför svåra utbudsbegränsningar.

Handla U8NJ ETF

Sprott Junior Uranium Miners UCITS ETF (U8NJ) är en europeisk börshandlad fond. Denna fond handlas på flera olika börser, till exempel Deutsche Boerse Xetra och London Stock Exchange.

Det betyder att det går att handla andelar i denna ETF genom de flesta svenska banker och Internetmäklare, till exempel DEGIRONordnet, Aktieinvest och Avanza.

Handla U3O8 ETF

HANetf Sprott Uranium Miners UCITS ETF Acc (U3O8 ETF) är en europeisk börshandlad fond. Denna fond handlas på flera olika börser, till exempel Borsa Italiana, Deutsche Boerse Xetra och London Stock Exchange. Av den anledningen förekommer olika kortnamn på samma börshandlade fond.

Det betyder att det går att handla andelar i denna ETF genom de flesta svenska banker och Internetmäklare, till exempel DEGIRONordnet, Aktieinvest och Avanza.

Denna text är skriven av Tom Bailey, Head of Research at HANetf. Den har översatts och publicerats på etfmarknaden.se i samarbete med HANetf.
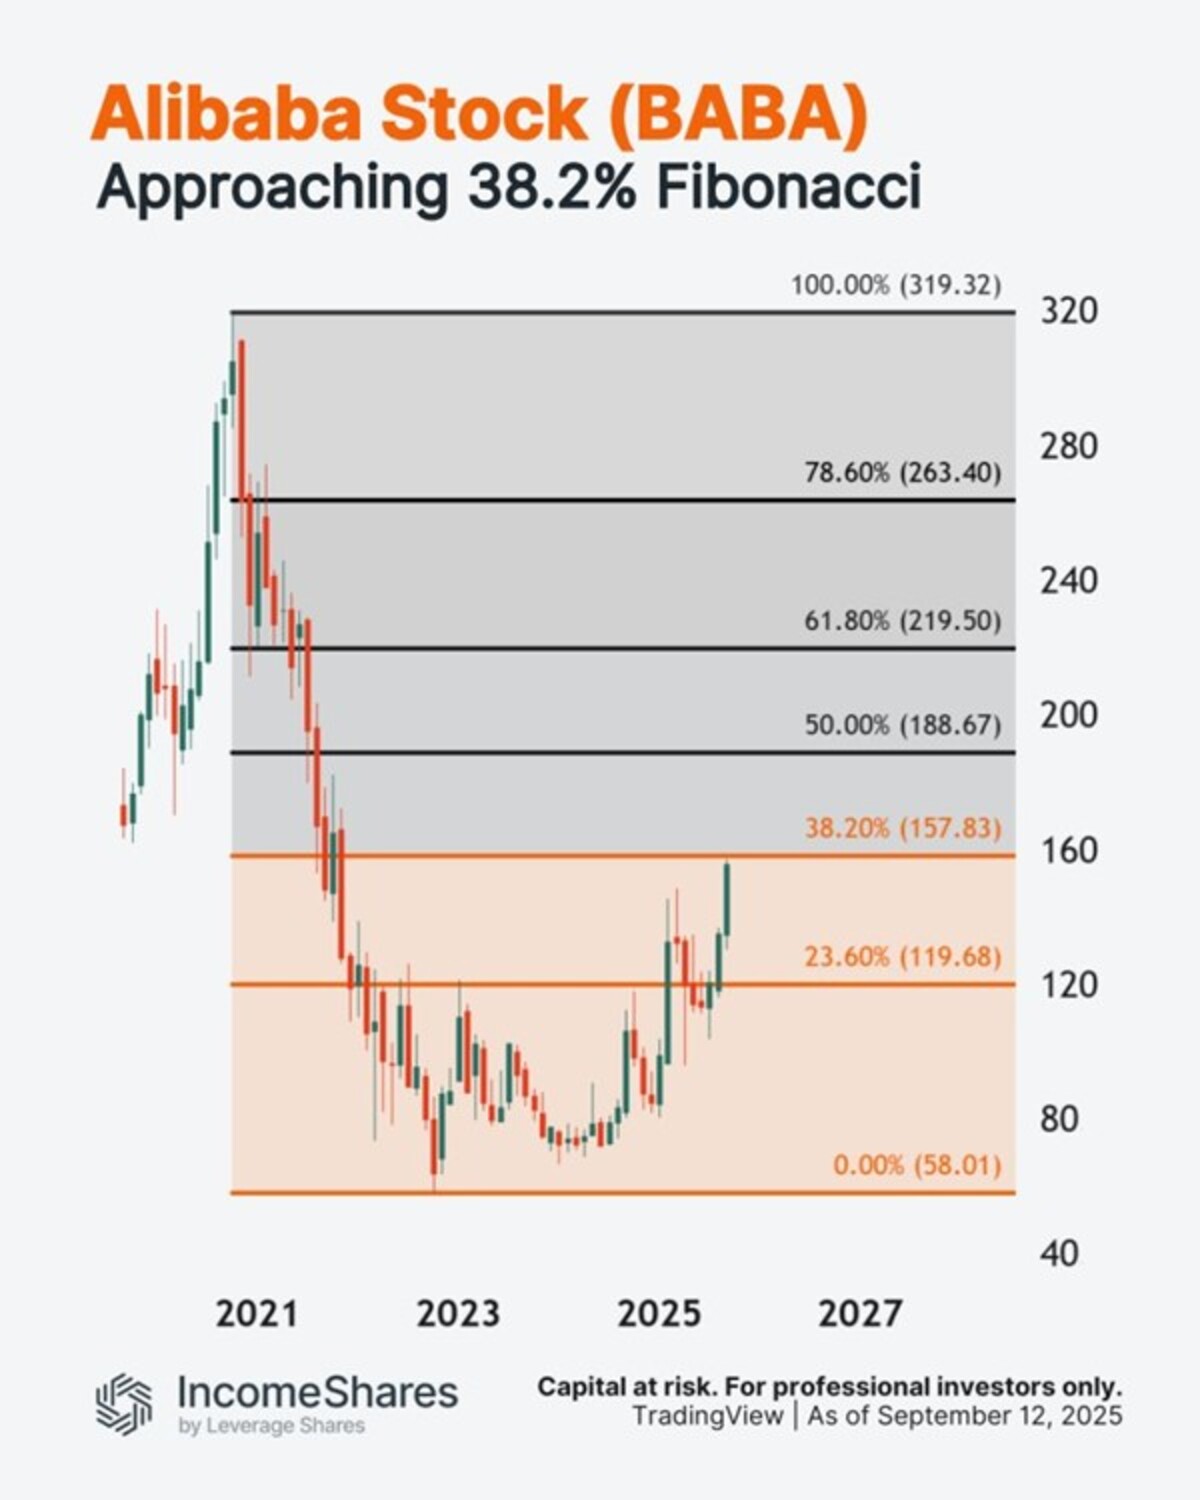
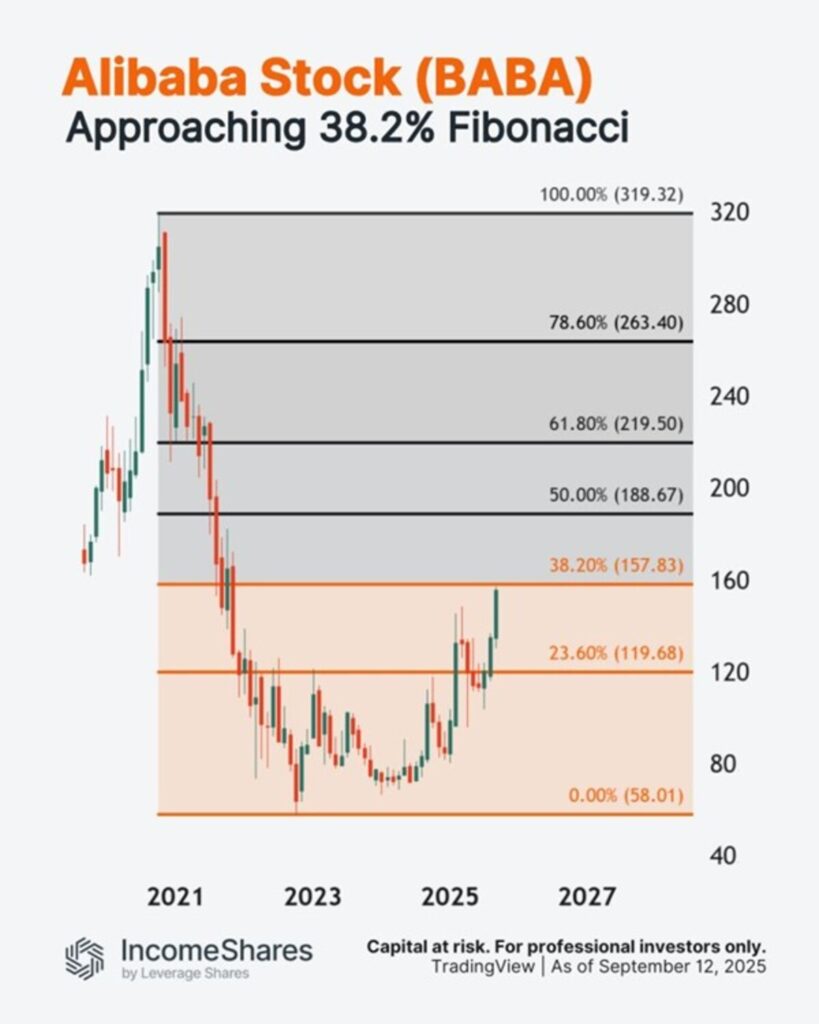
Fortsätt läsa
Annons
Klicka för att kommentera

Skriv en kommentar

Din e-postadress kommer inte publiceras. Obligatoriska fält är märkta *

Nyheter

April in ETFs: Gold at New Highs, Crypto in Transition, and Moat Index Holding Steady

Publicerad

den

As April winds down, markets remain on edge, with escalating tariffs and renewed trade tensions keeping volatility in focus. In this summary of our full-length newsletter, we spotlight gold and gold equities, both of which have surged to record levels. We also take a step back from the day-to-day noise in crypto to explore the broader shifts in the regulatory landscape in our latest Whitepaper and present Celestia in detail. Finally, we assess how Moat indexes have held up and evolved amid the turbulence.

As April winds down, markets remain on edge, with escalating tariffs and renewed trade tensions keeping volatility in focus. In this summary of our full-length newsletter, we spotlight gold and gold equities, both of which have surged to record levels. We also take a step back from the day-to-day noise in crypto to explore the broader shifts in the regulatory landscape in our latest Whitepaper and present Celestia in detail. Finally, we assess how Moat indexes have held up and evolved amid the turbulence.

Your VanEck Europe team wishes you a great read.


Featured Articles

🥇 Are Gold Mining Equities Regaining Attention Amid Rising Gold Prices?

Gold & Gold mining equities tend to shine during stress periods

Source: VanEck, World Gold Council.

Gold has attracted renewed interest from investors amid concerns about inflation, currency volatility, and overall market uncertainty. Gold mining companies have recently reported improved profit margins and cash generation, with some initiating share buybacks and maintaining relatively strong balance sheets. Despite these developments, many continue to trade below their historical valuation averages.

While historical trends indicate that gold and gold mining equities have outperformed during certain periods of market stress, these patterns may not repeat under different economic conditions. Performance can be influenced by a range of factors including interest rates, central bank policy, geopolitical developments, and investor sentiment.

→ Read more

⚖️ Whitepaper Highlights: How New Crypto Regulations May Shape the Future

Cryptocurrencies are entering a new era. With the re-election of Donald Trump and the implementation of the European Union’s Markets in Crypto-Assets (MiCA) regulation, digital assets are moving into a landscape defined not just by innovation, but also by regulatory clarity.

MiCA’s structured and transparent approach aims to promote legitimacy, safeguard investors, and enhance trust in digital asset markets across Europe. It could also serve as a blueprint for other jurisdictions looking to regulate crypto effectively.

→ Read the Whitepaper Highlights

⛓️ Introduction to Celestia

Most blockchains, like Ethereum or Bitcoin, are monolithic which means they perform all major functions (consensus, data availability, and execution) on a single layer. This design ensures security but according to new modular networks, limits scalability and flexibility.

The modular blockchain thesis, which Celestia is leading, proposes separation of layers and respective responsibilities in the network.

→ Read more

Note: This article in not accessible to our UK readers.

🌊 Riding the Gold Wave

Chasing the Vein: Fund Flows into Gold Miners

Source: Mining.com. Data as of 21 March 2025. Note: Data covers 493 funds with combined assets under management of $62 billion.

U.S. equity markets experienced significant declines during the month of March. Meanwhile, spot gold price recorded new all-time highs, surpassing the $3,000 per ounce mark on 14 March and closing at a record price of $3123.57 on March 31, a 9.30% ($265.73) monthly gain. As of 31 March, gold prices have risen by 93.61% over the past five years (1). Investors should keep in mind that past performance is not representative of future results.

The gold miners, as represented by the NYSE Arca Gold Miners Index (GDMNTR), outperformed significantly, up 15.51% during March (2). This gain reflects both their operational leverage to rising gold prices and market perceptions of relative value. However, gold miners can also be subject to heightened volatility, operational risks, and sensitivity to commodity price swings.

While gold and gold equities may serve as diversifiers in a portfolio due to their historically low correlations with many asset classes, investors should remain mindful of the inherent risks, including price volatility, currency movements, and shifts in investor sentiment that can lead to rapid reversals in performance.

→ Read more

🌪️ Moat Stocks Weather Tariff Tumble

Market turbulence in March weighed on stocks. The Moat Index was not immune to the market turmoil, as it declined along with the broad U.S. equity market ending the month lower. However, the Moat Index showed resilience relative to the S&P 500—thanks in part to defensive sector resilience and underweight exposure to mega-caps.

At the same time, the SMID Moat Index lagged small and mid-caps in March. Smaller U.S. stocks were also impacted by global trade tensions and economic growth concerns with the broad small- and mid-cap benchmarks falling during the month. However, year-to-date, the SMID Moat Index remains ahead of the broader small- and mid-cap markets.

→ Read more


This is a preview of our monthly ETF insights email newsletter.

To receive the full version, sign up here.


(1) Source: World Gold Council, ICE Data Services, FactSet Research Systems Inc.

(2) Source: Financial Times.

IMPORTANT INFORMATION

This is marketing communication. Please refer to the prospectus of the UCITS and to the KID/KIID before making any final investment decisions. These documents are available in English and the KIDs/KIIDs in local languages and can be obtained free of charge at www.vaneck.com, from VanEck Asset Management B.V. (the “Management Company”) or, where applicable, from the relevant appointed facility agent for your country.

For investors in Switzerland: VanEck Switzerland AG, with registered office in Genferstrasse 21, 8002 Zurich, Switzerland, has been appointed as distributor of VanEck´s products in Switzerland by the Management Company. A copy of the latest prospectus, the Articles, the Key Information Document, the annual report and semi-annual report can be found on our website www.vaneck.com or can be obtained free of charge from the representative in Switzerland: Zeidler Regulatory Services (Switzerland) AG, Neudtadtgasse 1a, 8400 Winterthur, Switzerland. Swiss paying agent: Helvetische Bank AG, Seefeldstrasse 215, CH-8008 Zürich.

For investors in the UK: This is a marketing communication targeted to FCA regulated financial intermediaries. Retail clients should not rely on any of the information provided and should seek assistance from a financial intermediary for all investment guidance and advice. VanEck Securities UK Limited (FRN: 1002854) is an Appointed Representative of Sturgeon Ventures LLP (FRN: 452811), which is authorised and regulated by the Financial Conduct Authority (FCA) in the UK, to distribute VanEck´s products to FCA regulated firms such as financial intermediaries and Wealth Managers.

This information originates from VanEck (Europe) GmbH, which is authorized as an EEA investment firm under MiFID under the Markets in Financial Instruments Directive (“MiFiD). VanEck (Europe) GmbH has its registered address at Kreuznacher Str. 30, 60486 Frankfurt, Germany, and has been appointed as distributor of VanEck products in Europe by the Management Company. The Management Company is incorporated under Dutch law and registered with the Dutch Authority for the Financial Markets (AFM).

This material is only intended for general and preliminary information and shall not be construed as investment, legal or tax advice. VanEck (Europe) GmbH and its associated and affiliated companies (together “VanEck”) assume no liability with regards to any investment, divestment or retention decision on the basis of this information. The views and opinions expressed are those of the author(s) but not necessarily those of VanEck. Opinions are current as of the publication date and are subject to change with market conditions. Information provided by third party sources is believed to be reliable and have not been independently verified for accuracy or completeness and cannot be guaranteed.

Morningstar® Wide Moat Focus IndexSM, Morningstar® US Sustainability Moat Focus Index, Morningstar® US Small-Mid Cap Moat Focus IndexSM, and Morningstar® Global Wide Moat Focus IndexSM are trademarks or service marks of Morningstar, Inc. and have been licensed for use for certain purposes by VanEck. VanEck’s ETFs are not sponsored, endorsed, sold or promoted by Morningstar, and Morningstar makes no representation regarding the advisability of investing in the ETFs. Morningstar bears no liability with respect to the ETFs or any securities.

Effective December 15, 2023, the carbon risk rating screen was removed from the Morningstar® US Sustainability Moat Focus Index. Effective December 17, 2021, the Morningstar® Wide Moat Focus IndexTM was replaced with the Morningstar® US Sustainability Moat Focus Index. Effective June 20, 2016, Morningstar implemented several changes to the Morningstar® Wide Moat Focus Index construction rules. Among other changes, the index increased its constituent count from 20 stocks to at least 40 stocks and modified its rebalance and reconstitution methodology. These changes may result in more diversified exposure, lower turnover, and longer holding periods for index constituents than under the rules in effect prior to that date.

NYSE Arca Gold Miners Index is a service mark of ICE Data Indices, LLC or its affiliates (“ICE Data”) and has been licensed for use by VanEck UCITS ETF plc (the “Fund”) in connection with the ETF. Neither the Fund nor the ETF is sponsored, endorsed, sold or promoted by ICE Data. ICE Data makes no representations or warranties regarding the Fund or the ETF or the ability of the NYSE Arca Gold Miners Index to track general stock market performance. ICE DATA MAKES NO EXPRESS OR IMPLIED WARRANTIES, AND HEREBY EXPRESSLY DISCLAIMS ALL WARRANTIES OF MERCHANTABILITY OR FITNESS FOR A PARTICULAR PURPOSE WITH RESPECT TO THE NYSE ARCA GOLD MINERS INDEX OR ANY DATA INCLUDED THEREIN. IN NO EVENT SHALL ICE DATA HAVE ANY LIABILITY FOR ANY SPECIAL, PUNITIVE, INDIRECT, OR CONSEQUENTIAL DAMAGES (INCLUDING LOST PROFITS), EVEN IF NOTIFIED OF THE POSSIBILITY OF SUCH DAMAGES. ICE Data Indices, LLC and its affiliates (“ICE Data”) indices and related information, the name “ICE Data”, and related trademarks, are intellectual property licensed from ICE Data, and may not be copied, used, or distributed without ICE Data’s prior written approval. The Fund has not been passed on as to its legality or suitability, and is not regulated, issued, endorsed’ sold, guaranteed, or promoted by ICE Data.

The S&P 500 Index (“Index”) is a product of S&P Dow Jones Indices LLC and/or its affiliates and has been licensed for use by Van Eck Associates Corporation. Copyright © 2020 S&P Dow Jones Indices LLC, a division of S&P Global, Inc., and/or its affiliates. All rights reserved. Redistribution or reproduction in whole or in part are prohibited without written permission of S&P Dow Jones Indices LLC. For more information on any of S&P Dow Jones Indices LLC’s indices please visit www.spdji.com. S&P® is a registered trademark of S&P Global and Dow Jones® is a registered trademark of Dow Jones Trademark Holdings LLC. Neither S&P Dow Jones Indices LLC, Dow Jones Trademark Holdings LLC, their affiliates nor their third party licensors make any representation or warranty, express or implied, as to the ability of any index to accurately represent the asset class or market sector that it purports to represent and neither S&P Dow Jones Indices LLC, Dow Jones Trademark Holdings LLC, their affiliates nor their third party licensors shall have any liability for any errors, omissions, or interruptions of any index or the data included therein.

It is not possible to invest directly in an index.

Investing is subject to risk, including the possible loss of principal. Investors must buy and sell units of the UCITS on the secondary market via an intermediary (e.g. a broker) and cannot usually be sold directly back to the UCITS. Brokerage fees may incur. The buying price may exceed, or the selling price may be lower than the current net asset value. The indicative net asset value (iNAV) of the UCITS is available on Bloomberg. The Management Company may terminate the marketing of the UCITS in one or more jurisdictions. The summary of the investor rights is available in English at: complaints-procedure.pdf (vaneck.com). For any unfamiliar technical terms, please refer to ETF Glossary | VanEck.

No part of this material may be reproduced in any form, or referred to in any other publication, without express written permission of VanEck.

© VanEck (Europe) GmbH ©VanEck Switzerland AG © VanEck Securities UK Limited

Fortsätt läsa

Nyheter

BBVAE ETF är en spansk ETF som spårar Eurostoxx 50

Publicerad

den

BBVA Acción Eurostoxx 50 ETF FI Cotizado Armonizado (BBVAE ETF) med ISIN ES0105321030, strävar efter att spåra EURO STOXX® 50-index. EURO STOXX® 50-indexet följer de 50 största företagen i euroområdet.

BBVA Acción Eurostoxx 50 ETF FI Cotizado Armonizado (BBVAE ETF) med ISIN ES0105321030, strävar efter att spåra EURO STOXX® 50-index. EURO STOXX® 50-indexet följer de 50 största företagen i euroområdet.

Den börshandlade fondens TER (total cost ratio) uppgår till 0,20 % p.a. ETFen replikerar resultatet av det underliggande indexet genom full replikering (köper alla indexbeståndsdelar). Utdelningarna i ETFen delas ut till investerarna (halvårsvis).

BBVA Acción Eurostoxx 50 ETF FI Cotizado Armonizado har tillgångar på 133 miljoner euro under förvaltning. Denna ETF lanserades den 3 oktober 2006 och har sin hemvist i Spanien.

Beskrivning BBVA Acción Eurostoxx 50 ETF FI Cotizado Armonizado

Med BBVA Acción Eurostoxx 50 ETF FI Cotizado Armonizado deltar investerare i ökningen av värdet på aktierna i de 50 största konglomeraten i euroområdet (euroområdet). Euro Stoxx 50-indexet inkluderar aktier från 8 länder i euroområdet: Belgien, Finland, Frankrike, Tyskland, Irland, Italien, Nederländerna och Spanien.

Handla BBVAE ETF

BBVA Acción Eurostoxx 50 ETF FI Cotizado Armonizado (BBVAE ETF) är en börshandlad fond (ETF) som handlas på Bolsa de Madrid.

Bolsa de Madrid är en marknad som få svenska banker och nätmäklare erbjuder access till, men DEGIRO gör det.

Börsnoteringar

BörsValutaKortnamn
Bolsa de MadridEURBBVAE

Största innehav

VärdepapperVikt %
ASML Holding NVNL00102732158,59%
Lvmh Moet Hennessy Louis Vuitton SEFR00001210145,60%
SAP SEDE00071646005,16%
TotalEnergies SEFR00001202714,59%
Siemens AGDE00072361013,70%
Schneider Electric SEFR00001219723,46%
Future on Euro Stoxx 503,02%
Sanofi SAFR00001205782,99%
L’Oreal SAFR00001203212,98%
Allianz SEDE00084040052,93%

Innehav kan komma att förändras

Fortsätt läsa

Nyheter

The Art of Meme-ing: How Dogecoin Redefined Value

Publicerad

den

Explore Dogecoin's impact on crypto, turning internet memes into cultural and financial assets.

Explore Dogecoin’s impact on crypto, turning internet memes into cultural and financial assets.

𝕋𝕚𝕞𝕖 ℂ𝕠𝕕𝕖𝕤:

00:00 – Intro

00:27 – Where do Memes come from?

03:13 – What are some of the first Memes you remember?

10:28 – Do these things have value?

14:04 – The different types of cryptocurrencies

17:20 – How did Dogecoin start?

24:26 – What is some of the utility?

28:36 – How does it fit into the portfolio?

30:38 – Final thoughts

Research Newsletter

Each week the 21Shares Research team will publish our data-driven insights into the crypto asset world through this newsletter. Please direct any comments, questions, and words of feedback to research@21shares.com

Disclaimer

The information provided does not constitute a prospectus or other offering material and does not contain or constitute an offer to sell or a solicitation of any offer to buy securities in any jurisdiction. Some of the information published herein may contain forward-looking statements. Readers are cautioned that any such forward-looking statements are not guarantees of future performance and involve risks and uncertainties and that actual results may differ materially from those in the forward-looking statements as a result of various factors. The information contained herein may not be considered as economic, legal, tax or other advice and users are cautioned to base investment decisions or other decisions solely on the content hereof.

Fortsätt läsa

21Shares

Prenumerera på nyheter om ETFer

* indicates required

21Shares

Populära