
Nyheter
Ungern och Nigeria tas bort från tillväxtmarknadsindex

Nigeria tas bort från det obligationsindex som JP Morgan satt upp för tillväxtmarknader och det kommer bli ännu svårare att handla med det afrikanska landets obligationer. Att Nigeria tas bort från tillväxtmarknadsindex, GBI-EM Index Series, är att betrakta som en förlust för landet, men det innebär sannolikt också högre kostnader för obligationslånen eftersom mycket kapital påverkas då en mängd fonder med mer än 200 miljarder dollar följer JP Morgans obligationsindex. Det är således sannolikt att flera fonder kommer att välja att sälja av, alternativt att upphöra med att köpa obligationer utgivna av landet Nigeria när Ungern och Nigeria tas bort från tillväxtmarknadsindex.
JP Morgan har valt att ta bort Nigeria från sitt tillväxtmarknadsindex eftersom landet valt att införa begränsningar i valutatransaktionerna, något som kan skapa en oro för brist på likviditet.
Har ingått in indexet sedan oktober 2012
Nigeria har ingått i GBI-EM Index Series sedan oktober 2012, strax efter det att Nigeria, Afrikas största ekonomi, tog bort kravet på en bindningstid om ett år för investeringar i statsobligationer. I januari 2015 satte sedan Nigeria på bevakningslistan eftersom en rad administrativa åtgärder började görde det svårt för utländska investerare att handla med landets obligationer. I juni 2015 förnyades denna bevakning på grund av behovet av att övervaka öppenheten och likviditeten hos Nigerias kapitalmarknad.
Nigeria utmaningar är inte förvånande med tanke på rörelsen i oljepriset. Olja utgör cirka 90 procent av Nigerias export och svarar för två tredjedelar av regeringens inkomster. Nigeria har infört restriktioner för utländsk valuta för att hejda nedgången av valutan inom denna miljö.
Tillämpat fokus på fundamenta användes aldrig för Nigeria
Under våren 2010 lanserades WisdomTree Emerging Markets Local Debt Fund (ELD) som ett alternativ för den som ville investera i obligationer utgivna av emerging markets. ELDs placeringsfolisofi skiljer mot den traditionella metoden med ett kapitalviktat index som vanligen används för Emerging Markets Debt, som placerar den största vikten i skuldmarknaderna med den största emissionen.
Istället fokuserar ELD på en strategi för finanspolitisk hållbarhet och indikatorer för extern sårbarhet i syfte att övervaka risker. Även politisk risk och ekonomisk solvens beaktas noga. Processen allokerar denna börshandlade fonds kapital enligt tre nivåer där det enskilda landets exponeringar inom respektive grupp är lika viktade. Denna ETFs porfölj rebalanseras kvartalsvis. Val av valuta och definition av universum omprövas vid schemalagda intervall minst en gång årligen. Resultaten? Oroliga länder som Nigeria uppfyller ofta inte de krav som ställs av denna ETF.
ELD, nya vikter per den 31 augusti 2015
I tabellen nedan jämförs ELDs målvikter, post rebalanseringen i augusti 2015, med dem för JP Morgan GBI-EM Global Diversified Index och GBI-EM JP Morgan CORE Index, två av de mer allmänt följt index inom JP Morgans GBI-EM-serien.
ELD kontra Två GBI-EM Index

Förändringar
Nigeria och Ungern är exkluderade från ELD. JP Morgan beslutade som nämnt ovan att utesluta Nigeria från sitt tillväxtmarknadsindex, men detta land har aldrig uppfyllt de hårdare krav som WisdomTrees förvaltare ställt upp.
Per den 31 augusti 2015 ingick även Ungern i JP Morgan Index som en framstående, noninvestment kvalitetsemittent. ELDs urvalsprocess ledde emellertid till att både Ungern och Nigeria exkluderades från ELD i ett syfte att hantera riskerna i denna ETFs portfölj.
Bland övriga notabla förändringar i den rebalansering som skedde i ELD i augusti 2015 kan nämnas att Malaysia nedgraderades från en top-tier till en mellan-tier exponering, vilket motsvarar en minskning av kapitalvikten med 3,10 procent. Denna ändring gjordes på grund av en försämring av Malaysias bytesbalans och valutareserv, kopplat till en begränsad tilltro till en kort siktig omsvängning i trenden.
Bland de innehav hos ELD som inte ingår i JP Morgans index kan nämnas Sydkorea. Det är anmärkningsvärt att Sydkorea har en mellan-tier exponering hos ELD, men har ingen representation inom de index som finns hos JP Morgan. På samma sätt har Kina och Indien tier-three exponering hos ELD, men de saknas helt i JP Morgan Index. Detta är en viktig punkt i ELDs aktiva process att inte vara bunden till de åtgärder som vidtagits av andra index.
Kontinuerlig Riskövervakning
Att ELD har lyckats undvika Nigerias problem visar på fördelarna med en effektiv styrning och ett strukturerat och aktivt förhållningssätt till emerging markets. Portföljhanteringsprocessen kan emellertid aldrig vila. Förvaltarna måste ständigt utvärdera de exponeringar som denna börshandlade fond har mot enskilda länder, se om de uppfyller kraven på tillväxt- och inflationsindikatorer, skuld kapacitet, kortsiktiga likviditetsfaktorer och marknadsbaserade indikatorer. Kort sagt ELD följer inte vikter, denna ETF arbetar med en strukturerad process för att söka hantera risker.
Tillväxtmarknader världen över har på senare tid haft svårt att visa en positiv avkastning, något som framförallt beror på den styrka som vi sett hos den amerikanska dollarn. För de contrarians som tror den amerikanska dollarn rally gjort sitt och söker efter ett relativt högavkastande tillgångsslag, är ELDs grundläggande strategi värda att beakta.


Nyheter
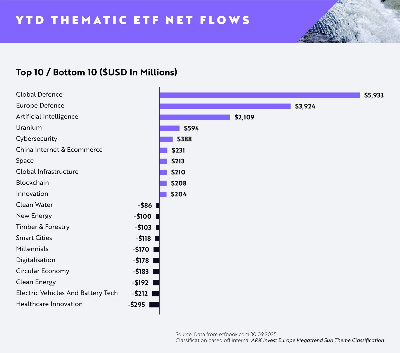
AI minskar gapet mot försvaret då flödena av europeiska tematiska ETFer når 13,1 miljarder dollar hittills i år

Flödena av europeiska tematiska UCITS-ETFer fortsätter att öka uppåt i takt med att investerare dras mot högt övertygande megatrender, med AI (Artificiell Intelligens), försvar, energi (specifikt uran) och Kinas internet och e-handel alla i ledande positioner.
Viktiga punkter
- AI minskar gapet på försvaret då flödena av europeiska tematiska ETFer når 13,1 miljarder dollar hittills i år
- Försvaret fortsätter att dominera under första till tredje kvartalet (+9,86 miljarder dollar)
- AI toppar nettoinflödena för augusti och september
Globala försvars-ETFer fortsätter att leda flödena hittills i år (YTD) med +5,93 miljarder dollar i nettoflöden, med europeiska försvars-ETFer på andra plats med +3,92 miljarder dollar i nettoflöden.
Emellertid har ETFer inom artificiell intelligens sett en anmärkningsvärd ökning i efterfrågan sedan slutet av första halvåret 2025, med dominerande inflöden under augusti och september för att nå nästan +2,11 miljarder dollar i nettoflöden hittills i dag. Detta motsvarar en ökning med cirka 133 % i nettoflöden sedan slutet av första halvåret jämfört med Global Defence på +23 % och European Defence på 29 %.
Investerarnas aptit för försvar är fortsatt stark då geopolitiska risker och moderna krigföringskrav driver strukturella medvindar för sektorn. Försvarsentreprenörer i framkant inom avancerad flyg- och rymdteknik, cybersäkerhet och drönarteknik tar en växande andel av de globala upphandlingsbudgetarna.
I Europa är allokeringarna fortfarande höga då regeringar över hela kontinenten reagerar på nya säkerhetsrealiteter med ökade utgiftsåtaganden. Investerare verkar fokuserade på lokala ledare med exponering mot underrättelsesystem, försvarselektronik och strategisk tillverkning.
Den ökade efterfrågan på ETFer inom artificiell intelligens visar att innovationstakten inom generativa modeller och företags-AI fortfarande är en viktig magnet för kapital. Investerare föredrar plattformar med skalbar AI-infrastruktur och exponering mot verkliga applikationer inom programvara, halvledare och robotteknik.
På andra håll rankades uran-ETFer på fjärde plats med +594 miljoner dollar i nettoflöden, medan cybersäkerhets-ETFer rankades på femte plats med +388 miljoner dollar. Båda teman fortsätter att attrahera kapital tack vare tydliga men hållbara drivkrafter: uran från den förnyade satsningen mot kärnkraft i övergången till ren energi och cybersäkerhet från eskalerande digitala hot och växande efterfrågan på motståndskraftig infrastruktur.
Rahul Bhushan, VD och global chef för investeringsprodukter på ARK Invest, kommenterade flödena: ”Investerare ompositionerar sig aktivt mot innovationsdrivna, strukturellt drivna teman i en föränderlig makromiljö. Med geopolitiska risker, genombrott inom generativa modeller och AI-ledd innovation uttrycker investerare starka åsikter om megatrender snarare än breda, odifferentierade exponeringar. Det är tydligt att tematiska ETFer inte längre bara är taktiska satsningar, de är centrala strategiska exponeringar.”


HANetfs Hector McNeil förklarar hur ETFer genererar hög avkastning med covered calls

JPEY ETF högavkastande företagsobligationer vautasäkrade till Euro

AI minskar gapet mot försvaret då flödena av europeiska tematiska ETFer når 13,1 miljarder dollar hittills i år

XMME ETF – Levler MSCI EM by Xtrackers

34GI ETF bara eurodenominerade företagsobligationer med förfall 2024

De bästa lågvolatilitets ETFer på marknaden

Fokus mot en helt ny börshandlad produkt i september 2025

M5TYs senaste utdelningstakt (55 %) belyser covered call-strategins inkomstpotential
Could Bitcoin be the key to your dream house?

Börshandlade fonder för europeiska small caps
-
 Nyheter4 veckor sedan
De bästa lågvolatilitets ETFer på marknaden
-
 Nyheter3 veckor sedan
Fokus mot en helt ny börshandlad produkt i september 2025
-
 Nyheter4 veckor sedan
M5TYs senaste utdelningstakt (55 %) belyser covered call-strategins inkomstpotential
-

 Nyheter4 veckor sedan
Could Bitcoin be the key to your dream house?
-
 Nyheter3 veckor sedan
Börshandlade fonder för europeiska small caps
-

 Nyheter2 veckor sedan
Levler noterar ytterligare fyra börshandlade fonder i Sverige
-
 Nyheter4 veckor sedan
The Investment Case for TLT (Long-Dated Treasury Bonds)
-

 Nyheter3 veckor sedan
Miners Find Their Mojo as Gold Consolidates