
Nyheter
The Future of Fandom: Why Esports and Gaming Are Outpacing Traditional Sports

For many decades, traditional sports leagues like Europe’s ”Big Five” football leagues or the Major League Baseball (MLB) and the National Basketball Association (NBA) in the U.S. have served as cultural and commercial bedrocks. But in 2024 and beyond, signs of structural decline are becoming increasingly visible — especially among younger audiences.
To receive more insights, sign up to our newsletter
Across Europe, the cracks are showing. In the 2023–24 season, aggregate broadcast revenue for Europe’s top football leagues grew by just 1% year-on-year, reaching €9.4 billion—the slowest growth among all major revenue streams for the second year running.1 More troubling is the declining interest from the under-35 demographic, where sports viewership has dropped nearly 25% since 2015. Young Europeans, much like their peers in the U.S., are abandoning traditional broadcasts in favor of digital-first platforms like YouTube and TikTok, which offer algorithm-driven, bite-sized content that aligns better with their media consumption habits.2
In this context, new leagues like Spain’s Kings League and Germany’s Baller League are rapidly gaining traction. Built from the ground up with Gen Z in mind, these fast-paced, influencer-driven formats are streamed on Twitch and YouTube, and integrate elements of gaming, reality TV, and live sports. Their success highlights a broader shift in what the next generation values in sports: interactivity, accessibility, and entertainment—rather than heritage and tradition alone.
This pattern echoes in the U.S. as well. MLB is struggling to connect with younger fans. A 2024 CivicScience study ranked baseball dead last in popularity among Gen Z compared to other major leagues.3 Even recent rule changes aimed at shortening games and making the sport more dynamic haven’t reversed the decline. Financial strains are also surfacing more publicly: ESPN opted out of its long-standing partnership with MLB, citing a mismatch between the $550 million it paid annually for broadcast rights and the $150 million it recouped in ad revenue—a stark reminder of the growing disconnect between cost and actual audience reach.4
The NBA, often seen as the digital-native league, is not immune either. While its bite-sized highlight clips thrive on social media, full-game viewership has fallen sharply. ESPN reported a 28% drop in viewership in late 2024, and opening night ratings were down 42% year-over-year.5 Even the NFL—long the unrivaled titan of U.S. broadcast sports—has begun to feel the pressure. Though it still leads all leagues by a wide margin in terms of total viewership, its average ratings dipped by 2.2% over the 2024 season.6 That slight but notable decline underscores a broader trend: even the most established broadcast juggernauts are not insulated from the generational shift toward streaming, short-form content, and on-demand consumption.
To receive more insights, sign up to our newsletter
In both the U.S. and Europe, traditional sports leagues are discovering that legacy alone is no longer enough. To stay relevant, they’ll need to reckon with the new rules of engagement set by a generation raised on streaming, interactivity, and on-demand everything.
Esports and Gaming Offer What Modern Audiences Actually Want
While traditional sports are struggling to reinvent themselves for a digital-first world, eSports and gaming are meeting young audiences where they are on digital platforms, with interactive content, and in spaces that prioritize community and participation.
The eSports audience was expected to surpass 900 million by 2024 and its global revenue has reached $4.3 billion by 2024. Nearly half of this global audience falls under the age of 35, positioning eSports squarely within the demographic traditional leagues are losing. The broader gaming industry is even more impressive, on track to reach $321 billion in global revenue by 2026.7
Esports Revenues Worldwide in Billions
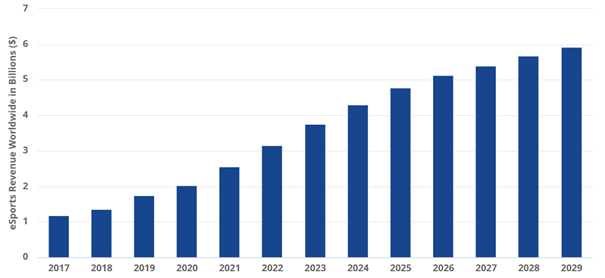
Source: Statista as of 2024. Figures for 2025–2029 are Statista forecasts based on current industry assumptions and are therefore indicative only; they do not constitute a guarantee of future results.
What sets eSports apart is its inherent interactivity. Unlike passive broadcast formats, eSports events often take place on platforms like Twitch or YouTube, where fans can engage directly with streamers, teams, and each other. Viewers can participate in real-time chats, vote on in-game decisions, and even contribute financially to their favorite content creators. This type of two-way engagement is absent in traditional sports and helps build strong, sticky relationships between fans and franchises.
To receive more insights, sign up to our newsletter
Esports also integrates seamlessly into the larger entertainment ecosystem. Events frequently feature musical performances, influencer crossovers, and community-generated content. This blend of gaming, pop culture, and real-time interaction has created an entirely new kind of fan experience, one that aligns perfectly with the expectations of Gen Z and Gen Alpha.
Key Differences Between Esports and Traditional Sports
The structural differences between traditional sports and eSports go beyond format. Esports and gaming have a fundamentally more scalable, globally accessible, and digitally monetizable model. This table highlights several of the most important contrasts:
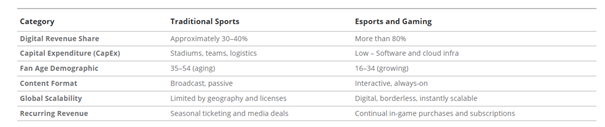
Source: VanEck Analysis, 2025; Demographic Data from GWI Sports Audience Report 2024.
Scalability and Fan Interactivity Are the Real Growth Drivers
Perhaps the biggest strategic advantage eSports holds over traditional sports is scalability. Traditional leagues must rely on physical venues, geographic markets, and linear broadcasting contracts to grow. Esports, on the other hand, is global by design. A tournament in Seoul can be streamed live to millions across the U.S., Europe, and South America simultaneously with minimal infrastructure investment.
Additionally, eSports generates recurring revenue through game-as-a-service models. Titles like League of Legends and Fortnite monetize through battle passes, in-game cosmetics, and seasonal events. Fans aren’t just watching, they’re participating. Many eSports fans actively play the games they follow, further reinforcing brand loyalty and deepening engagement. Traditional sports struggle to replicate this level of ecosystem stickiness.
That engagement also translates into revenue frequency. A baseball fan might attend a few games a year. A gamer may log in daily, spending money frequently and participating in a digital economy that is always evolving.
Investment Implications: Embracing the Digital Shift with ESP0
For investors seeking exposure to the growing eSports and gaming sector, the VanEck Video Gaming and eSports UCITS ETF (ESP0) offers a compelling thematic opportunity. ESPO tracks the MarketVector Global Video Gaming and eSports ESG Index (MVESPGTR), which includes companies that derive at least 50% of their revenues from video gaming and/or eSports.
As of June 2025, ESPO’s top holdings include leading global publishers and platforms such as Nintendo, AppLovin, Tencent, Roblox, and Netease, each playing a significant role in the evolution of the digital entertainment landscape.
These companies exemplify the structural growth potential in gaming, from mobile distribution and immersive game development to social gaming ecosystems and global content delivery. However, as with any investment, the sector may be influenced by factors such as market dynamics and evolving consumer trends, which could affect company performance in various ways. You may lose the entire investment. Main Risk Factors are Equity market risk, industry or sector concentration risk and risk of investing in smaller companies as described in the KID and prospectus.
ESPO Index Outperforms Broad Market Since ETF Launch
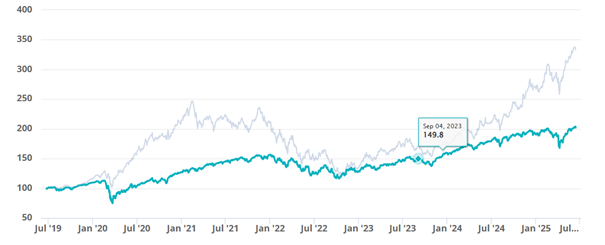
Past performance is no indicator for future results.
Performance-History (%) – as of: June 13th 2025
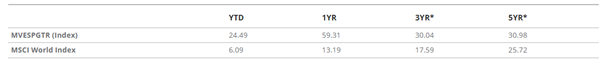
*Annualized return.
Source: VanEck, MSCI. MVESGTR is tracked by the VanEck Video Gaming and eSports UCITS ETF (ESPO). Effective December 16, 2021 the MVIS® Global Video Gaming and eSports Index has been replaced with the MarketVector™ Global Video Gaming & eSports ESG Index (MVESPGTR). Performance is shown in USD. Indices are unmanaged and not securities in which investments can be made. Investing is subject to risk, including the possible loss of principal. The MSCI World Index serves as a proxy benchmark for the broad stock market, while the MVESGTR is utilized as a benchmark for gaming stocks. However, the MVESGTR should not be considered an alternative or substitute for a market index, as it focuses on a specific industry.
Key Takeaways
The sports world is evolving quickly. What was once dominated by stadiums, cable networks, and passive viewing is being replaced by interactive platforms, global audiences, and deeply participatory ecosystems. Traditional leagues like MLB and the NBA may not vanish, but their cultural and financial dominance is clearly eroding.
Esports and gaming aren’t just a niche alternative, they are the new mainstream. And for those looking to invest in the future of fandom, the time to act is now.
1 Source: Deloitte, Annual Review of Football Finance 2025, June 2025.
2 Source: Telegraph, How Gen Z could throw TV football into an existential crisis, June 2024.
3 Source: CivicScience, MLB Is Striking Out With Gen Z as New Season Approaches, March 2025.
4 Source: ESPN, MLB to end broadcast partnership after 2025 season, February 2025.
5 Source: Front Office Sports, Why Are NBA Ratings Down to Start the Season?, November 2024.
6 Source: Front Office Sports, Explaining NFL Ratings Dip, January 2025.
7 Sources: Gitnux, Esports Industry Report 2025; Statista eSports Revenue, 2024; World Economic Forum, Gaming Report, 2022.
IMPORTANT INFORMATION
This is marketing communication. Please refer to the prospectus of the UCITS and to the KID/KIID before making any final investment decisions. These documents are available in English and the KIDs in local languages and can be obtained free of charge at www.vaneck.com, from VanEck Asset Management B.V. (the “Management Company”) or, where applicable, from the relevant appointed facility agent for your country.
For investors in Switzerland: VanEck Switzerland AG, with registered office in Genferstrasse 21, 8002 Zurich, Switzerland, has been appointed as distributor of VanEck´s products in Switzerland by the Management Company. A copy of the latest prospectus, the Articles, the Key Information Document, the annual report and semi-annual report can be found on our website www.vaneck.com or can be obtained free of charge from the representative in Switzerland: Zeidler Regulatory Services (Switzerland) AG, Neudtadtgasse 1a, 8400 Winterthur, Switzerland. Swiss paying agent: Helvetische Bank AG, Seefeldstrasse 215, CH-8008 Zürich.
For investors in the UK: This is a marketing communication targeted to FCA regulated financial intermediaries. Retail clients should not rely on any of the information provided and should seek assistance from a financial intermediary for all investment guidance and advice. VanEck Securities UK Limited (FRN: 1002854) is an Appointed Representative of Sturgeon Ventures LLP (FRN: 452811), which is authorised and regulated by the Financial Conduct Authority (FCA) in the UK, to distribute VanEck´s products to FCA regulated firms such as financial intermediaries and Wealth Managers.
This information originates from VanEck (Europe) GmbH, which is authorized as an EEA investment firm under MiFID under the Markets in Financial Instruments Directive (“MiFiD). VanEck (Europe) GmbH has its registered address at Kreuznacher Str. 30, 60486 Frankfurt, Germany, and has been appointed as distributor of VanEck products in Europe by the Management Company. The Management Company is incorporated under Dutch law and registered with the Dutch Authority for the Financial Markets (AFM).
This material is only intended for general and preliminary information and shall not be construed as investment, legal or tax advice. VanEck (Europe) GmbH and its associated and affiliated companies (together “VanEck”) assume no liability with regards to any investment, divestment or retention decision on the basis of this information. The views and opinions expressed are those of the author(s) but not necessarily those of VanEck. Opinions are current as of the publication date and are subject to change with market conditions. Information provided by third party sources is believed to be reliable and have not been independently verified for accuracy or completeness and cannot be guaranteed.
VanEck Video Gaming and eSports UCITS ETF (the ”ETF”) is a sub-fund of VanEck UCITS ETFs plc, an open-ended variable capital umbrella investment company with limited liability between sub-funds. The ETF is registered with the Central Bank of Ireland, passively managed and tracks an equity index. Investing in the ETF should be interpreted as acquiring shares of the ETF and not the underlying assets.
MarketVector™ Global Video Gaming & eSports ESG Index is the exclusive property of MarketVector Indexes GmbH (a wholly owned subsidiary of Van Eck Associates Corporation), which has contracted with Solactive AG to maintain and calculate the Index. Solactive AG uses its best efforts to ensure that the Index is calculated correctly. Irrespective of its obligations towards MarketVector Indexes GmbH (“MarketVector”), Solactive AG has no obligation to point out errors in the Index to third parties. VanEck’s ETF is not sponsored, endorsed, sold or promoted by MarketVector and MarketVector makes no representation regarding the advisability of investing in the ETF. Effective December 16, 2022 the MVIS Global Video Gaming and eSports Index has been replaced with the MarketVector™ Global Video Gaming & eSports ESG Index. It is not possible to invest directly in an index.
The MSCI information may only be used for your internal use, may not be reproduced or redisseminated in any form and may not be used as a basis for or a component of any financial instruments or products or indices. None of the MSCI information is intended to constitute investment advice or a recommendation to make (or refrain from making) any kind of investment decision and may not be relied on as such. Historical data and analysis should not be taken as an indication or guarantee of any future performance analysis, forecast or prediction. The MSCI information is provided on an “as is” basis and the user of this information assumes the entire risk for any use made of this information. MSCI, each of its affiliates and each other person involved in or related to compiling, computing or creating any MSCI information (collectively, the “MSCI Parties”), expressly disclaims all warranties (including, without limitation, any warranties of originality, accuracy, completeness, timeliness, noninfringement, merchantability and fitness for a particular purpose) with respect to this information. Without limiting any of the foregoing, in no event shall any MSCI Party have any liability for any direct, indirect, special, incidental, punitive, consequential (including, without limitation, lost profits) or any other damages. It is not possible to invest directly in an index.
Performance quoted represents past performance. Current performance may be lower or higher than average annual returns shown. Performance data for the Irish domiciled ETFs is displayed on a Net Asset Value basis, in Base Currency terms, with net income reinvested, net of fees. Returns may increase or decrease as a result of currency fluctuations. Investors must be aware that, due to market fluctuations and other factors, the performance of the ETFs may vary over time and should consider a medium/long-term perspective when evaluating the performance of ETFs.
Investing is subject to risk, including the possible loss of principal. Investors must buy and sell units of the UCITS on the secondary market via a an intermediary (e.g. a broker) and cannot usually be sold directly back to the UCITS. Brokerage fees may incur. The buying price may exceed, or the selling price may be lower than the current net asset value. The indicative net asset value (iNAV) of the UCITS is available on Bloomberg. The Management Company may terminate the marketing of the UCITS in one or more jurisdictions. The summary of the investor rights is available in English at: complaints-procedure.pdf (vaneck.com). For any unfamiliar technical terms, please refer to ETF Glossary | VanEck.
No part of this material may be reproduced in any form, or referred to in any other publication, without express written permission of VanEck.
© VanEck (Europe) GmbH ©VanEck Switzerland AG © VanEck Securities UK Limited


Gold steadies near $3,300; miners soar on strong earnings, discipline, and rising margins, hinting at a potential re-rating and new potential bull cycle for gold equities.
Monthly gold market and economic insights from Imaru Casanova, Portfolio Manager, featuring her distinctive views on mining and gold’s portfolio benefits.
To receive more Gold Investing insights, sign up to our newsletter.
Key Takeaways:
• Gold range-bound near $3,300/oz, with catalysts like Fed turmoil and global risks boosting safe- haven demand
• Gold miners surged in August on strong earnings and capital discipline
• Signs of a sector re-rating suggest gold equities may be entering a new bull cycle
Policy Whiplash, Golden Calm
Gold continues to be supported by heightened uncertainty and volatility stemming from persistent global geopolitical and trade tensions and mixed economic signals. In August, gold itself became entangled in the trade-tariff chaos when news reports suggested that the U.S. had imposed tariffs on 1-kilogram and 100-ounce bars of gold1. The White House and President Trump later reassured markets that gold will not be subject to tariffs2. TACO, indeed! The gold tariff fiasco exemplifies the confusing policy environment in the U.S., with markets trying to re-interpret and price in rapidly changing (and conflicting) information daily.
Gold Holds the Line
The gold price has been range-bound around the $3,300 per ounce level following its strong rally post “liberation” day in April3. This sideways action does not surprise us. In recent years, after significant moves to new highs, the gold price tends to consolidate around a new, higher base before the next catalyst emerges that drives it to the next level. While there are plenty of potential catalysts at present, the timing is impossible to predict, but anything that threatens the stability of the global financial system could lead to a surge in safe-haven demand for gold.
From Tariff Talk to Rally Walk
We had a taste of what some of those catalysts may look like on August 20, when President Trump called for the resignation of – and days later announced he had fired – U.S. Federal Reserve (“Fed”) Governor Lisa Cook4. This escalation in assaults on the Fed by the current administration raised fears that the Fed could lose its independence, threatening the stability and credibility of the world’s most important central bank. Gold rallied in response, also supported by increased probabilities of a Fed cut in September and a weaker dollar, closing at $3,447.95 per ounce on August 29, a $158.02 (4.80%) gain for the month5.
As of 31 August, gold was up 78% over the past five years (31 August 2020 – 31 August 2025). Investors should keep in mind that past performance is not a reliable indicator of future results, and that investment in gold is subject to risks, including volatility, the risk of investing in natural resources, and the possible loss of principal. Investing is subject to risk, including the possible loss of principal.
Returns on this investment may increase or decrease as a result of USD/EUR currency movements.
Calm Metal, Hot Miners
The NYSE Arca Gold Miners Index (GDMNTR) (“GDM”) was up a whopping 21.73% during the month6, while the mid-tier and small cap index, MVIS Global Junior Gold Miners (MVGDXJTR), was up 23.35%7. The gold price increase led to an amplified gain for the gold equities, as expected, reflecting their leverage to the metal price. However, the substantial outperformance suggests other factors, beyond the gold price, supported gold mining shares in August. We believe a key driver was a very strong Q2 2025 earnings season: companies generally reported financial and operating results that met or exceeded expectations, with many companies reporting record revenues and free cash flow. Most companies maintained their yearly guidance, and many larger players reiterated their commitment to higher shareholder returns via dividend payments and share buybacks. Investors seemed reassured that higher gold prices are indeed translating into higher margins, higher profitability, lower debt and enhanced growth prospects for the industry. And while August was not a bad month for broader equities, helped by mega-cap tech dominance and optimistic rate-cut speculation, the S&P 500® Index’s monthly increase of approximately 2%8 paled in comparison to the gold miners’ advance. Richly valued U.S. equities, concerns that growth of mega-cap stocks may be fading and high concentration in AI/tech stocks may also be driving portfolio diversification and rotation of capital that is benefiting gold stocks.
Miners Find Their Mojo
After almost two decades of persistent de-rating, could gold equities finally be getting their mojo back? Our data seems to suggest that it could be the case. We have been tracking the relationship between gold bullion and gold equities (GDM) since 2001 (see chart below) and have identified six clear (strong) trends, indicating a significant and prolonged de-rating of the gold mining sector since 2007. A de-rating occurs when a trendline shifts to the right and/or downward. De-ratings in the past were the result of companies consistently disappointing investors. Examples include massively out- of-the-money hedge books in the 2000’s; over indebtedness and low returns on capital in the 2010’s; and missing production and cost targets in the early 2020’s. Now investors are seeing expanding margins, low debt, capital-allocation discipline, and companies doing what they said they would do this year. While it is too early to tell if a new valuation trend is forming, August data is encouraging and may signal the beginning of a new bull cycle for gold mining stocks. For reference, the bull- market trend of 2001-2007 would imply a GDM value of approximately 6,000 at today’s spot gold price, compared to its present value of around 1,800. A return of those historical sector multiples may seem unrealistic and it’s not part of our outlook, but a significant re-rating of the sector is in the cards, in our view. Investors must keep in mind that past performance is not indicative of future results.
As mentioned above, the chart below maps gold prices against the GDM since 2001, highlighting the six trends—and a potential re-rating with a steeper “new trend” emerging since mid-August 2025.
Gold vs NYSE Arca Gold Miners Index
2001 – 2025 Weekly Close
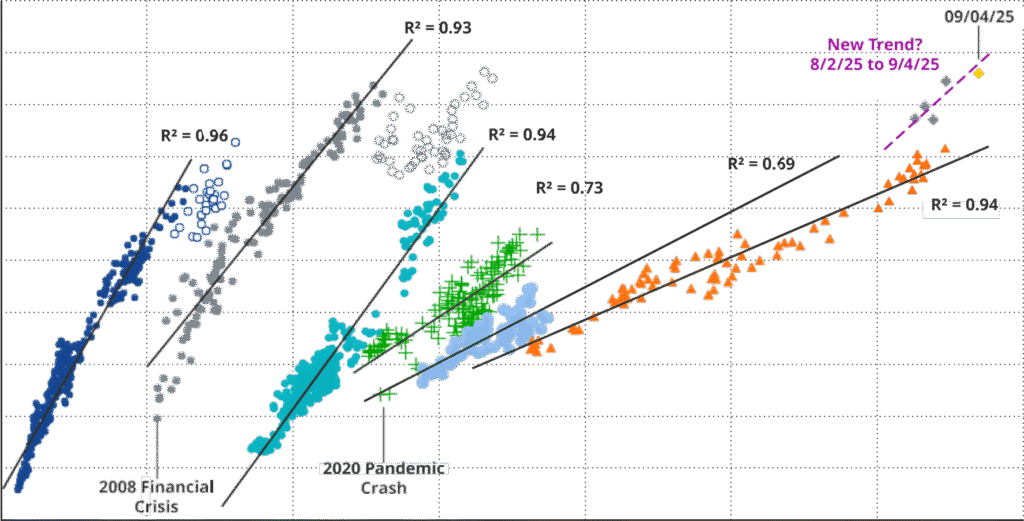
Data as of September 4, 2025. Past performance is no guarantee of future results.
To receive more Gold Investing insights, sign up to our newsletter.
Imaru Casanova
Portfolio Manager,
Gold and Precious Metal
1 Reuters. (07.08.2025)
2 Reuters. (11.08.2025)
3 World Gold Council. (31.08.2025)
4 Reuters, Yahoo Finance. (20.08.2025)
5 World Gold Council. (31.08.2025)
6 FT. (30.08.2025)
7 MarketVector. (31.08.2025)
8 FT. (30.08.2025)
IMPORTANT INFORMATION
This is marketing communication. Please refer to the prospectus of the UCITS and to the KID/KIID before making any final investment decisions. These documents are available in English and the KIDs/KIIDs in local languages and can be obtained free of charge at www.vaneck.com, from VanEck Asset Management B.V. (the “Management Company”) or, where applicable, from the relevant appointed facility agent for your country.


Börshandlade fonder för europeiska small caps

XMGA ETF spårar amerikanska aktier men exkluderar de största företagen

Miners Find Their Mojo as Gold Consolidates

TLTY ETP köper långa statsobligationer och ger utdelning varje månad

EXUS ETF – Levler MSCI World ex USA by Xtrackers

Utdelningar och försvarsfonder lockade i augusti

Septembers utdelning i XACT Norden Högutdelande

HANetf kommenterar mötet mellan Kina, Ryssland och Nordkorea vid militärparad

HANetf kommenterar Norges avtal om krigsfartyg med Storbritannien

JGVE ETF köper statsobligationer som hedgas i Euro
-
 Nyheter4 veckor sedan
Utdelningar och försvarsfonder lockade i augusti
-
 Nyheter3 veckor sedan
Septembers utdelning i XACT Norden Högutdelande
-
 Nyheter4 veckor sedan
HANetf kommenterar mötet mellan Kina, Ryssland och Nordkorea vid militärparad
-
 Nyheter4 veckor sedan
HANetf kommenterar Norges avtal om krigsfartyg med Storbritannien
-
 Nyheter4 veckor sedan
JGVE ETF köper statsobligationer som hedgas i Euro
-
 Nyheter3 veckor sedan
IncomeShares fondflöden nådde en ny rekordnivå i augusti
-

 Nyheter4 veckor sedan
USBG ETF köper statsobligationer och hedgar dem i dollar
-
 Nyheter4 veckor sedan
September är extremt