Följ oss

Nyheter

The Biggest Liquidations Since FTX: What Led to It and What to Keep an Eye On?

Publicerad

den

Biggest Liquidations Since FTX Once more, markets witnessed a downturn in the past week. It was seemingly triggered by a combination of factors, including rumors surrounding SpaceX's potential Bitcoin sale, the Securities and Exchange Commission (SEC) appealing against the July 13 Ripple order, and various other significant macroeconomic events. Bitcoin and Ethereum fell by 11.16% and 9.58%, respectively, over the past week. As seen below, the cryptoassets that suffered the most within the major crypto categories were Uniswap (-23.8%), Stacks (-19%), and Avalanche (-16%), over the past week.

Once more, markets witnessed a downturn in the past week. It was seemingly triggered by a combination of factors, including rumors surrounding SpaceX’s potential Bitcoin sale, the Securities and Exchange Commission (SEC) appealing against the July 13 Ripple order, and various other significant macroeconomic events. Bitcoin and Ethereum fell by 11.16% and 9.58%, respectively, over the past week. As seen below, the cryptoassets that suffered the most within the major crypto categories were Uniswap (-23.8%), Stacks (-19%), and Avalanche (-16%), over the past week.

Figure 1: Weekly Price and TVL Developments of Cryptoassets in Major Sectors

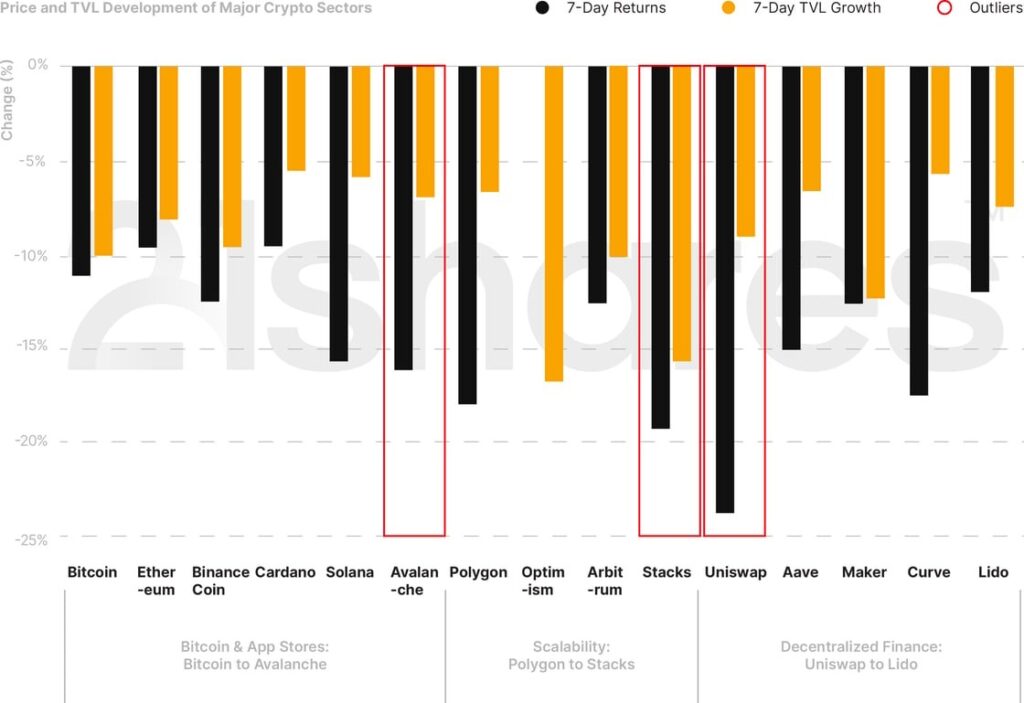
Source: 21Shares, CoinGecko, DeFi Llama. Close data as of August 21, 2023.

3 Things to Remember in Markets this Week:

• Biggest On-Chain Liquidations Since FTX

On August 17, the crypto market experienced approximately $1.04B in liquidations. Among these, about $833M were long positions, with multiple factors contributing to the chain reaction of liquidations. Notably, the Fed’s meeting minutes highlighted persistent inflation and revealed the possibility of further interest rate hikes. This was further compounded by higher US long-term bond yields and the hawkish Fed stance, fostering a risk-averse sentiment in the short term. The impact wasn’t just limited to crypto as stocks also suffered last week, which holds especially true as Bitcoin has regained its positive correlation with S&P500 and Nasdaq, implying that the three markets are moving again in tandem.

Moreover, the market downturn was exacerbated by erroneous reports of SpaceX liquidating its Bitcoin holdings. While many on social media speculated about a potential sell-off, it’s important to note that write-downs are a standard accounting practice and do not necessarily imply that the investments have been sold or liquidated. In addition, global markets experienced a mild shock due to news of Evergrande’s bankruptcy filing under US Chapter 15, raising concerns about its implications for the worldwide real estate market. Compounding these factors, the SEC’s ability to appeal specific judgments added to the negative sentiment, which we briefly touch on next. That said, although last week’s events pale in comparison to the gravity of the FTX debacle, Bitcoin’s annualized volatility recently hit its lowest level in over five years, which indicated an anticipated market breakout.

Figure 2: Liquidations Across the Crypto Market (August 17)
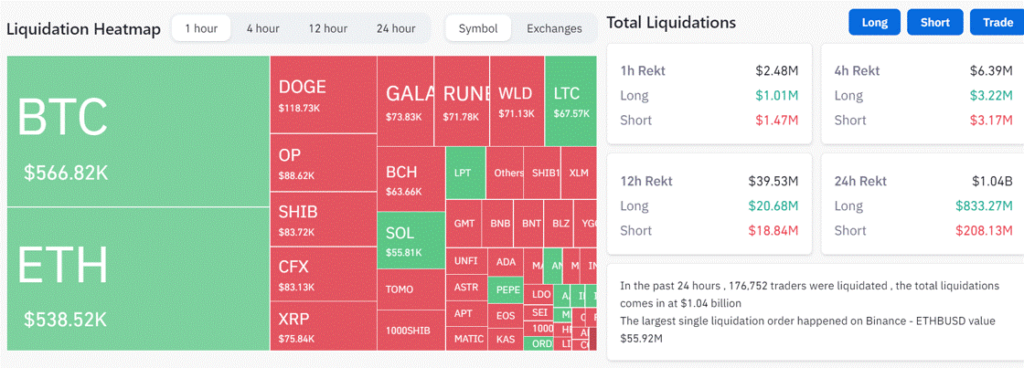
Source: Coinglass

• Ripple’s Lawsuit Saga Just Got Longer

On August 18, the SEC filed an interlocutory appeal against the inconclusive summary order in the Ripple case Federal Judge Analisa Torres issued on July 13. The appeal primarily objects to the court’s view that the programmatic sales of XRP (on exchanges) are not considered securities, highlighting a disagreement among district courts regarding the controlling issues. In response, XRP fell by 17.5% over the past week. Ripple has until September 1 to submit a response to the SEC’s appeal. There are no definite dates for the trial yet; Judge Torres suggested that the court would be in session later in the second half of 2024. Until then, we expect XRP to experience speculation-driven volatility while Ripple continues to secure strategic partnerships to enforce its value proposition as a crypto-native software solution for players in traditional finance. In its latest move, Ripple is collaborating with fintech giant MasterCard and ConSensys, among others, to build a central bank digital currency (CBDC) program to support central banks and governments in pursuing a digital currency. The program will explore the design of CBDCs, interoperability, and their limitations.

• Crypto Derivatives About to Receive a Boost in the U.S.

The U.S. is hungry for more regulated crypto products not exclusive to institutions. After a year in the application, Coinbase won regulatory approval to offer crypto futures to its retail clients in the U.S. What kind of impact can this have on the crypto market in the U.S.? According to a recent study, 58.8 million Americans hold crypto, up 18% from the previous year. This move can bring in more American retail investors to trade a product with less exposure to the risks of this asset class. The trading volume of the global crypto derivatives market represents almost 75% of the entire crypto market. The Coinbase Derivatives Exchange has established a deep liquidity pool with $4.7B worth of BTC and $2B worth of ETH futures traded in notional volume in 2023.
What You Should Pay Attention To

• The Debut of Friend.tech and the broader Social-Fi movement

Friend.tech is a new social application on the Base network, allowing users to tokenize shares of their own Twitter accounts, which other users can trade. The share price scales algorithmically with availability. More shares mean higher prices, accompanied by a 10% tax—5% each for the protocol and the Influencer. Purchasing shares enables direct engagement via private chats and exclusive content access and fosters deeper social ties.

Despite initial technical issues, the platform’s arrival is noteworthy. Firstly, friend.tech employs Base’s Account Abstraction tech for streamlined on-chain user interactions. Users sign up with web2 credentials, deposit without wallet setup, and trade shares without paying transaction fees. Leveraging a web app model also bypasses Apple/Google constraints, enabling ease of deployment and access. Secondly, Friend.tech integrates financialization into social networking, reshaping the relationship to offer both financial and social gains and reflecting what is known as Social Finance (SocialFi).

Thirdly, Friend.tech achieved remarkable visibility in the decentralized social space, surpassing incumbents like Lens protocol with substantial funding. In just 10 days, the application facilitated ~$60M in shares trading and amassed up to $3M daily fees, surpassing most smart-contract platforms during the peak hype. Remarkably, at the depth of the bear market, the application drew nearly 127K users, although some were possibly driven by the prospect of an airdrop while being amongst the rare crypto apps capturing the attention of external figures. High-profile personalities like NBA player Grayson Allen, CEO of Y Combinator Garry Tan, and even gaming influencers like FaZe Banks all joined the platform.

Figure 3: Total number of Transactions on Friend.tech

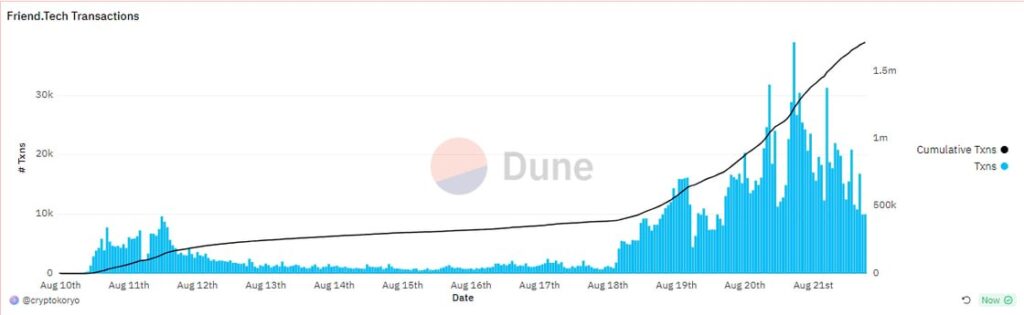
Source: @cryptokoryo on Dune

In summary, Friend.tech can potentially introduce previously untapped web2 innovations as part of the SocialFi movement. This trend aligns with web3’s financial empowerment and data sovereignty goals by merging social interactions with financial opportunities. Yet, improvements, particularly regarding pricing mechanisms and wallet privacy, are essential for maintaining trust. Notably, vulnerabilities, such as users linking wallets to Twitter accounts, underscore the need for stringent privacy measures in SocialFi apps to safeguard user data and uphold the platform’s integrity within the broader web3 framework. Regulatory risk is another factor to consider as users expecting to profit from their influencer’s shares and their revenue sharing could depict the application as a security. That said, Friend.tech is worth monitoring as it could offer a blueprint for future applications in terms of abstracting crypto’s difficulty.

Bookmarks:

• Our last newsletter was featured on Vikingen; read here.

• Senior researcher, Adrian Fritz, shared his insights on the most recent market conditions with Forkast News

• We published a dashboard tracking the post-mortem of the Curve exploit;

• Have you heard of re-staking your staked ETH? EigenLayer is a new staking primitive that enables the reusing of staked ETH. We built a dashboard to track its progress and adoption.

Next Week’s Calendar

These are the top events we’re monitoring for next week.

• Jackson Hole Annual Event: Jerome Powell’s speech should help clarify the overall FED’s view of the economy following the latest chatter about going for more potential interest rate hikes.

• AVAX and LDO token unlock: ~1% and ~3% of the total respective supply will be released to the market.

Source: Forex Factory

Research Newsletter

Each week the 21Shares Research team will publish our data-driven insights into the crypto asset world through this newsletter. Please direct any comments, questions, and words of feedback to research@21shares.com

Disclaimer

The information provided does not constitute a prospectus or other offering material and does not contain or constitute an offer to sell or a solicitation of any offer to buy securities in any jurisdiction. Some of the information published herein may contain forward-looking statements. Readers are cautioned that any such forward-looking statements are not guarantees of future performance and involve risks and uncertainties and that actual results may differ materially from those in the forward-looking statements as a result of various factors. The information contained herein may not be considered as economic, legal, tax or other advice and users are cautioned to base investment decisions or other decisions solely on the content hereof.

Fortsätt läsa
Annons
Klicka för att kommentera

Skriv en kommentar

Din e-postadress kommer inte publiceras. Obligatoriska fält är märkta *

Nyheter

Vilken är den bästa fond som följer Nasdaq-100?

Publicerad

den

Nasdaq 100-indexet följer de 100 största aktierna noterade på Nasdaq-börsen. De utvalda företagen kommer huvudsakligen från sektorer som hårdvara och mjukvara, telekommunikation, detaljhandel och bioteknik – inklusive alla stora amerikanska teknikföretag. Däremot ingår inte företag från energi-, finans- och fastighetssektorerna i Nasdaq-100. Vilken är den bästa fond som följer Nasdaq-100?

Nasdaq 100-indexet följer de 100 största aktierna noterade på Nasdaq-börsen. De utvalda företagen kommer huvudsakligen från sektorer som hårdvara och mjukvara, telekommunikation, detaljhandel och bioteknik – inklusive alla stora amerikanska teknikföretag. Däremot ingår inte företag från energi-, finans- och fastighetssektorerna i Nasdaq-100. Vilken är den bästa fond som följer Nasdaq-100?

I USA har den populära QQQ ETF, som spårar Nasdaq 100, varit tillgänglig sedan 1999. Den förvaltas av Invesco. Den europeiska motsvarigheten till denna ETF använder tickersymbolen eQQQ. Till skillnad från den amerikanska marknaden finns det dock flera ETF-leverantörer i Europa som spårar Nasdaq 100 – så det är värt att jämföra.

ETF-investerare kan dra nytta av värdeökningar och utdelningar från Nasdaq 100-beståndsdelarna. För närvarande spåras Nasdaq 100-indexet av tretton ETFer.

Förvaltningsarvode fond som följer Nasdaq-100

Nedan har vi listat förvaltningsarvoden för fond som följer Nasdaq-100. Samtliga dessa ETFer har en konkurrenskraftig prissättning, allt från AXA IM Nasdaq 100 UCITS ETF USD Acc, som debiterar sina andelsägare 0,14 procent per år till iShares Nasdaq 100 UCITS ETF (Acc) som tar ut 0,33 procent i arvode. I jämförelse kostar de flesta aktivt förvaltade fonder mycket mer avgifter per år.

NamnValutaISINKortnamnFörvaltningsavgift
AXA IM Nasdaq 100 UCITS ETF USD AccUSDIE000QDFFK00ANAU0.14%
Invesco Nasdaq-100 Swap UCITS ETF AccUSDIE00BNRQM384EQQX0.20%
Invesco Nasdaq-100 Swap UCITS ETF DistUSDIE000RUF4QN8EQQD0.20% p.a.
Xtrackers Nasdaq 100 UCITS ETF 1CUSDIE00BMFKG444XNAS0.20%
Amundi Nasdaq-100 II UCITS ETF AccEURLU1829221024LYMS0.22%
Amundi Nasdaq-100 II UCITS ETF DistUSDLU2197908721NADQ0.22%
Amundi Nasdaq 100 UCITS ETF EUR (C)EURLU16810382436AQQ0.23%
Amundi Nasdaq 100 UCITS ETF USDUSDLU168103832610A40.23%
Deka Nasdaq-100® UCITS ETFEURDE000ETFL623D6RH0.25%
Invesco EQQQ Nasdaq-100 UCITS ETFUSDIE0032077012EQQQ0.30%
Invesco EQQQ Nasdaq-100 UCITS ETF AccUSDIE00BFZXGZ54EQQB0.30%
iShares Nasdaq 100 UCITS ETF (DE)USDDE000A0F5UF5EXXT0.31%
iShares Nasdaq 100 UCITS ETF (Acc)USDIE00B53SZB19SXRV0.33%

Som alltid vill vi påminna att om det finns flera olika börshandlade fonder som täcker samma index eller segment är det förvaltningskostnaden som avgör. Antar vi att dessa Nasdaqfonder ger samma avkastning kommer den som har lägst avgift att utvecklas bäst, allt annat lika. Grundregeln är alltså, betala aldrig för mycket då detta kommer att äta upp din avkastning.

Nasdaq 100 ETFer i jämförelse

Förutom avkastning finns det ytterligare viktiga faktorer att tänka på när du väljer en Nasdaq 100 ETF. För att ge ett bra beslutsunderlag hittar du en lista över alla Nasdaq 100 ETFer med detaljer om vinstanvändning, fondens hemvist och replikeringsmetod.

NamnUtdelningspolicyHemvistReplikeringsmetod
iShares Nasdaq 100 UCITS ETF (Acc)AckumulerandeIrlandFysisk replikering
Invesco EQQQ Nasdaq-100 UCITS ETFUtdelandeIrlandFysisk replikering
iShares Nasdaq 100 UCITS ETF (DE)UtdelandeTysklandFysisk replikering
Amundi Nasdaq-100 II UCITS ETF AccAckumulerandeLuxemburgOfinansierad swap
Invesco EQQQ Nasdaq-100 UCITS ETF AccAckumulerandeIrlandFysisk replikering
Amundi Nasdaq 100 UCITS ETF EUR (C)AckumulerandeLuxemburgOfinansierad swap
Amundi Nasdaq-100 II UCITS ETF DistUtdelandeLuxemburgOfinansierad swap
AXA IM Nasdaq 100 UCITS ETF USD AccAckumulerandeIrlandFysisk replikering
Xtrackers Nasdaq 100 UCITS ETF 1CAckumulerandeIrlandFysisk replikering
Invesco Nasdaq-100 Swap UCITS ETF AccAckumulerandeIrlandOfinansierad swap
Amundi Nasdaq 100 UCITS ETF USDAckumulerandeLuxemburgOfinansierad swap
Invesco Nasdaq-100 Swap UCITS ETF DistUtdelandeIrlandOfinansierad swap
Deka Nasdaq-100® UCITS ETFUtdelandeTysklandFysisk replikering

Handla fond som följer Nasdaq-100

Samtliga dessa ETFer är europeiska börshandlade fonder. Dessa fond handlas på flera olika börser, till exempel Deutsche Boerse Xetra och London Stock Exchange.

Det betyder att det går att handla andelar i denna ETF genom de flesta svenska banker och Internetmäklare, till exempel DEGIRONordnet, Aktieinvest och Avanza.

Fortsätt läsa

Nyheter

Inevitable in India: Crowds, cricket and capital gains tax

Publicerad

den

capital gains tax India’s vibrant economy and structural growth opportunities continue to be the envy of many emerging markets. But somewhat unique to this market are tax implications that investors should be aware of. Our Franklin Templeton Global ETF team examines these structural issues in Asia’s third-largest economy.

India’s vibrant economy and structural growth opportunities continue to be the envy of many emerging markets. But somewhat unique to this market are tax implications that investors should be aware of. Our Franklin Templeton Global ETF team examines these structural issues in Asia’s third-largest economy.

In merely a decade, India has taken a quantum leap from the world’s 11th largest economy to become its fifth largest. By many accounts, it is expected to remain one of the world’s fastest-growing major economies over the coming years. And even after a banner 2023 during which the country’s benchmark indexes surged and Indian Prime Minister Narendra Modi celebrated high-profile successes—from historic technological and space exploration achievements to rising global diplomatic clout—this election year has already marked more progress in supporting Modi’s pro-growth, pro-jobs efforts.

The world’s most populous nation has advanced ties with Western countries over free trade. In addition to agreements with Australia and the United Arab Emirates, it has worked to better integrate the “Global South’s” development needs and ambitions with that of the G20. Modi has touted innovative partnerships for a new multilateral rail and sea corridor to connect India with the Middle East and the European Union (EU)—seen as a counterweight to China’s vast Belt-and-Road infrastructure corridor.

India reached its latest notable trade pact, nearly 16 years in the making, in March with the European Free Trade Association—Iceland, Liechtenstein, Norway and Switzerland. The agreement lifts Indian tariffs to secure US$100 billion in foreign direct investment commitments from the non-EU markets to India across multiple sectors.

With India still an enviable investment powerhouse, it seems important to clarify a few aspects of this dynamic equity market.

How exchange-traded funds (ETFs) treat India capital gains tax (CGT)

Foreign investors should be aware that CGT is an integral part of investing in Indian equities that cannot be circumvented. Investors in India funds are subject to CGT implications regardless of fund provider, and CGT is based and calculated on a fund as a whole, not an individual investor’s position.

The details: Foreign investors owning local Indian stocks are subject to taxation on capital gains at a short-term rate of 15% for positions held for less than one year and at a long-term rate of 10% for positions held over one year.

To accrue or not to accrue: Consistent with market practice for US-listed India ETF providers, Franklin Templeton accrues unrealized CGT in its daily net asset value (NAV). This can lead to differences in performance relative to the benchmark, which does not include CGT. As a result, rising markets will typically lead to fund underperformance against a benchmark, while weaker market environments will typically generate outperformance (provided the fund is in an unrealized capital gain position where the current market value of fund holdings is above their historical book cost). See chart below.

For UCITS-listed India funds, there is a divergence in methods utilized by fund providers in accruing and reporting CGT. Some do not accrue unrealized CGT in the NAV, but will charge CGT to investors directly at redemption, which we believe leaves investors with a level of opaqueness and uncertainty over their ultimate proceeds. This method also creates an elevated NAV compared to what investors will actually experience. While Franklin Templeton’s approach to CGT may at times lead to a higher tracking difference,1 we believe investors benefit from increased transparency and a more reflective experience.

The magnitude and impact of CGT for a specific fund is heavily dependent on several variables, such as the timing of purchases and sales, performance of the holdings and their volatility, and the size of flows in and out of the fund relative to its assets under management (AUM).

Understanding the impact: The CGT impact to fund performance is driven by the path of returns, timing of individual lots and price points. Very broadly speaking, in rising markets, an NAV-accruing fund will likely underperform its benchmark and vice versa.

Consideration of comparability: Because different providers handle CGT differently, the comparability of fund performance metrics may be affected. As investors, it’s prudent to consider how these nuances may influence investment decisions within the broader context of your financial strategy.

The bigger picture: While CGT considerations are important, they should be viewed within the broader spectrum of investment objectives and risk tolerance. Taking a long-term perspective and being mindful of other important characteristics of the investment vehicle of choice may aid in the decision-making process.

In summary, India remains an attractive investment destination with compelling growth prospects for its equity markets. Investors seeking India allocation through an ETF should be aware of the current tax regime and what varying methods of accounting methodologies really mean for fund valuation.

Fortsätt läsa

Nyheter

XB33 ETF köper företagsobligationer i euro som förfaller 2033

Publicerad

den

Xtrackers II Target Maturity Sept 2033 EUR Corporate Bond UCITS ETF 1D (XB33 ETF) med ISIN LU2673523564, försöker följa Bloomberg MSCI Euro Corporate September 2033 SRI-index. Bloomberg MSCI Euro Corporate September 2033 SRI-index följer företagsobligationer denominerade i EUR. Indexet speglar inte ett konstant löptidsintervall (som är fallet med de flesta andra obligationsindex). Istället ingår endast obligationer som förfaller mellan oktober 2032 och september 2033 i indexet (ETF kommer att stängas i efterhand). Indexet består av ESG (environmental, social and governance) screenade företagsobligationer. Betyg: Investment Grade.

Xtrackers II Target Maturity Sept 2033 EUR Corporate Bond UCITS ETF 1D (XB33 ETF) med ISIN LU2673523564, försöker följa Bloomberg MSCI Euro Corporate September 2033 SRI-index. Bloomberg MSCI Euro Corporate September 2033 SRI-index följer företagsobligationer denominerade i EUR. Indexet speglar inte ett konstant löptidsintervall (som är fallet med de flesta andra obligationsindex). Istället ingår endast obligationer som förfaller mellan oktober 2032 och september 2033 i indexet (ETF kommer att stängas i efterhand). Indexet består av ESG (environmental, social and governance) screenade företagsobligationer. Betyg: Investment Grade.

Den börshandlade fondens TER (total cost ratio) uppgår till 0,12 procent p.a. Xtrackers II Target Maturity Sept 2033 EUR Corporate Bond UCITS ETF 1D är den enda ETF som följer Bloomberg MSCI Euro Corporate September 2033 SRI-index. ETFen replikerar det underliggande indexets prestanda genom samplingsteknik (köper ett urval av de mest relevanta indexbeståndsdelarna). Ränteintäkterna (kupongerna) i ETFen delas ut till investerarna (Minst årligen).

Denna ETF lanserades den 8 november 2023 och har sin hemvist i Luxemburg.

Bloomberg MSCI Euro Corporate SRI PAB Index syftar till att spegla resultatet på följande marknad:

  • EUR-denominerade företagsobligationer
  • Endast obligationer med investeringsklass
  • Obligationer med en löptid på minst 1 år
  • Minsta utestående belopp på 300 miljoner euro per obligation
  • Endast obligationer utgivna av företag med en MSCI ESG-rating på BBB eller högre och en MSCI ESG Impact Monitor över 1 ingår

Indexet övervakar absoluta växthusgasutsläpp (“GHG”) genom att sätta en initial 50 % avkolning av absoluta växthusgasutsläpp i förhållande till moderuniversumet följt av en årlig 7 % avkolningsbana för absoluta växthusgasutsläpp.

Obligationer utgivna av företag som är involverade i alkohol, tobak, hasardspel, vuxenunderhållning, genetiskt modifierade organismer (GMO), kärnkraft, civila skjutvapen, militära vapen (inklusive minor, klusterbomber, kemiska vapen) är undantagna.

Handla XB33 ETF

Xtrackers II Target Maturity Sept 2033 EUR Corporate Bond UCITS ETF 1D (XB33 ETF) är en europeisk börshandlad fond. Denna fond handlas på Deutsche Boerse Xetra.

Det betyder att det går att handla andelar i denna ETF genom de flesta svenska banker och Internetmäklare, till exempel DEGIRONordnet, Aktieinvest och Avanza.

Börsnoteringar

BörsValutaKortnamn
XETRAEURXB33

Största innehav

ISINNamnVikt %Land
IE00BZ3FDF20DEUTSCHE GLOBAL LIQUIDITY SERI0.54%Irland
CH1214797172BBG01BFYVYX8 CREDIT SUISSE GROUP AG 3/290.18%Schweiz
XS0525602339RABOBANK 07/250.14%Holland
FR0000471930FRANCE TELECOM 01/330.13%Frankrike
FR0013324357SANOFI SA 1.375% 2030-03-210.12%Frankrike
XS1001749289MICROSOFT CORP 12/280.12%USA
XS1372839214VODAFONE GROUP PLC 08/26 EUR515200.12%Storbritannien
XS2461234622BBG0162QT3D3 JPMORGAN CHASE AND CO 3/300.11%USA
XS2235996217NOVARTIS FINANCE SA 9/280.11%Spanien
XS2705604234BBG01JPP1244 BANCO SANTANDER SA 10/310.11%Spanien
FR0013398070BNP PARIBAS 01/26 AW7468680.11%Frankrike
XS2180007549AT&T INC 5/280.11%Frankrike
XS2149207354GOLDMAN SACHS GROUP INC 3/250.10%USA
XS1603892149MORGAN STANLEY DEAN WITTER 04/27 AN3187610.10%USA
CH0537261858CREDIT SUISSE GROUP AG SR UNSECURED REGS 04/26 VAR 4/250.10%Schweiz

Innehav kan komma att förändras

Fortsätt läsa

Populära