
Nyheter
Ripple Expected to Settle Tomorrow, Tether Solidifies Reserves: What Happened in Crypto This Week?
Last week, the World Bank warned that oil prices could reach record highs of up to $150 a barrel on the back of the escalating war in the Middle East. Winter is coming, and an oil crisis even worse than that of 2022 would take a toll on consumer prices around the world. With U.S. inflation data scheduled for next week, short-term interest rate targets remain unchanged between 5.25% and 5.5%, with the possibility of raising them again as inflation is still well above the Fed’s 2% target. In this turbulent, unpredictable macroenvironment, more investors resorted to risk-on assets, such as equities and crypto. Nasdaq and S&P 500 are up by nearly 5% week-over-week. Bitcoin and Ethereum increased by 2.2% and 3.8% over the past week, respectively. The biggest winners of last week were Cardano (19.76%), Polygon (16.4%), and Aave (19.71%). In this report, we walk you through developments in the Ripple lawsuit, as well as developments in the Gemini Earn case. We also include highlights from Tether’s Q3 attestation report and how Cosmos is expanding its interoperability with Avalanche.
Figure 1: Weekly Price and TVL Developments of Cryptoassets in Major Sectors
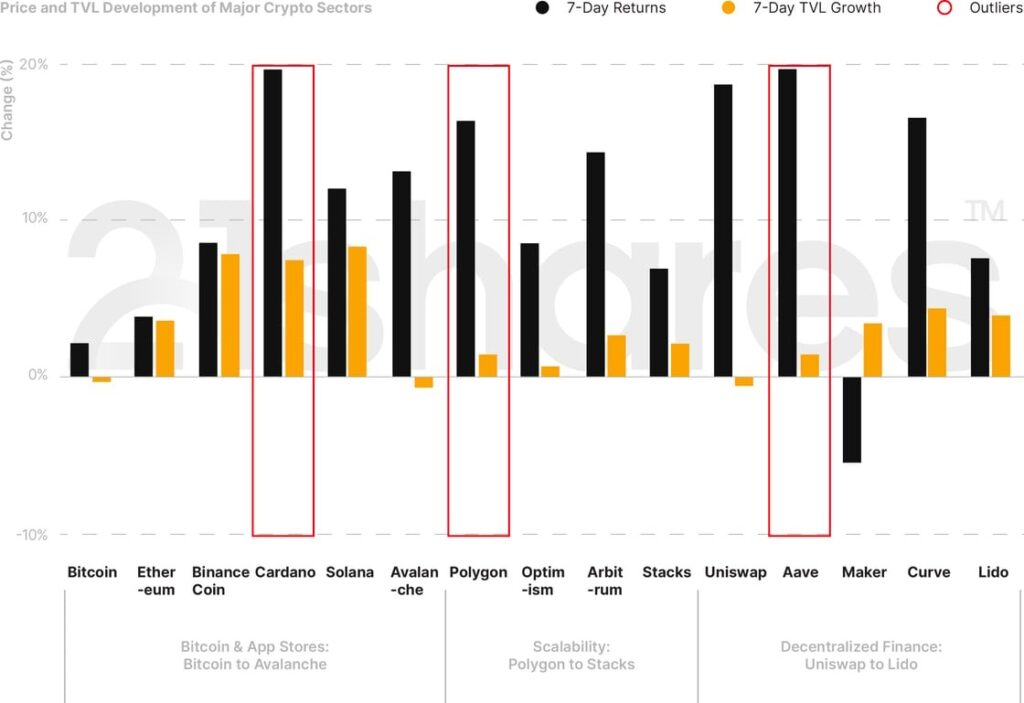
Source: 21Shares, CoinGecko, DeFi Llama. Close data as of November 7, 2023.
5 Things to Remember in Markets this Week:
The Quest to Make Gemini Earn Investors Whole
On October 27, Gemini filed an adversary complaint against three Genesis entities and asked a New York bankruptcy court to grant it access to the over 62 million GBTC shares, which Genesis promised to deliver to secure loans made by Gemini users as part of its Gemini Earn program. Today, the collateral is worth nearly $1.7B, an amount that would completely satisfy the claims of every single Earn user. Genesis received another blow as the government did not support its updated bankruptcy plan to liquidate assets instead of reorganizing them. The bankruptcy court held a hearing to consider approval of the Disclosure Statement on November 7. As mentioned in our previous newsletter, the allegations in this lawsuit can further discourage users from leaving their assets on centralized exchanges or engaging with them at all. As shown in the figure below, Bitcoin and Ethereum’s balance on centralized exchanges has been in constant decline since the FTX fallout.
Figure 2: BTC and ETH Balance on Exchanges
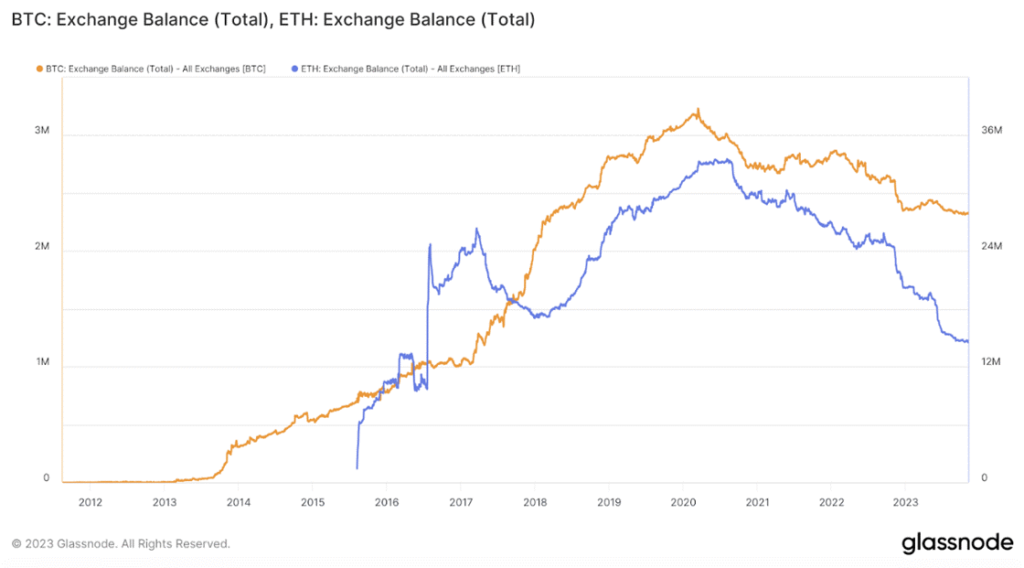
Source: Glassnode
Bitcoin Transaction Fees Surge to June Highs
Bitcoin fees are once again surging, driven by the minting of Bitcoin’s NFTs, known as Ordinal inscriptions. The average transaction fee is now $5.93, up over 500% from August 2023 lows of ~$0.8 and the highest since June 23. Nearly 1.9 million ordinals were uploaded to Bitcoin in the past two weeks, signaling a revived on-chain demand, compared to less than 900K in the preceding 30 days. While ordinals have been limited to meme-coin implementations, they do act as a proxy for increasing demand for Bitcoin blockspace. Transaction fees now constitute ~8.5% of miners’ revenue, which is timely in the context of Bitcoin’s approaching halving, which will reduce the block rewards from 6.25 to 3.125 BTC, which some see as a deterrent for continuing to support Bitcoin’s mining activities. This is also relevant as it shows an appetite for engagement with the underlying network.
Figure 3: Total Number of Created Bitcoin NFTs
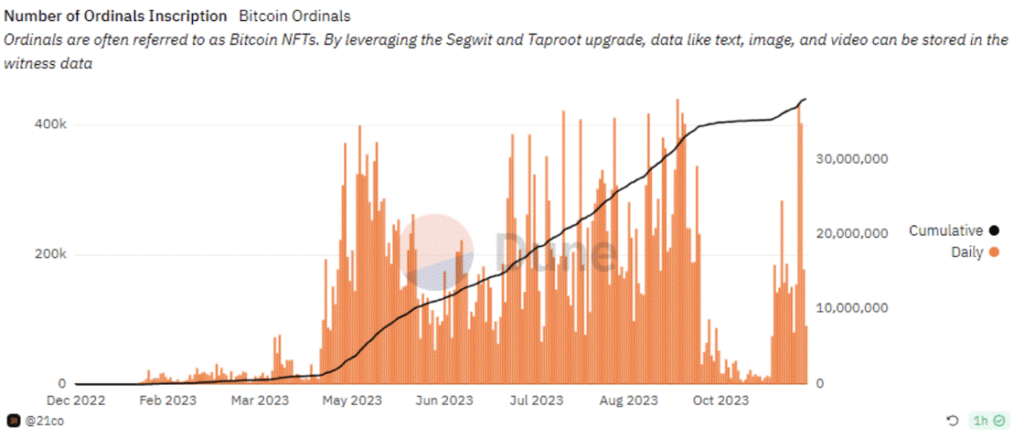
Source: 21.co on Dune Analytics
Ripple Continues its CBDC Mission
The National Bank of Georgia selected Ripple as its official technology partner to implement and deploy its central bank digital currency (CBDC), the digital lari. For context, Ripple launched its CBDC Platform last May, providing a holistic end-to-end solution that enables central banks, financial institutions, and governments to seamlessly mint, manage, transact, and redeem CBDCs. Ripple continues to secure strategic partnerships to enforce its value proposition as a crypto-native software solution for central banks around the world. So far, it has forged deals with Colombia, Palau, Bhutan, Montenegro, and Hong Kong to execute their CBDCs. Back in the U.S., Ripple is in its final steps to settle with the Securities and Exchanges Commission (SEC) before November 9. So far, there has been no announcement of settlement talks. According to Ripple’s legal team, if the settlement fee for the institutional sales of XRP is $20M or less, it would be a great advantage to Ripple, whose XRP token rallied 22.6% week-over-week. With this potential regulatory win, the Ripple case sets a new precedent for the industry, specifically in the case of “programmatic sales” of its XRP token on the secondary market. To learn more about the Ripple case, check out the special report that we published back in July.
Tether’s Cash Reserves Reach the Highest Percentage
Tether’s Q3 attestation report showed that cash and cash equivalents accounted for 85.7% of the leading stablecoin issuer’s total reserves. A ”vast majority” of those reserves are U.S. T-Bills, which comprised $72.6B in both direct and indirect exposure. The report also highlighted that secured loans extended by Tether have been reduced by over $330M, although it had previously stated that it would stop issuing secured loans in 2023. Moreover, the German data center, Northern Data, secured $610M in unsecured debt from Tether for financing its Bitcoin mining, AI, and data center operations. This is a crucial data point that we’ll be closely monitoring to better understand the level of risk Tether is taking on. Nevertheless, flows into Tether’s USDT have increased by 2% month-over-month, reaching its market cap to a new record high of $85.5B.
Cosmos Expanding Interoperability to Avalanche
Cosmos interoperability technology has been successfully exported to the Avalanche network on the testnet. The integration involved building a light Inter Blockchain communication (IBC) protocol client on Avalanche to allow seamless connectivity between both networks, along with the other 50+ IBC-enabled chains. This is a significant milestone as it marks the first integration outside the Cosmos ecosystem.
Not only does this development bring us closer to a trustless multi-chain future that doesn’t depend on vulnerable cross-chain bridges, but it also unlocks new opportunities for both ATOM and AVAX, making them more appealing to markets with higher demand, such as BNB, third largest blockchain by AUM. Finally, it’s worth noting that Avalanche isn’t the final destination, especially due to its underwhelming $550M AUM, but rather a starting point for expanding IBC to networks like Solana and Ethereum with much deeper liquidity and a vibrant user base. The timing is also crucial for Cosmos to maintain its relevance, especially in light of Chainlink’s aggressive efforts to expand its interoperability protocol, CCIP.
Figure 4: Daily Active Addresses On Cosmos, Ethereum, Solana, and Avalanche
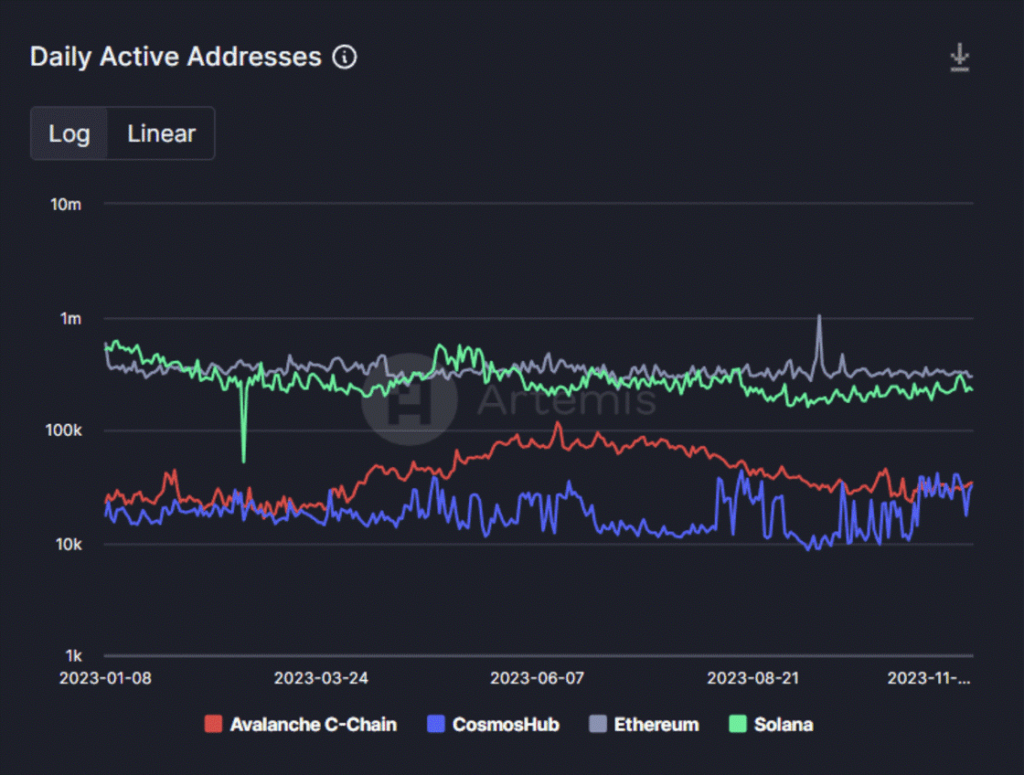
Source: Artemis
What You Should Pay Attention To
Arbitrum Staking Proposal and the Implications for the Scalability Landscape
The Arbitrum DAO is currently contemplating enabling ARB token staking, proposing to fund it with 175M, 150M, 125M, or 100M ARB tokens over the course of 12 months from the treasury. It is worth noting that Arbitrum depends on Ethereum for security, so staking here is misleading as it simply is a yield-generating activity, in contrast to contributing to the network’s security, much like Ethereum staking. Crucially, this approach suggests using existing treasury funds rather than sharing revenue to avoid legal scrutiny and steering clear of making ARB a security, all while keeping the door open for future value accrual models like sharing sequencer revenue.
Although concerns about securitization persist, this initiative is promising for Arbitrum as it could set it apart within the scalability sector. More importantly, it could catalyze change for other scaling projects with limited token utility beyond governance, drawing inspiration from past attempts like Uniswap’s free-switch proposal, which would have turned UNI into a yield-bearing asset but failed. That said, the effectiveness of this approach remains to be seen, as it could inadvertently amplify the token’s inflation for ARB down the line by offering a staggering 130% APR if the current vote of 100M tokens is enacted instead of supporting the network’s participants and helping grow its ecosystem. Nonetheless, it’s an intriguing development that highlights the challenge of making tokens useful in the L2 vertical.
Enhancing Solana’s Accessibility and User-Friendliness: Key Upgrades Discussed at the Breakpoint Conference
Solana’s annual conference revealed compelling developments expected to fuel the network’s recent momentum. Firstly, the network’s long-anticipated Fire Dancer client was finally deployed on the testnet. For reference, a validator client is a software that acts on behalf of a validator to verify transactions and participate in consensus. Previously, Solana relied solely on a single software, leading to network outages when it encountered issues. Thus, the introduction of this new client will be crucial in solving the single point of failure on the validator software layer.
On a different note, Solana Labs announced that nodes can now be deployed on Amazon Web Services as part of their Blockchain Node Engine Program. AWS-based nodes can engage in both consensus and RPC calls, simplifying the intricacies of running a validator and making it accessible to a broader audience. It’s important to highlight, however, that depending on centralized cloud providers like AWS could pose a vulnerability, as demonstrated by Hetzner’s anti-crypto policies last year, which threatened Ethereum nodes’ presence on the platform. Hence, while this integration opens up access to a broader user base, it’s crucial for the industry to actively work on abstracting the validation process to reduce dependence on centralized service providers.
Lastly, Solana introduced its first smart wallet. This user-friendly wallet offers social recovery and eliminates the need for seed phrases, addressing key adoption hurdles for non-crypto-native users. All in all, It’s exciting to witness these substantial advancements reigniting enthusiasm within the Solana community, as indicated by the resurgence in transaction values, which had previously stagnated following the FTX collapse.
Figure 5: Total Value Transacted On-chain on Solana
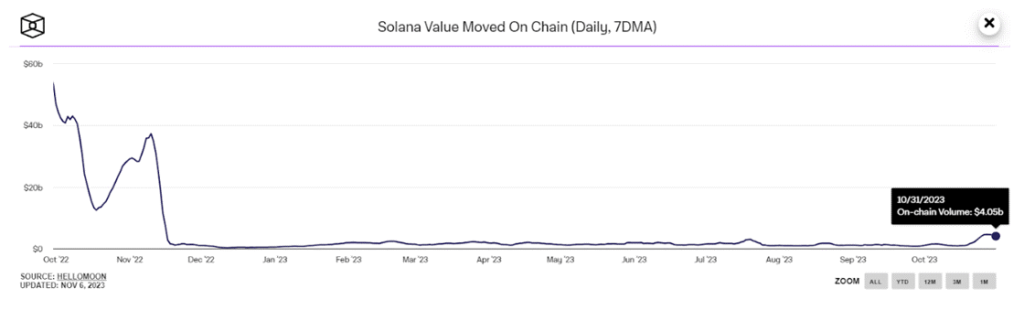
Source: The Block
Bookmarks
• Find out more about price movements in October in our latest Crypto of the Month.
• Check out our webinar, where the Research Team introduced the latest issue of the State of Crypto, featuring a special guest.
• Get a digital copy of State of Crypto issue 10!
Next Week’s Calendar
These are the top 3 events we’re monitoring for next week.
• November 8 and 9: Fed Chair Jerome Powell will speak on two different occasions.
• November 9: SEC and Ripple’s deadline to settle.
• November 14: Monthly and yearly inflation data in the U.S.
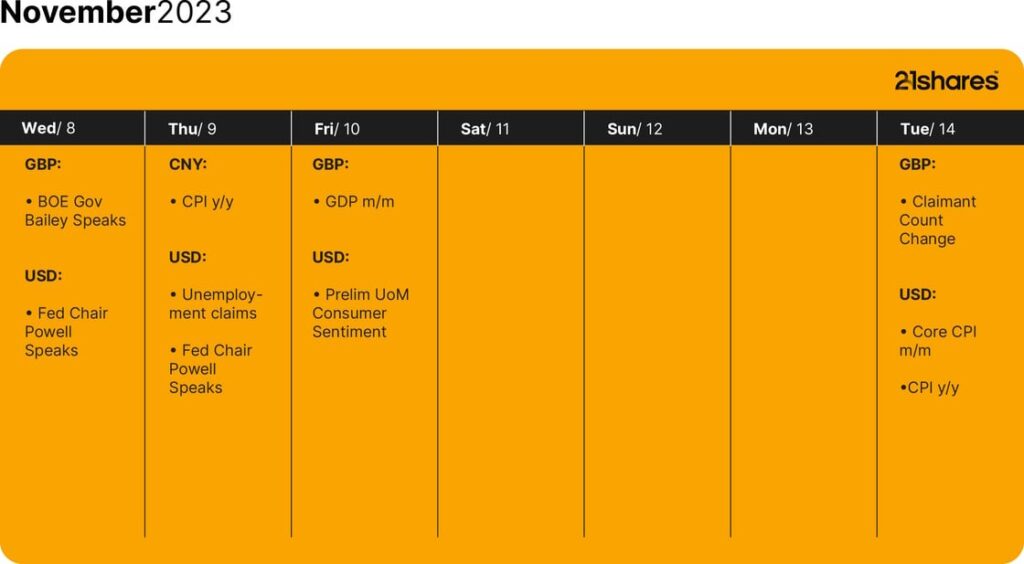
Source: 21shares, Forex Factory
Research Newsletter
Each week the 21Shares Research team will publish our data-driven insights into the crypto asset world through this newsletter. Please direct any comments, questions, and words of feedback to research@21shares.com
Disclaimer
The information provided does not constitute a prospectus or other offering material and does not contain or constitute an offer to sell or a solicitation of any offer to buy securities in any jurisdiction. Some of the information published herein may contain forward-looking statements. Readers are cautioned that any such forward-looking statements are not guarantees of future performance and involve risks and uncertainties and that actual results may differ materially from those in the forward-looking statements as a result of various factors. The information contained herein may not be considered as economic, legal, tax or other advice and users are cautioned to base investment decisions or other decisions solely on the content hereof.


Nyheter
HANetf blir den största ETF-utgivaren på Warszawabörsen, med 8 nya UCITS ETF-noteringar och fler på gång


Defiance utökar sitt europeiska utbud med lanseringen av Europas första minnes-ETF

KBOT ETF investerar i humanoida robotar

HANetf blir den största ETF-utgivaren på Warszawabörsen, med 8 nya UCITS ETF-noteringar och fler på gång

ASWA ETF ger exponering mot kärnbränsle- och energiindustrin

Nya ETF- och ETP-noteringar den 19 juni 2026 på Deutsche Börse

USA satsar 2 miljarder dollar på kvantdatorer – så kan investerare dra nytta av utvecklingen

Extrema skillnader: Varför presterar Europas kvantdator-ETFer så olika?

QQCC ETF följer företag världen över som är aktiva inom kvantberäkning

Fastställd utdelning i MONTDIV maj 2026

Varför Plus500 är en dröm för finans-affiliate
-
 Nyheter4 veckor sedan
USA satsar 2 miljarder dollar på kvantdatorer – så kan investerare dra nytta av utvecklingen
-
 Nyheter3 veckor sedan
Extrema skillnader: Varför presterar Europas kvantdator-ETFer så olika?
-
 Nyheter3 veckor sedan
QQCC ETF följer företag världen över som är aktiva inom kvantberäkning
-
 Nyheter4 veckor sedan
Fastställd utdelning i MONTDIV maj 2026
-
 Nyheter3 veckor sedan
Varför Plus500 är en dröm för finans-affiliate
-

 Nyheter3 veckor sedan
ETFer för fotbolls-VM 2026
-

 Nyheter3 veckor sedan
21shares produkter nu finns tillgängliga hos Revolut
-

 Nyheter6 dagar sedan
Den osynliga flaskhalsen i AI-boomen: Varför elinfrastruktur är nästa stora megatrend