Följ oss

Nyheter

Real Assets Fueled by Energy

Publicerad

den

The VanEck Vectors Real Asset Allocation ETF (RAAX) uses a data-driven, rules-based process that leverages over 50 indicators (technical, macroeconomic and fundamental, commodity price, and sentiment) to allocate across 12 individual real asset

The VanEck Vectors Real Asset Allocation ETF (RAAX) uses a data-driven, rules-based process that leverages over 50 indicators (technical, macroeconomic and fundamental, commodity price, and sentiment) to allocate across 12 individual real asset segments in five broad real asset sectors. These objective indicators identify the segments with positive expected returns. Then, using correlation and volatility, an optimization process determines the weight to these segments with the goal of creating a portfolio with maximum diversification while reducing risk.

April Performance Summary

The VanEck Vectors Real Asset Allocation ETF (RAAX) launched, on April 9, into a period of strong performance for real assets. RAAX performed well on both an absolute and relative basis. Through April, in the first 16 days of its life, RAAX returned +2.98% based on net asset value versus +2.41% for its benchmark, the Blended Real Asset Index, which is comprised of an equally weighted blend of the returns of Bloomberg Commodity Index, S&P Real Assets Equity Index, and VanEck Natural Resources Index*. Equal weightings are reset monthly.

Total Returns (%) as of April 30, 2018
 1 MoYTD1 YearLife
(04/09/18)
RAAX (NAV)2.98
RAAX (Share Price)3.26
Blended Real Asset Index*2.41
Total Returns (%) as of March 31, 2018
 1 MoYTD1 YearLife
(04/09/18)
RAAX (NAV)
RAAX (Share Price)
Blended Real Asset Index*

The table presents past performance which is no guarantee of future results and which may be lower or higher than current performance. Returns reflect temporary contractual fee waivers and/or expense reimbursements. Had the ETF incurred all expenses and fees, investment returns would have been reduced. Investment returns and ETF share values will fluctuate so that investors’ shares, when redeemed, may be worth more or less than their original cost. ETF returns assume that distributions have been reinvested in the Fund at NAV.

Returns less than a year are not annualized.

Expenses: Gross 0.81%; Net 0.74%. Expenses are capped contractually at 0.55% through February 1, 2020. Expenses are based on estimated amounts for the current fiscal year. Cap exclude certain expenses, such as interest, acquired fund fees and expenses, and trading expenses.

RAAX’s positioning was moderately defensive in April, and it was fully invested across commodities, natural resource equities, and Master Limited Partnerships (”MLPs”). The largest real asset investments were in diversified commodities (30%), gold bullion (20%), and agribusiness equities (20%).

May Positioning: Fully Invested and Mostly Bullish

RAAX remains fully invested across commodities, natural resource equities, and MLPs. As they were at launch, the largest weightings remain in diversified commodities (30%), gold bullion (20%), and agribusiness equities (20%). However, its allocation to gold equities now stands at 10%, increasing overall gold exposure to 30%.

We are bullish on most real assets. Based on the model’s analysis, diversified commodities, gold, agribusiness equities, MLPs, steel equities, oil services equities, and unconventional oil and gas equities are all well positioned to perform. We are bearish on Real Estate Investment Trusts (REITs), infrastructure, base metal equities, and coal equities.

Asset Class Weights

Charts indicating real asset sector and asset class weights for May 2018

Source: VanEck. Data as of May 2, 2018.

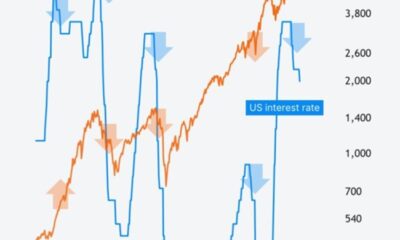
This month we increased our exposure to gold equities and removed our exposure to coal equities. Another notable point is that we are bearish on two interest rate sensitive sectors, REITs and infrastructure, as interest rates continue to rise.

Remember, RAAX only invests in asset classes that the model is bullish on, and the weightings themselves are not an indication of conviction but a byproduct of a quantitative process that seeks to maximize diversification and minimize volatility. Let’s take a look at some of the reasons why RAAX maintains a bullish or bearish position on certain asset classes.

Gold

The model remains bullish, and overall exposure increased based on the portfolio diversification benefits that gold provides. Gold prices have been flat this year, but the precious metal has provided stability during periods of broad market stress.

Cumulative Growth of $10,000 of Gold and S&P 500 Index in 2018

Line chart showing cumulative growth of $10,000 of gold and S&P 500 Index in 2018Source: FactSet; Bloomberg. Data as of May 2, 2018. Past performance is no guarantee of future results. Investors cannot invest directly in an index.

Oil Services Equities

Research conducted here at VanEck has identified that oil price and the S&P 500 Index can be used to explain most of the performance of oil services stocks historically. Using these variables to generate an expected return for oil services stocks, we can look at the difference between this and the actual return of oil services stocks. Right now, based on these variables, oil services stocks are trading at a substantial discount, and the chart below shows that oil services stocks haven’t been this cheap since 2001.

Performance Variance of Oil Servicers and Key Independent Variables

Graph of the performance variance of oil servicers and key independent variables, highlighting the current -2.60 standard deviation below their historical mean relationship, which is the biggest difference since 2001 Source: VanEck; FactSet; Bloomberg. Data as of April 2018. Past performance is no guarantee of future results. Oil servicers measured by the MVIS U.S. Listed Oil Services 25 Index. Investors cannot invest directly in an index.

The model remains bullish on oil services stocks. Key bullish indicators include strong oil prices, reasonable volatility in oil services equities, and strong demand for natural gas. The chart below shows that oil prices are up 14.83% this year through April.

Cumulative Growth of $10,000 of Crude Oil in 2018

Line chart showing cumulative growth of $10,000 of crude oil in 2018Source: FactSet. Data as of April 30, 2018. Past performance is no guarantee of future results. Oil measured by West Texas Intermediary (WTI) oil price. Investors cannot invest directly in an index.

Coal Equities

At launch, RAAX had a small weighting to coal, but in May, this exposure was completely eliminated based on falling coal equity prices and weakening supply and demand data. Below is our economic composite for coal. It turned bearish at the end of April due to declining demand for coal in the U.S. and China, and declining production in the U.S.

Coal Economic Indicator Composite

Chart showing the coal economic indicator compositeSource: VanEck. Data as of April 30, 2018. Past performance is no guarantee of future results. Coal equities measured by MVIS Global Coal Index. Investors cannot invest directly in an index.

A Closer Look at the What, When, and How

Step One: What to Own

The aphorism ”a rising tide lifts all boats” is appropriate here. April was a great month to invest in real assets. Each real asset in our investment universe and the approximated holding period return of the underlying index is listed below. The assets that we were bearish on are shaded.

Holding Period Return
April 10 – April 30, 2018

Gold Equities1.42%Oil Services Equities13.97%
Agribusiness Equities1.22%Unconventional Oil & Gas Equities12.36%
Coal Equities-1.78%Global Metals & Mining Equities4.65%
Gold Bullion-1.56%Diversified Commodities3.60%
MLPs6.08%REITs1.53%
Global Infrastructure1.53%Steel Equities7.42%

Source: Bloomberg; FactSet. Data as of April 30, 2018. Past performance is no guarantee of future results. Investors cannot invest directly in an index.

Step Two: When to be Invested

We were fully invested in April. This was the right call as real asset investments rallied. RAAX begins to raise a cash position when five or more assets become bearish. This is typically indicative of a systemic market event. RAAX has not raised cash since it launched.

Step Three: How to Allocate

Capital is allocated amongst assets on which the model is bullish on using an optimization process designed to maximize our diversification and minimize our volatility. In April, this resulted in a 50% exposure to commodities, a 45% exposure to natural resource equities, and a 5% exposure to MLPs. RAAX’s allocation in May has not changed drastically.

Monthly Asset Class Changes

Asset ClassMay-18Apr-18Change
Gold Equities10%5%5%
Diversified Commodities30%30%0%
Agribusiness Equities20%20%0%
Gold Bullion20%20%0%
Limited Partnerships5%5%0%
Service Equities5%5%0%
Cash0%0%0%
Unconventional Oil & Gas Equities5%5%0%
Steel Equities5%5%0%
Estate Investment0%0%0%
Global Infrastructure0%0%0%
Metals and Mining Equities0%0%0%
Coal Equities0%5%-5%

Source: VanEck. Data as of May 2, 2018.

Fortsätt läsa
Annons
Klicka för att kommentera

Skriv en kommentar

Din e-postadress kommer inte publiceras. Obligatoriska fält är märkta *

Nyheter

April in ETFs: Gold at New Highs, Crypto in Transition, and Moat Index Holding Steady

Publicerad

den

As April winds down, markets remain on edge, with escalating tariffs and renewed trade tensions keeping volatility in focus. In this summary of our full-length newsletter, we spotlight gold and gold equities, both of which have surged to record levels. We also take a step back from the day-to-day noise in crypto to explore the broader shifts in the regulatory landscape in our latest Whitepaper and present Celestia in detail. Finally, we assess how Moat indexes have held up and evolved amid the turbulence.

As April winds down, markets remain on edge, with escalating tariffs and renewed trade tensions keeping volatility in focus. In this summary of our full-length newsletter, we spotlight gold and gold equities, both of which have surged to record levels. We also take a step back from the day-to-day noise in crypto to explore the broader shifts in the regulatory landscape in our latest Whitepaper and present Celestia in detail. Finally, we assess how Moat indexes have held up and evolved amid the turbulence.

Your VanEck Europe team wishes you a great read.


Featured Articles

🥇 Are Gold Mining Equities Regaining Attention Amid Rising Gold Prices?

Gold & Gold mining equities tend to shine during stress periods

Source: VanEck, World Gold Council.

Gold has attracted renewed interest from investors amid concerns about inflation, currency volatility, and overall market uncertainty. Gold mining companies have recently reported improved profit margins and cash generation, with some initiating share buybacks and maintaining relatively strong balance sheets. Despite these developments, many continue to trade below their historical valuation averages.

While historical trends indicate that gold and gold mining equities have outperformed during certain periods of market stress, these patterns may not repeat under different economic conditions. Performance can be influenced by a range of factors including interest rates, central bank policy, geopolitical developments, and investor sentiment.

→ Read more

⚖️ Whitepaper Highlights: How New Crypto Regulations May Shape the Future

Cryptocurrencies are entering a new era. With the re-election of Donald Trump and the implementation of the European Union’s Markets in Crypto-Assets (MiCA) regulation, digital assets are moving into a landscape defined not just by innovation, but also by regulatory clarity.

MiCA’s structured and transparent approach aims to promote legitimacy, safeguard investors, and enhance trust in digital asset markets across Europe. It could also serve as a blueprint for other jurisdictions looking to regulate crypto effectively.

→ Read the Whitepaper Highlights

⛓️ Introduction to Celestia

Most blockchains, like Ethereum or Bitcoin, are monolithic which means they perform all major functions (consensus, data availability, and execution) on a single layer. This design ensures security but according to new modular networks, limits scalability and flexibility.

The modular blockchain thesis, which Celestia is leading, proposes separation of layers and respective responsibilities in the network.

→ Read more

Note: This article in not accessible to our UK readers.

🌊 Riding the Gold Wave

Chasing the Vein: Fund Flows into Gold Miners

Source: Mining.com. Data as of 21 March 2025. Note: Data covers 493 funds with combined assets under management of $62 billion.

U.S. equity markets experienced significant declines during the month of March. Meanwhile, spot gold price recorded new all-time highs, surpassing the $3,000 per ounce mark on 14 March and closing at a record price of $3123.57 on March 31, a 9.30% ($265.73) monthly gain. As of 31 March, gold prices have risen by 93.61% over the past five years (1). Investors should keep in mind that past performance is not representative of future results.

The gold miners, as represented by the NYSE Arca Gold Miners Index (GDMNTR), outperformed significantly, up 15.51% during March (2). This gain reflects both their operational leverage to rising gold prices and market perceptions of relative value. However, gold miners can also be subject to heightened volatility, operational risks, and sensitivity to commodity price swings.

While gold and gold equities may serve as diversifiers in a portfolio due to their historically low correlations with many asset classes, investors should remain mindful of the inherent risks, including price volatility, currency movements, and shifts in investor sentiment that can lead to rapid reversals in performance.

→ Read more

🌪️ Moat Stocks Weather Tariff Tumble

Market turbulence in March weighed on stocks. The Moat Index was not immune to the market turmoil, as it declined along with the broad U.S. equity market ending the month lower. However, the Moat Index showed resilience relative to the S&P 500—thanks in part to defensive sector resilience and underweight exposure to mega-caps.

At the same time, the SMID Moat Index lagged small and mid-caps in March. Smaller U.S. stocks were also impacted by global trade tensions and economic growth concerns with the broad small- and mid-cap benchmarks falling during the month. However, year-to-date, the SMID Moat Index remains ahead of the broader small- and mid-cap markets.

→ Read more


This is a preview of our monthly ETF insights email newsletter.

To receive the full version, sign up here.


(1) Source: World Gold Council, ICE Data Services, FactSet Research Systems Inc.

(2) Source: Financial Times.

IMPORTANT INFORMATION

This is marketing communication. Please refer to the prospectus of the UCITS and to the KID/KIID before making any final investment decisions. These documents are available in English and the KIDs/KIIDs in local languages and can be obtained free of charge at www.vaneck.com, from VanEck Asset Management B.V. (the “Management Company”) or, where applicable, from the relevant appointed facility agent for your country.

For investors in Switzerland: VanEck Switzerland AG, with registered office in Genferstrasse 21, 8002 Zurich, Switzerland, has been appointed as distributor of VanEck´s products in Switzerland by the Management Company. A copy of the latest prospectus, the Articles, the Key Information Document, the annual report and semi-annual report can be found on our website www.vaneck.com or can be obtained free of charge from the representative in Switzerland: Zeidler Regulatory Services (Switzerland) AG, Neudtadtgasse 1a, 8400 Winterthur, Switzerland. Swiss paying agent: Helvetische Bank AG, Seefeldstrasse 215, CH-8008 Zürich.

For investors in the UK: This is a marketing communication targeted to FCA regulated financial intermediaries. Retail clients should not rely on any of the information provided and should seek assistance from a financial intermediary for all investment guidance and advice. VanEck Securities UK Limited (FRN: 1002854) is an Appointed Representative of Sturgeon Ventures LLP (FRN: 452811), which is authorised and regulated by the Financial Conduct Authority (FCA) in the UK, to distribute VanEck´s products to FCA regulated firms such as financial intermediaries and Wealth Managers.

This information originates from VanEck (Europe) GmbH, which is authorized as an EEA investment firm under MiFID under the Markets in Financial Instruments Directive (“MiFiD). VanEck (Europe) GmbH has its registered address at Kreuznacher Str. 30, 60486 Frankfurt, Germany, and has been appointed as distributor of VanEck products in Europe by the Management Company. The Management Company is incorporated under Dutch law and registered with the Dutch Authority for the Financial Markets (AFM).

This material is only intended for general and preliminary information and shall not be construed as investment, legal or tax advice. VanEck (Europe) GmbH and its associated and affiliated companies (together “VanEck”) assume no liability with regards to any investment, divestment or retention decision on the basis of this information. The views and opinions expressed are those of the author(s) but not necessarily those of VanEck. Opinions are current as of the publication date and are subject to change with market conditions. Information provided by third party sources is believed to be reliable and have not been independently verified for accuracy or completeness and cannot be guaranteed.

Morningstar® Wide Moat Focus IndexSM, Morningstar® US Sustainability Moat Focus Index, Morningstar® US Small-Mid Cap Moat Focus IndexSM, and Morningstar® Global Wide Moat Focus IndexSM are trademarks or service marks of Morningstar, Inc. and have been licensed for use for certain purposes by VanEck. VanEck’s ETFs are not sponsored, endorsed, sold or promoted by Morningstar, and Morningstar makes no representation regarding the advisability of investing in the ETFs. Morningstar bears no liability with respect to the ETFs or any securities.

Effective December 15, 2023, the carbon risk rating screen was removed from the Morningstar® US Sustainability Moat Focus Index. Effective December 17, 2021, the Morningstar® Wide Moat Focus IndexTM was replaced with the Morningstar® US Sustainability Moat Focus Index. Effective June 20, 2016, Morningstar implemented several changes to the Morningstar® Wide Moat Focus Index construction rules. Among other changes, the index increased its constituent count from 20 stocks to at least 40 stocks and modified its rebalance and reconstitution methodology. These changes may result in more diversified exposure, lower turnover, and longer holding periods for index constituents than under the rules in effect prior to that date.

NYSE Arca Gold Miners Index is a service mark of ICE Data Indices, LLC or its affiliates (“ICE Data”) and has been licensed for use by VanEck UCITS ETF plc (the “Fund”) in connection with the ETF. Neither the Fund nor the ETF is sponsored, endorsed, sold or promoted by ICE Data. ICE Data makes no representations or warranties regarding the Fund or the ETF or the ability of the NYSE Arca Gold Miners Index to track general stock market performance. ICE DATA MAKES NO EXPRESS OR IMPLIED WARRANTIES, AND HEREBY EXPRESSLY DISCLAIMS ALL WARRANTIES OF MERCHANTABILITY OR FITNESS FOR A PARTICULAR PURPOSE WITH RESPECT TO THE NYSE ARCA GOLD MINERS INDEX OR ANY DATA INCLUDED THEREIN. IN NO EVENT SHALL ICE DATA HAVE ANY LIABILITY FOR ANY SPECIAL, PUNITIVE, INDIRECT, OR CONSEQUENTIAL DAMAGES (INCLUDING LOST PROFITS), EVEN IF NOTIFIED OF THE POSSIBILITY OF SUCH DAMAGES. ICE Data Indices, LLC and its affiliates (“ICE Data”) indices and related information, the name “ICE Data”, and related trademarks, are intellectual property licensed from ICE Data, and may not be copied, used, or distributed without ICE Data’s prior written approval. The Fund has not been passed on as to its legality or suitability, and is not regulated, issued, endorsed’ sold, guaranteed, or promoted by ICE Data.

The S&P 500 Index (“Index”) is a product of S&P Dow Jones Indices LLC and/or its affiliates and has been licensed for use by Van Eck Associates Corporation. Copyright © 2020 S&P Dow Jones Indices LLC, a division of S&P Global, Inc., and/or its affiliates. All rights reserved. Redistribution or reproduction in whole or in part are prohibited without written permission of S&P Dow Jones Indices LLC. For more information on any of S&P Dow Jones Indices LLC’s indices please visit www.spdji.com. S&P® is a registered trademark of S&P Global and Dow Jones® is a registered trademark of Dow Jones Trademark Holdings LLC. Neither S&P Dow Jones Indices LLC, Dow Jones Trademark Holdings LLC, their affiliates nor their third party licensors make any representation or warranty, express or implied, as to the ability of any index to accurately represent the asset class or market sector that it purports to represent and neither S&P Dow Jones Indices LLC, Dow Jones Trademark Holdings LLC, their affiliates nor their third party licensors shall have any liability for any errors, omissions, or interruptions of any index or the data included therein.

It is not possible to invest directly in an index.

Investing is subject to risk, including the possible loss of principal. Investors must buy and sell units of the UCITS on the secondary market via an intermediary (e.g. a broker) and cannot usually be sold directly back to the UCITS. Brokerage fees may incur. The buying price may exceed, or the selling price may be lower than the current net asset value. The indicative net asset value (iNAV) of the UCITS is available on Bloomberg. The Management Company may terminate the marketing of the UCITS in one or more jurisdictions. The summary of the investor rights is available in English at: complaints-procedure.pdf (vaneck.com). For any unfamiliar technical terms, please refer to ETF Glossary | VanEck.

No part of this material may be reproduced in any form, or referred to in any other publication, without express written permission of VanEck.

© VanEck (Europe) GmbH ©VanEck Switzerland AG © VanEck Securities UK Limited

Fortsätt läsa

Nyheter

BBVAE ETF är en spansk ETF som spårar Eurostoxx 50

Publicerad

den

BBVA Acción Eurostoxx 50 ETF FI Cotizado Armonizado (BBVAE ETF) med ISIN ES0105321030, strävar efter att spåra EURO STOXX® 50-index. EURO STOXX® 50-indexet följer de 50 största företagen i euroområdet.

BBVA Acción Eurostoxx 50 ETF FI Cotizado Armonizado (BBVAE ETF) med ISIN ES0105321030, strävar efter att spåra EURO STOXX® 50-index. EURO STOXX® 50-indexet följer de 50 största företagen i euroområdet.

Den börshandlade fondens TER (total cost ratio) uppgår till 0,20 % p.a. ETFen replikerar resultatet av det underliggande indexet genom full replikering (köper alla indexbeståndsdelar). Utdelningarna i ETFen delas ut till investerarna (halvårsvis).

BBVA Acción Eurostoxx 50 ETF FI Cotizado Armonizado har tillgångar på 133 miljoner euro under förvaltning. Denna ETF lanserades den 3 oktober 2006 och har sin hemvist i Spanien.

Beskrivning BBVA Acción Eurostoxx 50 ETF FI Cotizado Armonizado

Med BBVA Acción Eurostoxx 50 ETF FI Cotizado Armonizado deltar investerare i ökningen av värdet på aktierna i de 50 största konglomeraten i euroområdet (euroområdet). Euro Stoxx 50-indexet inkluderar aktier från 8 länder i euroområdet: Belgien, Finland, Frankrike, Tyskland, Irland, Italien, Nederländerna och Spanien.

Handla BBVAE ETF

BBVA Acción Eurostoxx 50 ETF FI Cotizado Armonizado (BBVAE ETF) är en börshandlad fond (ETF) som handlas på Bolsa de Madrid.

Bolsa de Madrid är en marknad som få svenska banker och nätmäklare erbjuder access till, men DEGIRO gör det.

Börsnoteringar

BörsValutaKortnamn
Bolsa de MadridEURBBVAE

Största innehav

VärdepapperVikt %
ASML Holding NVNL00102732158,59%
Lvmh Moet Hennessy Louis Vuitton SEFR00001210145,60%
SAP SEDE00071646005,16%
TotalEnergies SEFR00001202714,59%
Siemens AGDE00072361013,70%
Schneider Electric SEFR00001219723,46%
Future on Euro Stoxx 503,02%
Sanofi SAFR00001205782,99%
L’Oreal SAFR00001203212,98%
Allianz SEDE00084040052,93%

Innehav kan komma att förändras

Fortsätt läsa

Nyheter

The Art of Meme-ing: How Dogecoin Redefined Value

Publicerad

den

Explore Dogecoin's impact on crypto, turning internet memes into cultural and financial assets.

Explore Dogecoin’s impact on crypto, turning internet memes into cultural and financial assets.

𝕋𝕚𝕞𝕖 ℂ𝕠𝕕𝕖𝕤:

00:00 – Intro

00:27 – Where do Memes come from?

03:13 – What are some of the first Memes you remember?

10:28 – Do these things have value?

14:04 – The different types of cryptocurrencies

17:20 – How did Dogecoin start?

24:26 – What is some of the utility?

28:36 – How does it fit into the portfolio?

30:38 – Final thoughts

Research Newsletter

Each week the 21Shares Research team will publish our data-driven insights into the crypto asset world through this newsletter. Please direct any comments, questions, and words of feedback to research@21shares.com

Disclaimer

The information provided does not constitute a prospectus or other offering material and does not contain or constitute an offer to sell or a solicitation of any offer to buy securities in any jurisdiction. Some of the information published herein may contain forward-looking statements. Readers are cautioned that any such forward-looking statements are not guarantees of future performance and involve risks and uncertainties and that actual results may differ materially from those in the forward-looking statements as a result of various factors. The information contained herein may not be considered as economic, legal, tax or other advice and users are cautioned to base investment decisions or other decisions solely on the content hereof.

Fortsätt läsa

21Shares

Prenumerera på nyheter om ETFer

* indicates required

21Shares

Populära