
Nyheter
Pro-Crypto Presidency, New All-Time Highs, What’s Next?
• The crypto market jumped 17% following the presidential election, sparking renewed momentum.
• Bitcoin and Ethereum typically rally before Inauguration Day, with gains in 2020 exceeding 150% and 250%, respectively.
• Bitcoin crossed $82K, Sui surpassed $3, and Solana nears new highs driven by its DeFi-ecosystem, boosting market optimism.
• Ethereum, Cardano, and Toncoin are rallying but remain well below their all-time highs, hinting at significant upside potential. Cardano, in particular, surged nearly 100% following rumors that founder Charles Hoskinson may collaborate with U.S. regulators on crypto policy.
In just a week, the U.S. presidential election has sparked a crypto market rally, pushing total market capitalization up by 17% to $2.7T —a $400B surge. Leading the charge, Bitcoin rocketed almost 20% to an all-time high of more than $82K, while Ethereum broke out of its months-long slump, jumping by over 30%. Market optimism is running high as investors anticipate a smooth transition between the Biden and Trump administrations, with upcoming monetary policy shifts and a mounting geopolitical landscape adding to the momentum.
Figure 1 – Crypto Market Capitalization in 2024
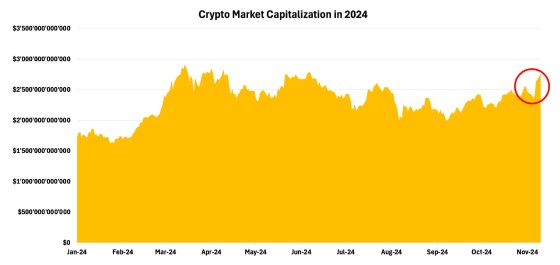
Source: Coingecko, 21Shares
Before diving into the factors shaping this market cycle, let’s take a closer look at how each crypto sector has performed in this historic week. Leading the charge are memecoins, growing by more than 50%, and capturing significant attention, driven largely by Solana’s high speeds. Decentralized Finance (DeFi) has also rallied on speculation around favorable regulatory changes, which we broke down in our last newsletter in more detail.
Figure 2 – Market Capitalization Growth Across Sectors, Bitcoin and Ethereum
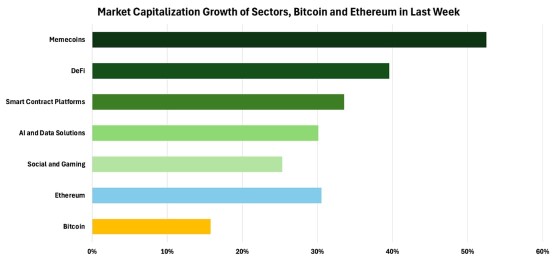
Source: Artemis, 21Shares
How Does The Market React Around Elections?
The pre-election period has historically put pressure on crypto markets, with Bitcoin and Ethereum often facing declines as uncertainty peaks, as shown in Figure 3. This year saw an even sharper downturn, with Bitcoin dropping nearly 7% in the days leading up to the election. This steeper decline likely reflects the unprecedented attention on the crypto industry, prompting many market participants to de-risk ahead of the event.
Figure 3 – Bitcoin and Ethereum Performance Leading up to Elections
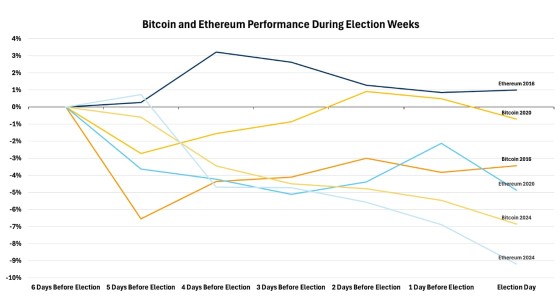
Source: Coingecko, 21Shares
However, as shown in Figure 4, cryptoassets tend to rally in the months following an election—regardless of the political outcome. With a pro-crypto president-elect and a Congress now dominated by crypto-friendly representatives, market sentiment seems primed for a potential rebound. Historically, Bitcoin has averaged a November return of 44%, with particularly strong performance in years that coincide with both a U.S. election and a Bitcoin halving.
Figure 4 – Bitcoin and Ethereum Performance Since Elections
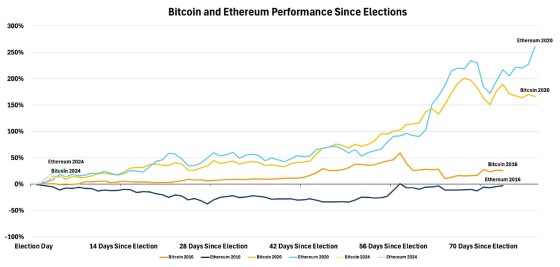
Source: Coingecko, 21Shares
Bitcoin and Ethereum have historically seen significant gains leading to Inauguration Day on January 20. For instance, in 2020, Ethereum surged by over 250%, and Bitcoin rose by more than 150% during this period. January following an election is often particularly favorable for Ethereum, likely as capital shifts from Bitcoin to other assets down the tail.
Figure 5 – Bitcoin and Ethereum Performance in January Post-Elections
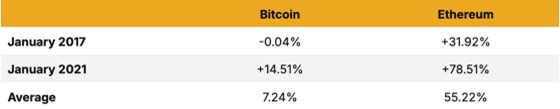
Source: Coinglass, 21Shares
Let’s examine how the market is shaping up this time and explore what to expect in the months ahead.
Market Dynamics Post U.S. Election: Current Leaders
Following the election, several key cryptoassets are nearing or setting new all-time highs, as illustrated in Figure 6. Bitcoin reached a fresh all-time high (ATH) of approximately $74K on election night, then surged past the $80K mark over the weekend, maintaining its upward momentum. Solana, while not yet at a new high, is only 20% away after rallying 34% post-election. Sui also hit a new ATH, rising 66% since Election Day when it traded nearly $2B. As Sui continues to capture market share, particularly by appealing to a new wave of users with consumer-facing applications, it warrants close monitoring as a potential satellite investment alongside Solana.
Figure 6 – Major Cryptoassets Nearing All-Time Highs
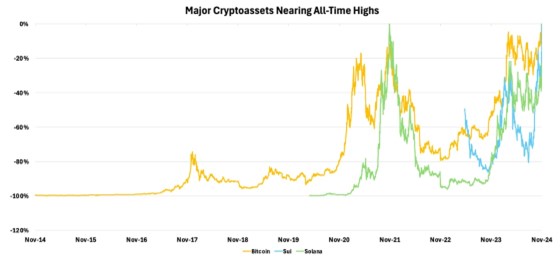
Source: Coingecko, 21Shares
Despite several assets already nearing or surpassing ATHs, key indicators suggest there’s still room for growth in this cycle, as post-election rallies often build momentum in the following months.
Institutional demand for Bitcoin surged post-election, driven by a pro-crypto administration’s victory. In the three days leading up to the election, net outflows totaled $755M as markets were risk-averse. However, once results were announced, inflows rebounded sharply, with nearly $1.5B in net flows on Thursday alone—the highest single-day inflow of the year and roughly equivalent to all miner rewards issued since the beginning of Q3!
Figure 7 – Bitcoin Price and Net BTC ETF Flows
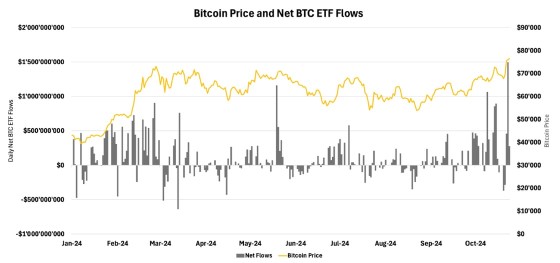
Source: Glassnode, 21Shares
That said, institutional adoption is still in its early stages, with broader interest on the horizon. The introduction of BTC ETF options enables hedge funds to deploy more sophisticated strategies, boosting market liquidity and accelerating the growth of Bitcoin’s derivatives market—currently only 5% of Bitcoin’s market cap, compared to 10-15x in traditional assets. Additionally, as wirehouses and RIAs complete their one-year due diligence early next year and begin actively allocating client portfolios, Bitcoin could follow a post-election trajectory similar to 2020, as shown in Figure 4.
We may see further capital flowing into Bitcoin because of the easing monetary conditions emerging worldwide. Last Thursday, the Fed cut rates by 25bps, following similar moves from the Bank of England, with the ECB likely to follow suit. This rate-cutting trend is driving an indirect expansion in M2 money supply globally, increasing liquidity in the financial system.
Figure 8 – Bitcoin Performance vs. M2 Supply Growth
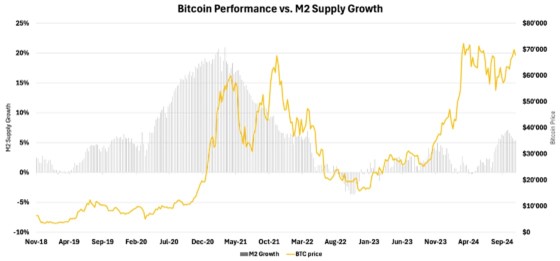
Source: BGeoMetrics, 21Shares
Bitcoin acts as a ”liquidity sponge,” attracting capital during periods of monetary expansion, as shown in Figure 8. When central banks increase M2 through rate cuts or quantitative easing, Bitcoin initially sees speculative inflows as a high-growth asset. As inflation concerns build, its role as an inflation hedge gains traction, creating a dual response to rising liquidity. With looser monetary conditions emerging, such as in 2020, Bitcoin could be primed to push past the six-figure mark.
Bitcoin has also shown a solid tendency to rebound in response to market uncertainties, as illustrated in Figure 9 below. While President Trump has demanded a de-escalation of the conflict in the Middle East by January 20, negotiations have stalled, with Qatar suspending its mediation role.
Figure 9 – Bitcoin Price Performance in Face of Macroeconomic Uncertainty
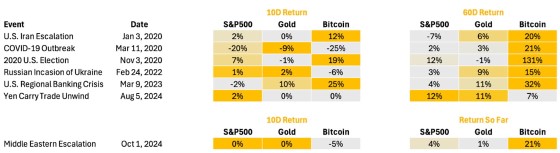
Source: Yahoo Finance, 21Shares
This resilience highlights Bitcoin’s appeal as a sovereign, censorship-resistant asset in times of crisis. With Donald Trump pledging to establish a strategic Bitcoin reserve and support U.S.-based mining, Bitcoin’s fundamentals appear well-positioned to sustain upward momentum in this post-election cycle despite ongoing tensions in the Middle East.
As a result of this year’s events, Bitcoin’s market dominance has surged to around 57%, as shown in Figure 10, its highest level since March 2021. However, a recent 3% dip over the weekend hints that other assets are beginning to lead the charge, signaling a shift toward broader market diversification as investors start allocating capital across the wider crypto landscape.
Figure 10 – Bitcoin Market Capitalization Dominance
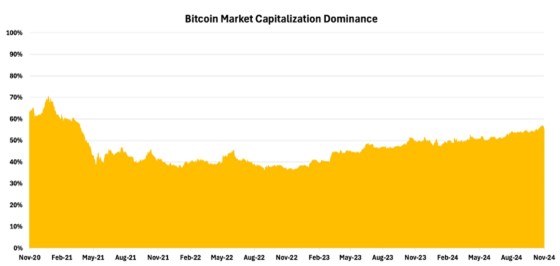
Source: Coingecko, 21Shares
As shown in Figure 11, Solana has been performing exceptionally well this year, with momentum expected to carry through the current cycle. It recently surpassed the $217 mark, setting a new year-to-date high. This surge has been driven by strong retail engagement and a vibrant DeFi sector, which initially catalyzed Solana’s growth earlier in the year. Now, with a resurgence in SPL-based tokens, Solana’s ecosystem appears poised to continue attracting capital and retail interest, supporting its upward trajectory.
Figure 11 – Solana Performance
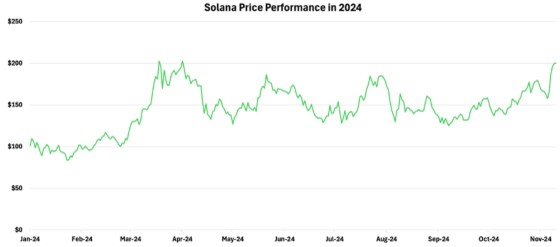
Source: Coingecko, 21Shares
Memecoins have proven to be an effective gateway for onboarding retail investors, with much of this activity centered on the Solana blockchain. Their recent surge has pushed Solana’s DeFi sector to new heights, as many of these tokens are actively traded on decentralized exchanges (DEX) like Raydium. In November, Solana’s DEXs collectively surpassed $34B in trading volume—nearly double Ethereum’s. Raydium alone has outperformed Uniswap in both transaction volume and fee generation, underscoring Solana’s growing dominance in DeFi and the strong appeal for SPL-based tokens among retail traders
Figure 12 – Solana Decentralized Exchange Volume
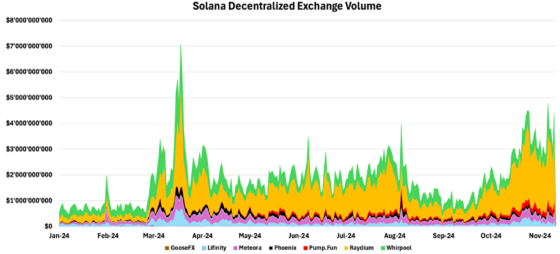
Source: Dune, 21Shares
The elections sparked a significant rally across DeFi tokens, particularly for Raydium, as shown in Figure 13 below. This momentum reflects the anticipation of more straightforward, favorable regulatory conditions. According to data from StandWithCrypto:
• In the House of Representatives, 268 pro-crypto candidates vs. 122 anti-crypto candidates
• In the Senate, 19 pro-crypto candidates vs. 12 anti-crypto candidates.
This shift toward a pro-crypto legislative body is expected to be a tailwind for DeFi, alleviating past regulatory pressures faced by projects like Uniswap, which had previously been targeted by the SEC. Additionally, President-elect Trump’s DeFi initiative, World Liberty Financial, built on Aave, signals potential political support that could reduce legal risks, creating a more supportive regulatory environment for innovation across the sector.
Figure 13 – DeFi Related Projects Performance During Q3
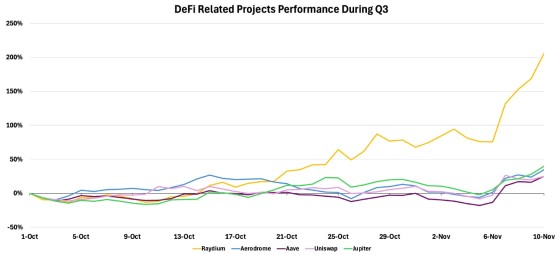
Source: Coingecko, 21Shares
Benefitting from more favorable conditions, several DeFi projects are on the verge of transformative changes. For example, Uniswap’s upcoming launch of its DeFi-focused chain, Unichain, is expected to strengthen UNI’s investment case by allowing token holders to capture revenue that has historically gone to Ethereum—totaling over $3.5B since inception.
While some key assets are soaring to new highs, others remain well below their peaks, presenting intriguing opportunities as capital rotates. We’ll examine these recently underperforming crypto assets and explore the factors that may drive their recovery in the months ahead.
Market Dynamics Post U.S. Election: Current Laggers
Several cryptoassets remain well below their all-time highs, with Ethereum, Cardano, and Toncoin down approximately 35%, 84%, and 36%, respectively, as shown in Figure 14. Yet, these assets have rallied impressively since the election—in fact, no major cryptoasset has declined since Election Day. Ethereum crossed the $3K mark for the first time since February, Cardano nearly doubled with a 100% surge, and Toncoin rebounded with a 22% gain. Recent market activity suggests that these market laggers—especially Ethereum and Cardano—have faced challenges this year.
While The Open Network (TON) is gaining, it is still recovering from Telegram founder Pavel Durov’s August arrest—and may gain stronger traction later in the cycle, as the market currently favors chains with established DeFi ecosystems. With its Web2 integration and user-friendly access via Telegram, TON is well-positioned to attract crypto entrants—an advantage that could become more valuable as retail interest reignites in the latter stages of the cycle.
Figure 14 – Major Cryptoassets Far Away From All-Time Highs
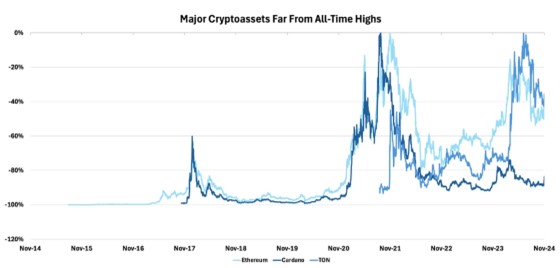
Source: Coingecko, 21Shares
Ethereum has struggled to keep pace with Bitcoin this year, particularly as Bitcoin has crossed the $70K mark five times, with Ethereum lagging each time. This underperformance reflects Ethereum’s challenging transition as it adapts to a new business model where much of its activity is offloaded to Layer 2 (L2) networks. These networks rely on Ethereum for security but handle transactions off-chain, reducing fees and congestion on Ethereum’s mainnet. However, this efficiency comes at a cost: L2s pay minimal fees to Ethereum, raising concerns about the mainnet’s long-term economic sustainability.
Nevertheless, Ethereum’s recent rally to $3.2K suggests it may have found new tailwinds. Following the election, the BTC-to-ETH ratio hit a new high for the year, indicating that Bitcoin had significantly outpaced Ethereum. As shown in Figure 15, this ratio has started to decline, signaling a potential shift in capital from Bitcoin toward Ethereum and other alternatives.
Figure 15 – Bitcoin to Ethereum Ratio
Source: Coingecko, 21Shares
We expect Ethereum’s growth to continue its momentum through next year despite recent challenges. Ethereum may implement revenue-sharing agreements with L2s, establishing minimum fees that L2s pay back to the mainnet—thereby strengthening the contributions to Ethereum’s core ecosystem. Additionally, more Layer 1s, like Celo, are shifting to operate as Ethereum L2s, which will increase demand for Ethereum’s block space.
Meanwhile, traditional financial and crypto-native firms are accelerating their L2 adoption, bringing new users and capital onto Ethereum. Coinbase’s L2, Base, has been highly successful, amassing nearly $3B in TVL and over 1M users, with Kraken recently following suit. Rumors of Sony launching its L2 are also circulating. These initiatives unlock consumer-facing applications, help address Ethereum’s disjointed ecosystem, and spark renewed interest from both crypto and traditional players.
Despite the recent launch of Ethereum ETFs, institutional inflows have significantly trailed behind Bitcoin’s. Net flows into Ethereum ETFs total just $137M, a stark contrast to Bitcoin’s $24B. This discrepancy is partly due to Ethereum’s more complex value proposition as a platform for decentralized applications, which may take longer for investors to embrace fully. Additionally, these ETFs have not activated staking, limiting their appeal to investors interested in yield-generating assets.
However, recent signs indicate growing institutional interest in Ethereum. Since Election Day, Ethereum has seen net inflows of $196M, bringing its cumulative ETF flows into positive territory since launch, as shown in Figure 16. With anticipated regulatory clarity, TradFi integrations on the horizon, and potential improvements to Ethereum’s mainnet revenue model, Ethereum could be poised for a revival.
Figure 16 – Ethereum ETF Net Flows
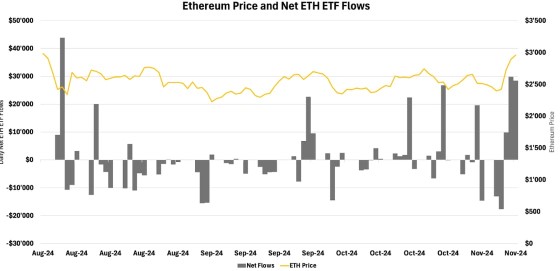
Source: Glassnode, 21Shares
Moving from Ethereum to another lagging asset, Cardano has seen renewed interest as it enters its Voltaire era, following the Chang Hard Fork (covered here). Announced in late October, Cardano is pivoting to become a Bitcoin L2, and this shift aims to leverage Cardano’s smart contract capabilities to enhance Bitcoin’s functionality. Under this setup, Cardano maintains its Layer 1 independence but works alongside Bitcoin, enabling both networks to capitalize on their convergence.
Additionally, Cardano has recently rallied on news that founder Charles Hoskinson plans to assist the new administration in developing crypto-friendly policies in the U.S. With Input Output, Cardano’s development company, setting up a policy office in Washington, Cardano’s position in U.S. regulatory discussions is set to strengthen. At 80% below its ATH, Cardano presents a strategic entry opportunity for investors.
Post-election, several leading cryptoassets are approaching new all-time highs, while others remain far from their peaks, presenting intriguing opportunities. Bitcoin reached over $80K over the weekend, while Solana and Sui surged significantly. However, Ethereum, Cardano, and Toncoin—still well below their all-time highs—have shown impressive rallies, signaling potential growth.
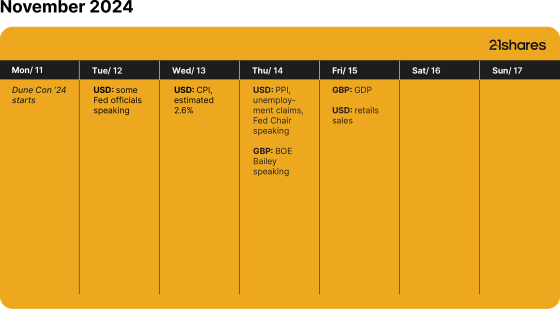
What’s happening this week?
Research Newsletter
Each week the 21Shares Research team will publish our data-driven insights into the crypto asset world through this newsletter. Please direct any comments, questions, and words of feedback to research@21shares.com
Disclaimer
The information provided does not constitute a prospectus or other offering material and does not contain or constitute an offer to sell or a solicitation of any offer to buy securities in any jurisdiction. Some of the information published herein may contain forward-looking statements. Readers are cautioned that any such forward-looking statements are not guarantees of future performance and involve risks and uncertainties and that actual results may differ materially from those in the forward-looking statements as a result of various factors. The information contained herein may not be considered as economic, legal, tax or other advice and users are cautioned to base investment decisions or other decisions solely on the content hereof.


35AI ETF köper företagsobligationer som förfall 2035

EYLD ETF investerar i företagsobligationer och delar ut kvartalsvis

ESAL ETF använder en systematisk flerfaktorsmetod för att investera globalt

RGSC ETF är en aktivt förvaltad globalfond

Så kan du investera i cybersäkerhet med hjälp av börshandlade fonder

Invesco on Iran war: Prudent response is to stay invested

Are you quantum ready?

Boreas satsning på innovativa, tematiska investeringar

21shares korsnoterar nio ETPer på Xetra

HANetf säger att drönare är den försvarssektor du inte kan ignorera
-
 Nyheter3 veckor sedan
Invesco on Iran war: Prudent response is to stay invested
-
 Nyheter3 veckor sedan
Are you quantum ready?
-
 Nyheter1 vecka sedan
Boreas satsning på innovativa, tematiska investeringar
-
 Nyheter3 veckor sedan
21shares korsnoterar nio ETPer på Xetra
-
 Nyheter3 veckor sedan
HANetf säger att drönare är den försvarssektor du inte kan ignorera
-

 Nyheter3 veckor sedan
Investera i Eurozonen med börshandlade fonder
-

 Nyheter6 dagar sedan
Månadsutdelande fonder fortsätter att locka investerarna mest
-

 Nyheter1 vecka sedan
Fastställd utdelning i MONTDIV april 2026