
Nyheter
Primer on Cryptoasset Valuations
Cryptoasset valuations remains an emerging topic seeking consensus, especially as the asset class expands and matures. Robert Greer, author of ”What is an asset class anyway?” argues that assets that lack an objective measure of value and have a supply constraint are more vulnerable to irrational exuberance, citing the dot-com bubble as an example. Cryptoassets lack an objective measure of value today among investors, similar to emerging tech companies in the late 1990s. We propose valuation methodologies that reconcile various investors’ approaches in recent years.
We can value any asset using two approaches – intrinsic or relative. Intrinsic valuation measures an asset’s value based on its capacity to generate cash flows. On the other hand, relative valuation methods, also called ”pricing,” estimate how much to pay for an asset based on what others are paying for comparable ones.
Investors might use a discounted cash flow method (DCF) to value a stock, but they wouldn’t use that for a piece of fine art. Similarly, we must outline the various types of cryptoassets to understand the differences we may expect in their value accrual and specific valuation approaches. In this regard, it’s helpful to categorize cryptoassets according to the three asset superclasses proposed by Robert Greer:
- Capital Assets: “An ongoing source of something of value” (e.g., bonds and stocks).
- Consumable/Transformable Assets: “You can consume it. You can transform it into another asset. It has economic value. But it does not yield an ongoing stream of value” (e.g., physical commodities).
- Store of Value Assets: “They cannot be consumed, nor can they generate income. Yet they do have value” (e.g., currencies and collectibles).
Like the Internet architecture, cryptoassets and blockchain technology have two layers: (1) infrastructure and (2) applications. In his 2019 work, Chris Burniske categorized cryptoassets at the infrastructure layer based on the consensus mechanism of the blockchain:
- Proof-of-Work (PoW): In PoW networks like Bitcoin, the native asset (BTC) relies on a computationally and energy-intensive lottery called mining to determine which block of transactions to settle on the blockchain and reward the miners. Hence, they belong to the Consumable/Transformable asset superclass, as they essentially create “a digital-native commodity in the form of secure, globally accessible ledger space.” Investors can use the mining cost of production as a fundamental metric to gauge the lower-bound price of PoW crypto assets like BTC.
- Proof-of-Stake (PoS): In networks like Ethereum, validators must commit a portion of their capital – the “stake,” in this case, ETH – to gain access to a recurring value stream generated by the network’s rules. Hence, they fall in the Capital Asset category, and their value may be derived from the net present value of annual flows to validators using a DCF method.
While we won’t delve too deeply into the application layer, we can apply the same first-principles thinking:
- Governance tokens yield voting rights and represent ownership of the application. They are analogous to common stock in traditional finance, so they fall in the Capital Asset class.
- Utility tokens drive the economics of the system as their sole function, meaning they fall in the Consumable Asset category.
- Non-fungible tokens (NFTs) are collectibles like fine art in their most typical form today, falling in the Store of Value category.
Figure 1: Asset superclasses and their subsets
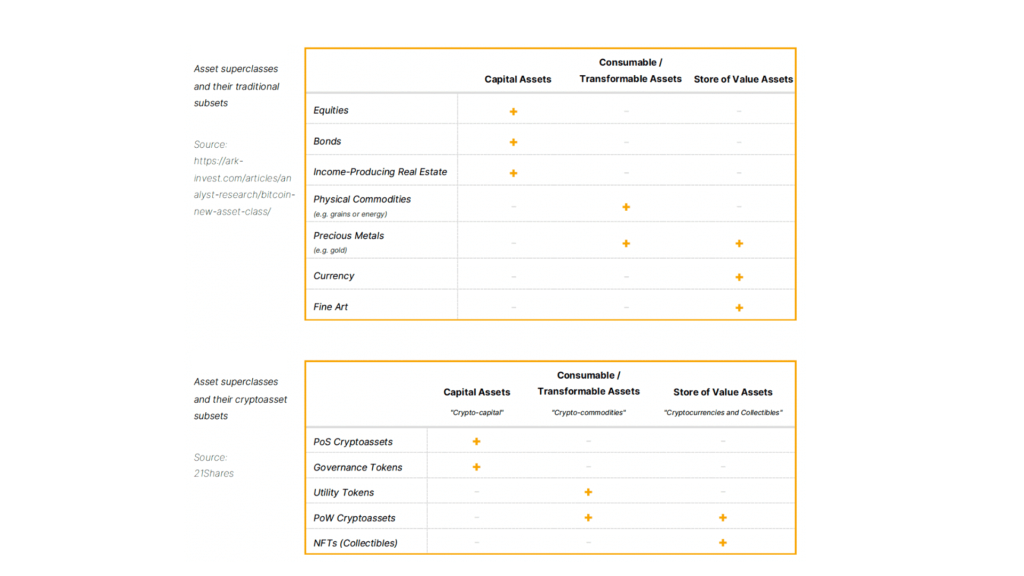
Source: 21Shares
Intrinsic Valuation
Ethereum
From the standpoint of a validator, PoS assets like ETH are akin to a stock paying a dividend yield, which means we can conduct a DCF valuation following four simple steps:
(1) Estimate the cash flows during the life of the cryptoasset
• a. Transaction fees within the network accrue to validators. Just so, fees are a proxy for revenue. Ethereum validators received $355.01 million in transaction fees (net after the burn mechanism) from September 30, 2022, to September 30, 2023.
• b. Token issuance doesn’t dilute the value of validators. On the contrary, they have the right to new issuance, similar to how shareholders may receive stock-based compensation. ETH Issuance from September 30, 2022, to September 30, 2023, amounted to $1.17 billion.
• c. Total Cash Flows: a + b = $1.52 billion in the first year.
(2) Estimate expected future cash flows and the lifespan of the cryptoasset
• a. Future cash flows: We propose a slight variation of the three-stage growth model to project Ethereum’s future cash flows. Specifically, we forecast an initial period of aggressive growth, followed by an incremental decrease that eventually stabilizes at a more moderate growth rate.
• b. Lifespan of the asset: With public companies that at least in theory can last forever, equity analysts generally assume that cash flows beyond a specific point in time continue in perpetuity. Investors may apply the same logic to PoS cryptoassets, but for simplicity’s sake, we assume ETH’s life will be 20 years.
(3) Estimate the discount rate to apply to these cash flows
• a. Lower-bound discount rate (9.90%): In the past 10 years, the Invesco QQQ Trust ETF obtained a 9.90% compound annual return.
• b. Higher-bound discount rate (21.90%): Obtained using the Fama and French Three-Factor Model (market premium, size premium, and value premium).
(4) Estimate the net present value (NPV) of cash flows using the above parameters
Assuming a discount rate of 9.09%, the implied price per one ETH today would be ~$4,293, a ~157% increase from ETH’s price ($1,668) as of September 30, 2023. On the other hand, if we use a 21.90% discount rate, the implied price per one ETH would be ~$1,090, a ~35% decrease from ETH’s price as of September 30, 2023. Investors should interpret the results of this DCF valuation with caution and run their own assumptions regarding projected cash flows and discount rates. The rationale behind our approach was to be conservative and capture the high volatility of ETH in the discount rate to accurately reflect the asset’s riskiness. Another implicit assumption of this approach is that the asset’s monetary premium (Store of Value) is embedded into the DCF.
Figure 2: ETH DCF Valuation
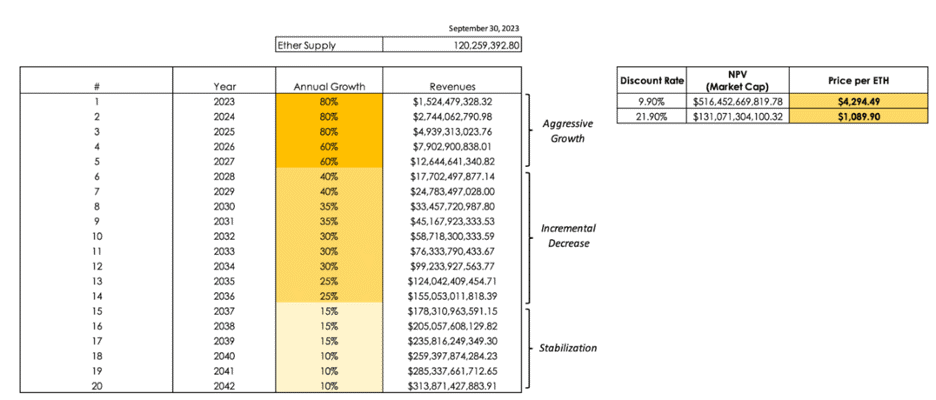
Source: 21Shares, as of September 30, 2023
Bitcoin
When it comes to crypto-commodities, the marginal cost of production is vital as it sets the price floor at which producers (miners) are willing to sell. From the outset, it is crucial to emphasize that we are not suggesting that the price of BTC should be determined by its marginal cost of production. To do so would be to adopt a labor theory of value, which is ostensibly false. Instead, the marginal cost of production is a tool that can help investors estimate a lower bound price level for BTC and other crypto-commodities.
In 2019, Charles Edwards proposed a methodology to estimate the global average US dollar cost of producing one BTC. The first component of the method is the Cambridge Bitcoin Electricity Consumption Index (CBECI), which provides an up-to-date estimate of the Bitcoin network’s daily electricity load. Edwards estimates the cost of production per BTC by:
- Calculating the number of BTC Mined Per Day (based on miner rewards)
- Calculating the daily electricity cost to mine one BTC (Daily Electrical Cost)
- Estimating the global average “Elec-to-Total Cost Ratio” = (Bitcoin Electrical Cost) / (Daily Cost of running a Bitcoin Mining Business)
An investor can then compute Bitcoin Production Cost as (Daily Electrical Cost) / (Elec-to-Total Cost Ratio). Finally, the Bitcoin Production Cost is compared to the “Bitcoin Miner Price,” which attempts to capture the revenue one BTC provides to miners. Bitcoin Miner Price is calculated as follows: BTC Price + (Daily Transaction Fees) / (Daily BTC mined). When the BTC price is below the total cost of mining one BTC, it signals that Bitcoin miners may be struggling and potentially taking short-term losses.
Figure 3: Bitcoin mining cost of production
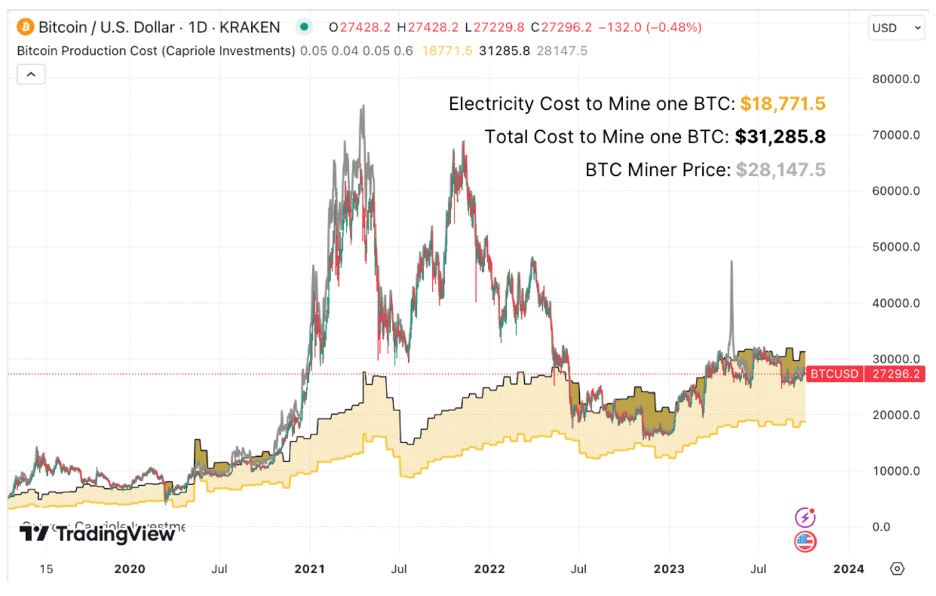
Source: 21Shares, data as of September 30, 2023
As of September 30, 2023, the estimated global average electricity cost to mine one BTC is $18,771.5, while the estimated global average total cost to mine one BTC is $31,285.8. To reiterate, investors shouldn’t interpret this range as the fundamental value of Bitcoin, which is subjective, but rather as an estimate of its price floor based on miner profitability and subsequent behavior patterns.
Relative Valuation
A significant portion of equity valuations in traditional finance consists of relative valuations based upon market sizing and multiples, such as price-to-earnings (P/E ratio). This approach is more likely to reflect market perceptions and sentiment than a fundamental valuation. Moreover, investors can use relative valuations to ”price” any asset, not just ones that generate cash flows.
Ethereum
In decentralized finance (DeFi), total value locked (TVL) is a crypto-native metric that investors can use as a proxy for assets under management (AUM). Hence, an ingenious pricing approach is to represent the market value of a smart contract platform like Ethereum as a multiple of TVL. We should clarify that TVL in our exercise includes Ethereum’s base chain and scaling platforms (Layer 2s).
Figure 4 shows that investors are pricing ETH at a premium relative to historical levels. A plausible explanation is that activity has dropped relative to the period of euphoria we experienced during 2020 and 2021. However, a flaw of this metric is that TVL does not necessarily translate to higher profits. Thus, this multiple is only appropriate to the extent that TVL can effectively influence the protocol’s ongoing and future profits.
Figure 4: Ethereum’s Market Cap-to-TVL-based implied price
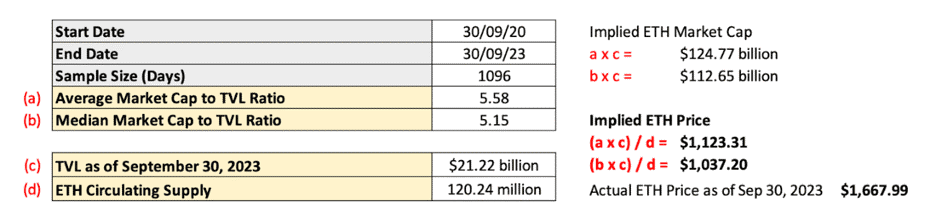
Source: 21Shares
Bitcoin
Investors cannot value store-of-value assets intrinsically because their value is primarily determined by the subjective beliefs of many individuals. Thus, we can utilize a simple market sizing approach to estimate a target price. The methodology involves establishing a Total Addressable Market (TAM) and a percent share the asset in question could take — Market Penetration. For instance, an investor could price Bitcoin by setting a proportion it could capture of the market value of gold, the seminal store-of-value asset.
As of September 30, 2023, the price of BTC is $26,970, with an implied circulating market cap of ~$526 billion. On the other hand, the market cap of gold sits at around $12.12 trillion. Thus, we can use the market sizing methodology described above to estimate the hypothetical price of BTC if it were to capture a given percent share of gold’s market cap. For instance, Figure 8 shows that if BTC were to capture 10%, it would be priced at $59,908. In the most optimistic scenario contemplated, if BTC penetrates 30% of gold’s market cap, the price of one BTC would be $179,724.
Figure 5: Hypothetical value of BTC as a % of gold’s market cap in 2027
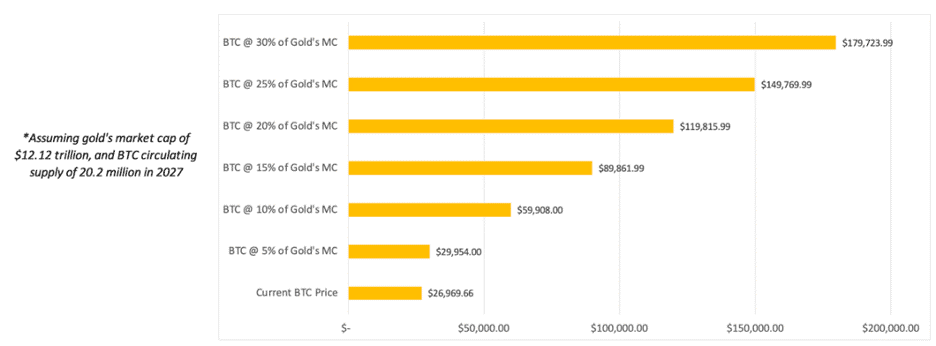
Source: 21Shares, Data as of September 30, 2023
Methodology improvements – Crypto’s S-Curve
One way to more accurately gauge a given cryptoasset’s level of penetration of its TAM is through the “S-curve.” The S-curve theory states that technologies grow and emerge in multiple waves. It was initially proposed by E.M Rogers in 1962 as the Diffusion of Innovation (DOI) Theory to explain how, over time, a new technology gains momentum and spreads through a specific population or social system.
Figure 6: S-curve and the Diffusion of Innovation Theory
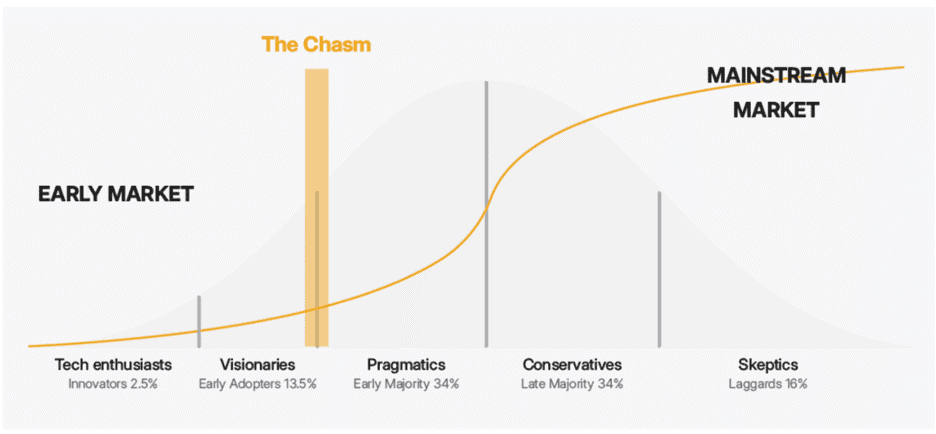
Source: 21Shares
There were 431 million crypto users globally at the beginning of 2023, representing about 5.36% of the world population.
The level of crypto adoption today is equivalent to internet adoption in 1999-2000.
Challenges to cryptoasset valuations
There are various challenges and shortcomings regarding cryptoasset valuations, such as insufficient historical data and complexities unique to the asset class.
For instance, the cash flows that PoS networks generate are not paid in fiat currency but rather in the native tokens of the network. This situation is as if Apple charged its customers in Apple shares instead of U.S. dollars. This unique feature creates a reflexivity problem because the dollar-denominated value of the revenue stream is directly dependent on the cryptoasset’s value.
We have provided investors with actionable methods to value cryptoassets. The complexity and uncertainty of valuing this asset class might intimidate investors. However, it is worth remembering that the more uncomfortable an investor feels when valuing an asset, the greater the payoff of doing the valuation.
Research Newsletter
Each week the 21Shares Research team will publish our data-driven insights into the crypto asset world through this newsletter. Please direct any comments, questions, and words of feedback to research@21shares.com
Disclaimer
The information provided does not constitute a prospectus or other offering material and does not contain or constitute an offer to sell or a solicitation of any offer to buy securities in any jurisdiction. Some of the information published herein may contain forward-looking statements. Readers are cautioned that any such forward-looking statements are not guarantees of future performance and involve risks and uncertainties and that actual results may differ materially from those in the forward-looking statements as a result of various factors. The information contained herein may not be considered as economic, legal, tax or other advice and users are cautioned to base investment decisions or other decisions solely on the content hereof.


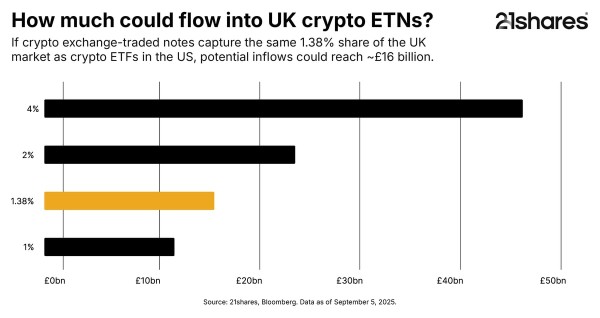
Retail investors in the UK are on the brink of accessing crypto through regulated exchange-traded notes (ETNs), starting with Bitcoin and Ethereum. With demand rising, infrastructure tested, and regulators shifting stance, this is further validation for the asset class.

Solana’s diverse revenue engine surpasses Ethereum’s early growth
Solana has rapidly grown into one of crypto’s top revenue generators, making $2.85 billion in the past year from trading, decentralized finance, NFTs, and emerging sectors like AI and decentralized physical infrastructure networks. Its diverse revenue streams and resilient demand show Solana evolving into a multi-sector onchain economy built for scale. In fact, its growth journey even surpasses that of the biggest smart contract blockchain, and the second-largest by market cap.


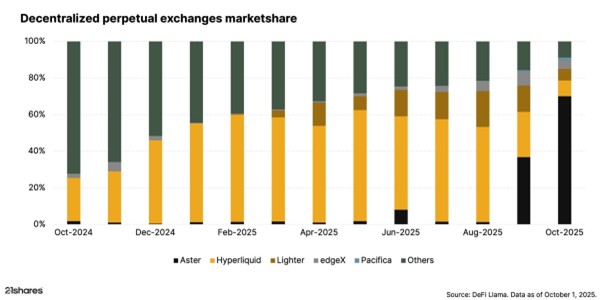
The perpetual DEX wars: Hyperliquid, Aster, and Lighter in focus
Perpetual DEXs have exploded, with daily volumes topping $100 billion in 2025. Once dominant Hyperliquid now faces fierce competition from Aster and Lighter, each pushing unique innovations in speed, leverage, and zk-proofs. The race highlights a maturing DeFi derivatives market where innovation, not monopoly, defines leadership.
Research Newsletter
Each week the 21Shares Research team will publish our data-driven insights into the crypto asset world through this newsletter. Please direct any comments, questions, and words of feedback to research@21shares.com
Disclaimer
The information provided does not constitute a prospectus or other offering material and does not contain or constitute an offer to sell or a solicitation of any offer to buy securities in any jurisdiction. Some of the information published herein may contain forward-looking statements. Readers are cautioned that any such forward-looking statements are not guarantees of future performance and involve risks and uncertainties and that actual results may differ materially from those in the forward-looking statements as a result of various factors. The information contained herein may not be considered as economic, legal, tax or other advice and users are cautioned to base investment decisions or other decisions solely on the content hereof.


Guldprisets uppgång till 4 000 dollar pekar på en värld i övergång

CEB9 ETF investerar i skogsbolag från hela världen
UK to drive more Bitcoin and Ethereum demand

VALOUR QNT SEK för den som vill handla kryptovalutan Quant

Ishares noterar två amerikanska buffer ETFer på Xetra

Indo-Pac Defence ETF: Vart nästa utgiftscykel är på väg

HANetf kommenterar om ryska drönare som tar sig in i polskt luftrum

IncomeShares Monthly Investor Update – August 2025

HANetf och Infrastructure Capital Advisors samarbetar för att lansera aktivt förvaltad preferensavkastnings-ETF i Europa

IN0A ETF spårar S&P 500 med fokus på företag med höga ESG-betyg
-
 Nyheter4 veckor sedan
Indo-Pac Defence ETF: Vart nästa utgiftscykel är på väg
-
 Nyheter4 veckor sedan
HANetf kommenterar om ryska drönare som tar sig in i polskt luftrum
-
 Nyheter4 veckor sedan
IncomeShares Monthly Investor Update – August 2025
-
 Nyheter3 veckor sedan
HANetf och Infrastructure Capital Advisors samarbetar för att lansera aktivt förvaltad preferensavkastnings-ETF i Europa
-
 Nyheter3 veckor sedan
IN0A ETF spårar S&P 500 med fokus på företag med höga ESG-betyg
-

 Nyheter3 veckor sedan
YSLV ETP ställer ut köpoptioner på silver för att skapa en löpande avkastning
-
 Nyheter3 veckor sedan
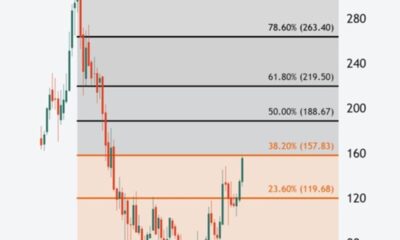
Vägen tillbaka till rekordnivåer är kantad av Fibonacci-motståndsnivåer
-

 Nyheter4 veckor sedan
Montrose sänker minimicourtaget för ETFer till en krona