
Nyheter
Ozempic can’t help your overweight in big tech: Global ETF diversification ideas for 2024

The start of a new year brings a chance for reflection and re-evaluation. For investors, a chance to rebalance. Franklin Templeton ETFs’ Dina Ting and Marcus Weyerer highlight the pitfalls of overweight exposure to mega tech stocks and where in the world to look for diversification in 2024.
Key takeaways
• The artificial intelligence (AI) race has sustained record high-concentration ratios for the S&P 500 Index, but also pose risks.
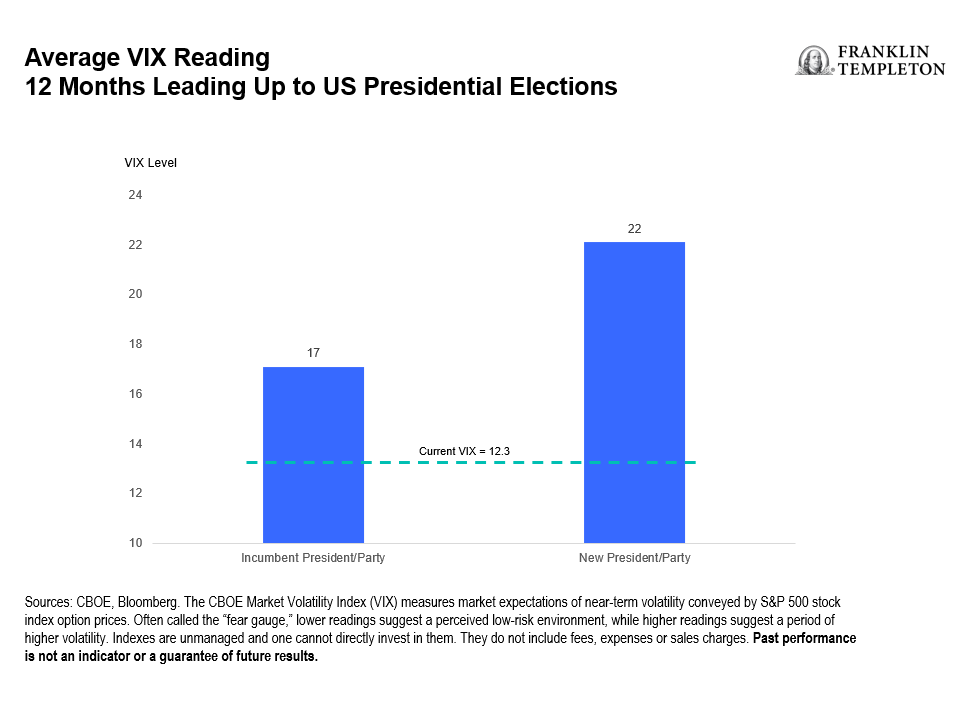
• The 2024 election avalanche may create short-term economic divergence globally and market volatility.
• Nearshoring benefits Mexico, less so Canada, while Brazil’s low sub-10x price-to-earnings valuation still presents opportunities, in our analysis.
• Asia offers diverse investment opportunities, with the semiconductor cycle looking up in South Korea and Taiwan.
If you’re sitting down to take in some investment projections for 2024, perhaps you’re already anticipating some trending keywords and have a (mental) bingo card of buzzwords in mind. Give yourself credit if you can check off #Magnificent7 given all the chatter over how top-heavy the S&P 500 Index has become and whether the “Magnificent Seven” (Alphabet, Amazon, Apple, Meta, Microsoft, Nvidia and Tesla) stocks are worthy of their rich valuations.
We do foresee the AI theme buoying such mega tech companies, regardless of how well their stocks may continue performing into the new year. But keep in mind that the top-10 stocks of the S&P 500 make up almost one-third of the index’s market capitalization, with the Magnificent Seven comprising well over a quarter of market cap and contributing almost all of its year-to-date appreciation.1 Be mindful of this “magnificent” overconcentration, which also means that the United States accounts for more than 60% of the MSCI All Country World Index (ACWI).2
On the other side of the globe is the world’s largest consumer of semiconductor chips—China. Even as its markets struggle with cyclical weakness, and the United States continues to lead the global AI innovation race, this revolutionary technology is quickly being deployed across China. Areas such as Beijing, Shenzhen and Shanghai have been ramping up aspirations to become the Middle Kingdom’s AI talent hub alongside other regional hotspots like India, which boasts accommodating policy and skilled but cheap labor. Strategic investors might therefore want to consider their US equity allocations for 2024 with a view toward reducing record-high concentration ratios and the need to factor in risks such as 2024’s busy calendar of economically consequential elections across major global powers.
Importantly next year, some four billion people—over half of the world’s population—will head for polling stations to cast ballots for general, regional or local elections scheduled in more than 70 countries.
Taiwan’s election in January is expected to be a flashpoint in the Sino-US relationship; in the spring, India’s Prime Minister Narendra Modi appears set for a third term with a high approval rating following a pivotal year that showcased the country’s global ascendancy; and undoubtedly the outcome of US elections late in 2024 have the potential to bring the most far-reaching consequences of all.
Data for US markets show that over the longer term, however, presidential election outcomes tend to have very little impact on market moves (typically, the widest range of possible market outcomes relative to other periods of the election cycle occur during the uncertain 12 months preceding election day).3 With current volatility in the low teens, we see the risk of politically induced spikes throughout the year. Historically, the 12 months leading up to elections post an average volatility of 17% in years when the same party continues its hold on the White House; in years when the presidency flips, that figure rises to over 20%. Given the fraught political backdrop, we may see a more nervous market than what is currently priced.
Whatever the election outcome, we expect it to reverberate across key global regions, especially in Asia. Considering the economic uncertainties pertaining to inflation and the US rates trajectory, we expect investors will continue to become ever-more selective about the emerging markets (EM) that they choose for 2024.
So if your new year planning involves revisiting the effect of US home bias on portfolio diversification, we suggest investors consider how beneficial low-cost country and regional exchange-traded funds (ETFs) can be as tools for implementing targeted global asset allocation. In our opinion, passive country ETFs and alternatively weighted solutions like multifactor exposures, tailored for precise implementation, can make sense for many investors in this environment.
For 2024, we believe investors should bear in mind the following considerations:
Love thy neighbor—Canada and Mexico (perhaps, just not equally)
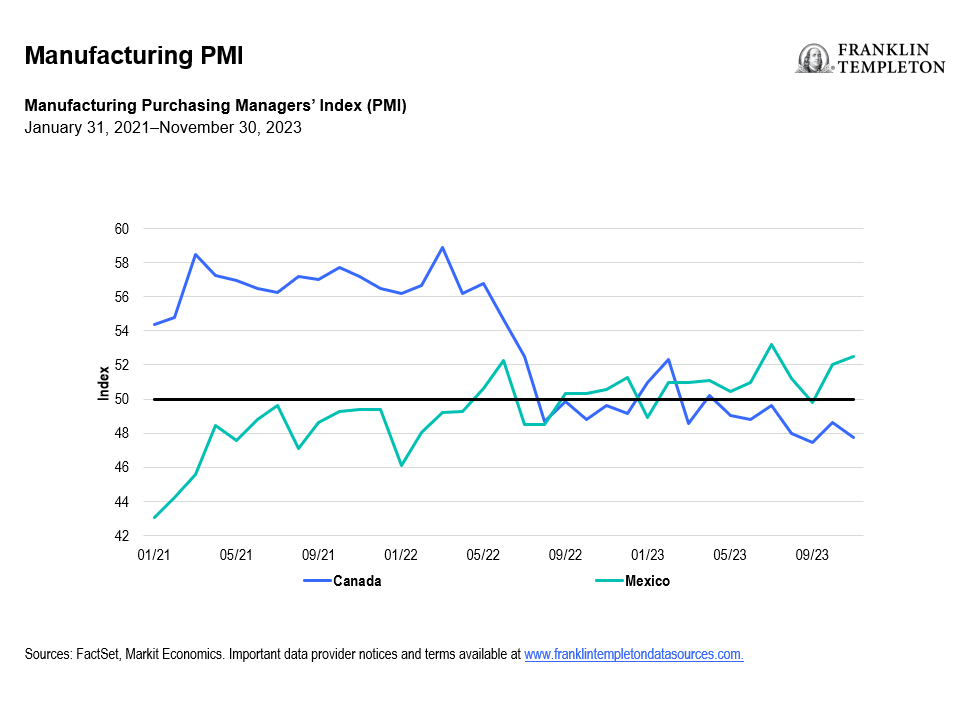
Since pandemic disruptions prompted urgency over fortifying and diversifying resilient supply chains closer to end consumers, nearshoring trends have served to benefit US neighbors—Canada and Mexico. While a slew of new trade agreements, such as increased partnerships relating to the supply of critical minerals and other essential goods, present multilateral benefits, nearshoring has especially been a boon to Mexico. Canada’s economic growth meanwhile has struggled this year, although the good news is that inflation there is cooling, according to central bank officials, who left the country’s policy interest rate unchanged at 5% in early December.
Healthy demand trends have helped Mexico’s Manufacturing Purchasing Managers Index (PMI) see a steady uptick in recent years. Total new orders increased, and Mexican manufacturers collectively recorded the strongest combined upturn in sales in just under five years.4 In contrast, Canada’s manufacturing sector downturn has continued to deepen due to cost pressures, falling new orders and softer sales.
Divergence (of performance returns, in this case) is probably another good word for 2024. Year-to-date, the FTSE Canada RIC Capped Index is up +9.4%, while the FTSE Mexico RIC Capped Index gained +31%, outperforming the S&P 500 (+24.5%).5 Weighted toward the consumer staples and financials sectors, the Mexican benchmark saw its biggest returns come from retail giants and conglomerates that are tapped into branded beverage bottling and distribution. One of Latin America’s largest drink industry firms has also been finding success in leveraging access to customers of its ubiquitous convenience store chain with new digital debit cards that may help financial services penetration—a central government priority.
A bill aimed at revamping national stock exchanges to boost trading, approved by Mexico’s congress recently, also bodes well for Latin America’s second-largest economy.
Opportunities in Asia
If your focus on Asia in 2023 concentrated mainly on Japan’s market, you’re not alone as the region’s diverse universe of economies may be underappreciated in portfolios. We’ve written this year about dynamic India—one of the fastest-growing major countries with solid short-term and long-term prospects. India, which has surpassed China as the world’s most populous nation, is likely to have a larger gross domestic product (GDP) than Japan in 2026, according to recent International Monetary Fund projections.6 While Japan is expected to be the world’s fifth-largest economy between 2026 and 2028, India’s nominal GDP (measured in USD terms) is projected to outrank both Germany and Japan by 2028. The world’s most populous nation celebrated several recent milestones in space exploration and fortified its assertiveness on the world stage, flaunting diplomatic clout as host of the G20 summit in September 2023.
Elsewhere in Asia, key exporting markets Taiwan and South Korea add first class technological capabilities, while Hong Kong and Singapore are two of the world’s preeminent financial centers and trading hubs. Indonesia is the fourth most populous nation, boasts the largest economy in Southeast Asia and accounts for roughly one-fifth of global nickel reserves. It is poised to play a key role in the electric vehicle supply chain. Many of these economies are well-placed to benefit from the proliferating “China Plus One” approach to manufacturing. Redistributing China weightings across some of these players may make sense not only from a diversification angle, but also from an economic point of view.
Semiconductor supremacy
South Korea and Taiwan certainly punch above their weight on the global stage, thanks to their dominance in the semiconductor industry. In our assessment, this sector has likely gone through—or is currently going through—the recent cycle’s trough. The average duration of these cycles since 2000 lasted around 18 to 24 months, and given the latest peak occurred in 2021, we are optimistic about 2024. Typically, South Korea and Taiwan have tended to perform well following an industry trough. The 12-month return for both markets after a cycle low has averaged around 30%, vs. 23% for broad EM. Bear in mind, of course, that the COVID-19-induced technology rally somewhat distorts these figures, and the sample size is small with just five cycles (from 2000–2021) observed. More importantly, however, both economies also appear set to benefit from more long-term structural drivers that increase chip demand. Besides #AI (another key phrase), there is the Internet of Things (the online interconnection of computing devices embedded in everyday physical objects) and the Metaverse (an interactive and immersive world powered by several digital technologies via virtual and mixed reality).
In December 2023, South Korean President Yoon Suk Yeol heralded a strengthening “semiconductor alliance” with the Netherlands during a four-day visit there. That same month, Dutch chip equipment giant ASML and South Korea’s Samsung Electronics agreed to make a new major joint investment to build a plant in South Korea for the production of high-tech semiconductor processing technology for cutting-edge chips.
In the short term, we believe valuations in these economies remain elevated, especially compared to China. Taiwan’s exports, especially technology and AI-related, have been robust, while non-technology exports showed weakness. Overall, however, growth predictions for both South Korea and Taiwan of between 2% to 3% for 2024 are an improvement over 2023.7
Elsewhere in EM
Brazil
Brazil also had a positive 2023, with its market, as measured by the FTSE Brazil RIC Capped Index, up about +36% for the one-year period to December 15, 2023, versus about 7.5% for broader EM, as measured by the FTSE Emerging Index.8 Strength in the agricultural and mining sectors for Latin America’s resource-rich, largest nation (by population) has also boosted GDP growth to above pre-COVID levels. While the headline GDP growth for 2024 is expected to be a step down from 2023’s numbers, we see exciting opportunities in Brazil—a large sub-10x price-to-earnings market.
Credited for proactively raising interest rates early on during the pandemic, Brazil’s independent central bank has done well in its battle with inflation. We recently offered commentary about Brazilian equities in relation to the price of oil, and we remain optimistic that investors may now find an attractive entry point to this bright spot among global equity markets.
Saudi Arabia’s transformation is being driven by the Kingdom’s Vision 2030 framework, which provides a comprehensive economic and social blueprint for its long-term reform goals. Among its competitive advantages are its investment strength and strategic geographic location connecting three continents. And of course, it remains home to the world’s largest oil producer. In recent decades, the share of Middle Eastern exports going to China and India has risen given Asia’s increased appetite for oil, up about five-fold, according to the International Monetary Fund. Meanwhile, that share to Europe and America has slipped to 16%.
OPEC+ countries have faced recent setbacks in nudging oil prices higher; however, ongoing Middle East conflicts, including the Israel-Hamas war and Yemen Houthi rebel attacks on Red Sea tankers, complicate the outlook for oil production.
Beyond energy, Saudi Arabia has also attempted to diversify its economy to broaden its exports and investment potential with major sporting events, tourism, infrastructure and entertainment. This included the introduction of tourist visas in late 2019 and may bode well for its market next year. Dominated by the financials, materials and energy sectors, the FTSE Saudi Arabia RIC Capped Index was up 11% for the one-year period to December 15, 2023.9 Albeit somewhat controversial, Saudi Arabia appears set to host the 2034 World Cup, which would make it only the second Arab Gulf country to ever host the tournament, after Qatar in 2022.
In summary, we believe investors should be mindful of portfolio overconcentration risks. Given so many upcoming major elections in 2024, the potential for short-term market volatility remains. Irrespective of related changes to politics and policy, significant economic trends can impact market swings, making selective diversification and targeted country selection even more important for the new year.
By Dina Ting, Head of Global Index Portfolio Management, and Marcus Weyerer, Senior ETF Investment Strategist, Franklin Templeton ETFs
Appendix
- Sources: Bloomberg, S&P. As of December 15, 2023. Indexes are unmanaged and one cannot directly invest in them. They do not include fees, expenses or sales charges. Past performance is not an indicator of future results. See www.franklintempletondatasources.com for additional data provider information.
- Sources: Bloomberg, S&P. As of December 15, 2023. The MSCI ACWI is a free float-adjusted, market capitalization-weighted index designed to measure the equity market performance of global developed and emerging markets. Indexes are unmanaged and one cannot directly invest in them. They do not include fees, expenses or sales charges. Past performance is not an indicator of future results. See www.franklintempletondatasources.com for additional data provider information.
- Sources: Haver Analytics, FactSet, Fidelity. As of November 14, 2023.
- Source: S&P Global. December 1, 2023.
- Source: Bloomberg. As of December 15, 2023. The FTSE Canada RIC Capped Index represents the performance of Canadian large- and mid-capitalization stocks. The FTSE Mexico RIC Capped Index represents the performance of Mexican large- and mid-capitalization stocks. Securities are weighted based on their free float- adjusted market capitalization and reviewed semi-annually. Indexes are unmanaged and one cannot directly invest in them. They do not include fees, expenses or sales charges. Past performance is not an indicator of future results. See www.franklintempletondatasources.com for additional data provider information.
- Source: IMF’s World Data Mapper. October 2023. There is no assurance that any projection, estimate or forecast will be realized.
- Source: Korea Development Institute, Economist Intelligence Unit 2023.
- Source: Bloomberg. As of December 15, 2023. The FTSE Brazil RIC Capped Index represents the performance of Brazilian large- and mid-capitalization stocks. Securities are weighted based on their free float- adjusted market capitalization and reviewed semi-annually. The FTSE Emerging Index measures the performance of the most liquid large- and mid-cap companies in the emerging markets. Indexes are unmanaged and one cannot directly invest in them. They do not include fees, expenses or sales charges. Past performance is not an indicator of future results. See www.franklintempletondatasources.com for additional data provider information.
- Source: Bloomberg. As of December 15, 2023. The FTSE Saudi Arabia RIC Capped Index represents the performance of Saudi Arabian large- and mid-capitalization stocks. Securities are weighted based on their free float- adjusted market capitalization and reviewed semi-annually. Indexes are unmanaged and one cannot directly invest in them. They do not include fees, expenses or sales charges. Past performance is not an indicator of future results. See www.franklintempletondatasources.com for additional data provider information.


ESAL ETF använder en systematisk flerfaktorsmetod för att investera globalt

RGSC ETF är en aktivt förvaltad globalfond

Så kan du investera i cybersäkerhet med hjälp av börshandlade fonder

I28X ETF investerar i eurodenominerade företagsobligationer som förfaller 2028
ESAR ETF följer MSCI USA-indexet i euro

Börshandlade fonder för kvantberäkning

Invesco on Iran war: Prudent response is to stay invested

Are you quantum ready?

Boreas satsning på innovativa, tematiska investeringar

21shares korsnoterar nio ETPer på Xetra
-
 Nyheter4 veckor sedan
Börshandlade fonder för kvantberäkning
-
 Nyheter3 veckor sedan
Invesco on Iran war: Prudent response is to stay invested
-
 Nyheter3 veckor sedan
Are you quantum ready?
-
 Nyheter1 vecka sedan
Boreas satsning på innovativa, tematiska investeringar
-
 Nyheter3 veckor sedan
21shares korsnoterar nio ETPer på Xetra
-

 Nyheter2 veckor sedan
HANetf säger att drönare är den försvarssektor du inte kan ignorera
-

 Nyheter5 dagar sedan
Månadsutdelande fonder fortsätter att locka investerarna mest
-

 Nyheter3 veckor sedan
Investera i Eurozonen med börshandlade fonder