
Nyheter
Nordnet ETF/ETC/ETN-statistik november 2014


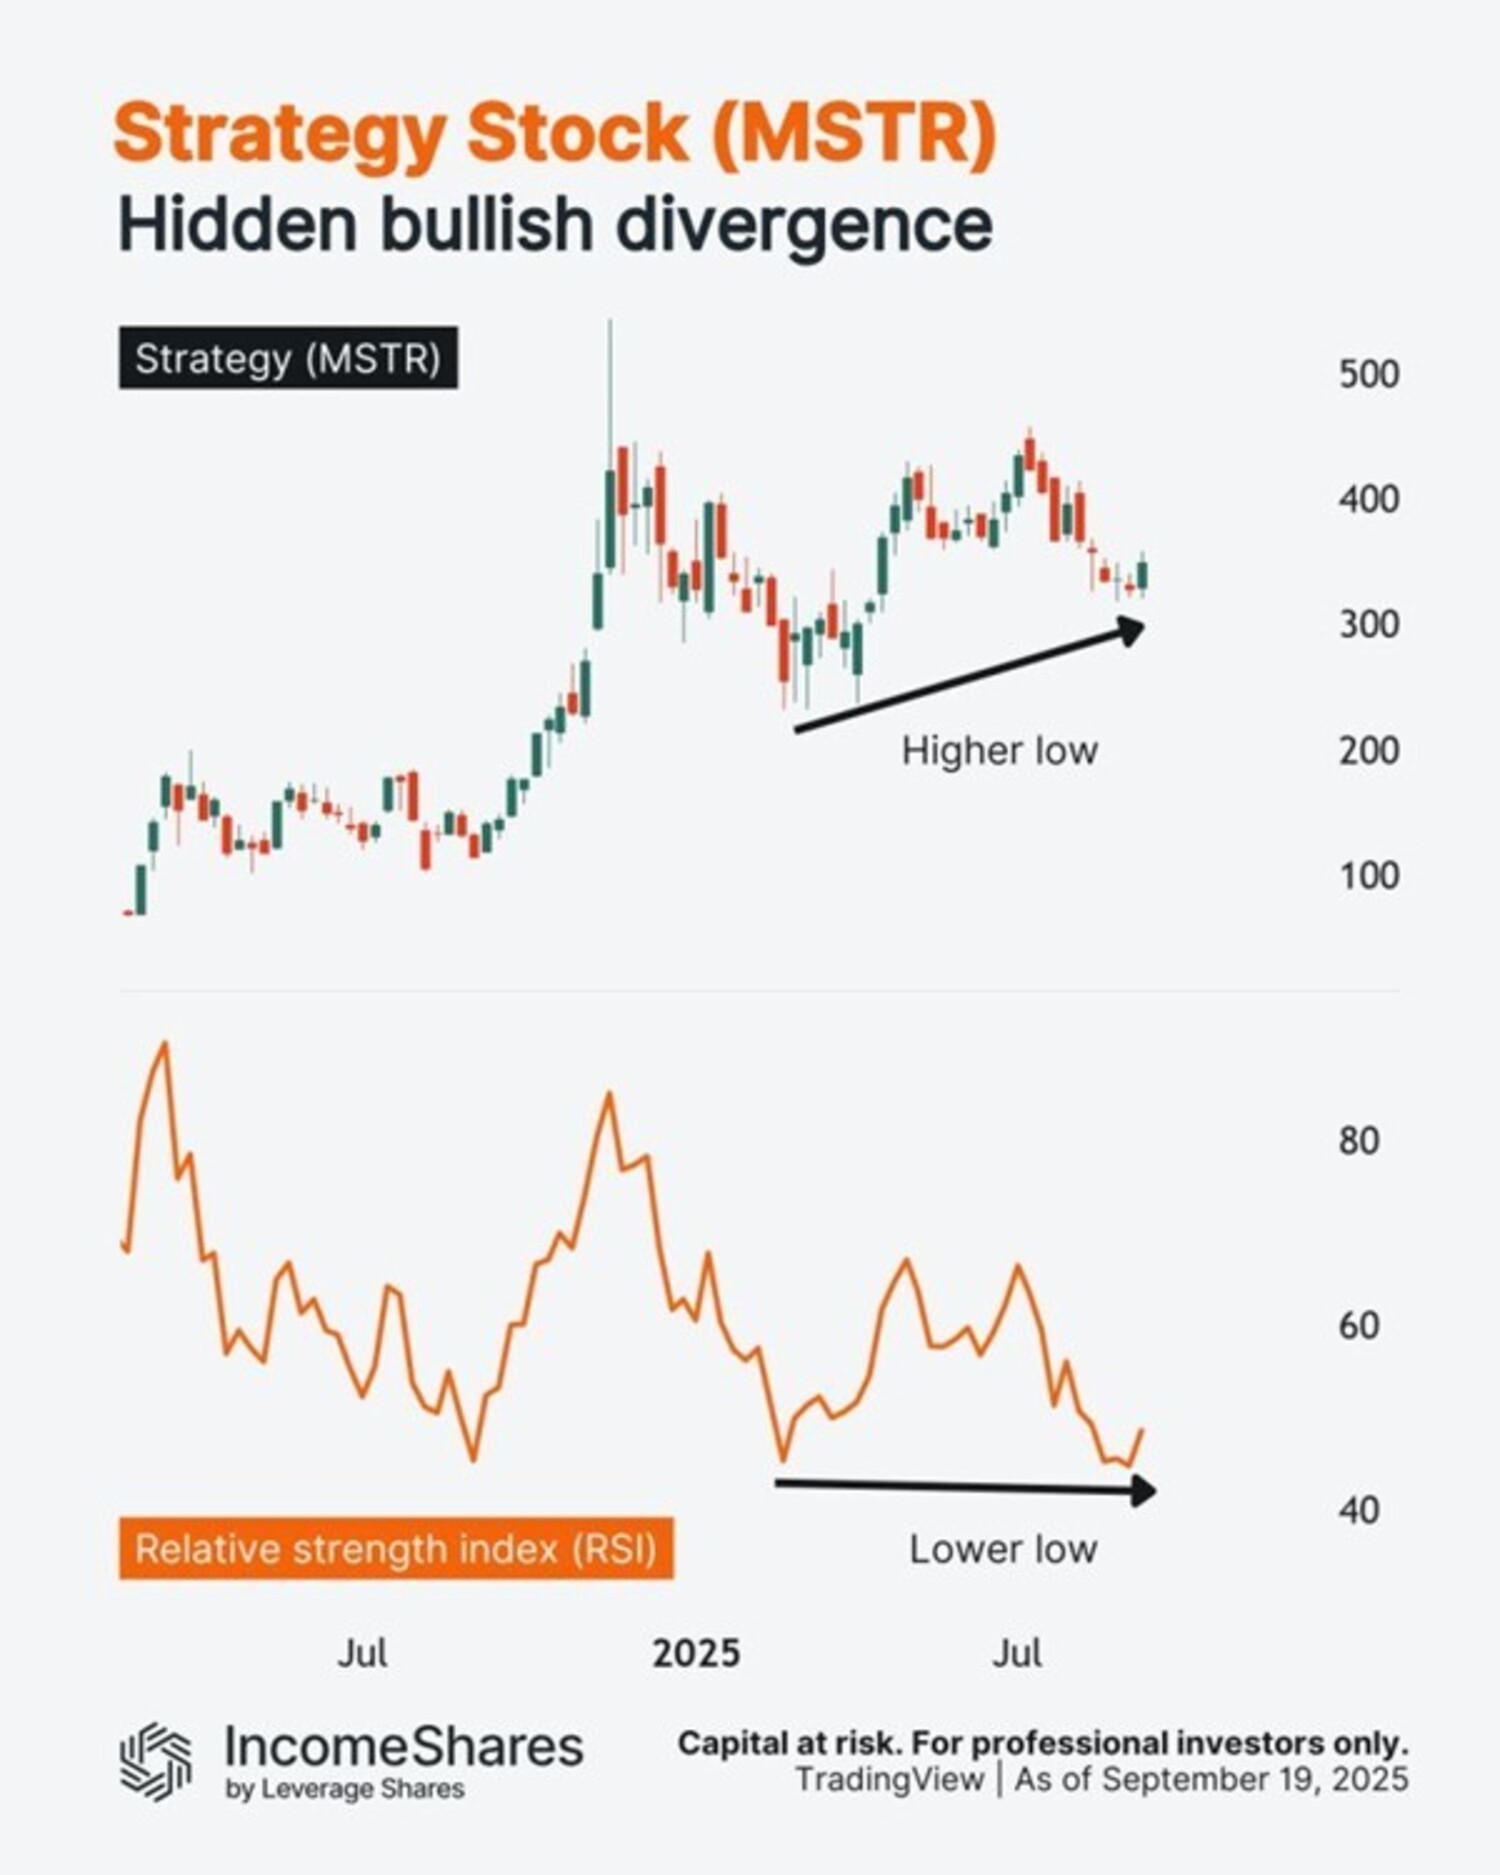
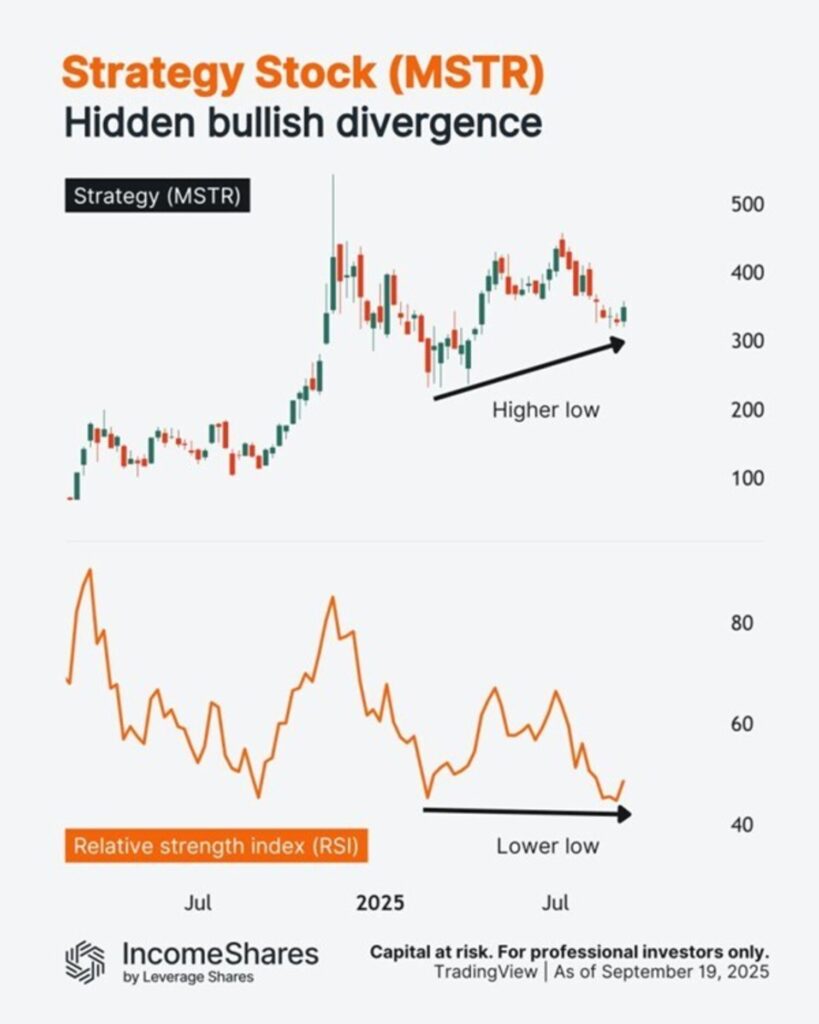
Strategy (MSTR) steg med cirka 5 % igår – och är nu upp cirka 10 % från sin ”botten” i september.
Hittills är det lägsta läget högre än det lägsta läget tidigare i år. Samtidigt kan RSI (relative strength index) potentiellt bilda ett lägre lägsta.
Den tekniska termen för detta är dold hausseartad divergens.
Så här fungerar det. RSI-linjen i diagrammet jämför de genomsnittliga vinsterna under ”uppåtgående veckor” med de genomsnittliga förlusterna under ”nedåtgående veckor” under de senaste 14 veckorna. Eftersom RSI nu är lägre betyder det att de genomsnittliga förlusterna har ökat i förhållande till de genomsnittliga vinsterna.
Med andra ord har säljtrycket ökat i ”relativ styrka” kontra köptryck (enligt indikatorn).
Men trots all denna säljstyrka har MSTR fortfarande stigit i pris totalt sett.
IncomeShares MicroStrategy Options ETP säljer säljoptioner på MSTR-aktier i syfte att generera månatlig inkomst. Den har också exponering mot aktiens prisrörelser.


ONCE ETP spårar den schweiziska dagslåneräntan och hedgas i euro

Strategy (MSTR) steg med cirka 5 %

7MAG ETP ger månatlig utdelning tack vare optioner

HANetfs VD kommenterar kärnkraftsavtalet mellan Storbritannien och USA

WMSE ETF en global momentumfond som handlas i euro och pund

Månadsutdelande ETFer uppdaterad med IncomeShares produkter

Utdelningar och försvarsfonder lockade i augusti

HANetfs analyserar hur ett fredsavtal kan påverka det europeiska försvaret

ADLT ETF investerar bara i riktigt långa amerikanska statsobligationer

Septembers utdelning i XACT Norden Högutdelande
-
 Nyheter4 veckor sedan
Månadsutdelande ETFer uppdaterad med IncomeShares produkter
-
 Nyheter3 veckor sedan
Utdelningar och försvarsfonder lockade i augusti
-
 Nyheter4 veckor sedan
HANetfs analyserar hur ett fredsavtal kan påverka det europeiska försvaret
-
 Nyheter4 veckor sedan
ADLT ETF investerar bara i riktigt långa amerikanska statsobligationer
-
 Nyheter2 veckor sedan
Septembers utdelning i XACT Norden Högutdelande
-

 Nyheter4 veckor sedan
Fastställd utdelning i MONTDIV augusti 2025
-

 Nyheter3 veckor sedan
HANetf kommenterar mötet mellan Kina, Ryssland och Nordkorea vid militärparad
-

 Nyheter4 veckor sedan
AICT ETF investerar i obligationer utgivna av företag från tillväxtmarknader