Nyheter
Navigating the Landscape of Global App Stores
Publicerad
8 månader sedanden

The crypto market has surged past $3T in total market capitalization, with smart-contract platforms leading the charge as risk appetite expands beyond Bitcoin. In particular, lean, cost-efficient blockchains have emerged as a key driver for onboarding users and boosting on-chain activity, as reflected in Figure 1.
• Solana soared 57% since the election, driven by memecoin-fueled retail interest and unprecedented DeFi activity, generating more revenue than Ethereum.
• Sui reached a new all-time high (ATH) near $4, also boosted by its gaming device pre-launch and consumer-friendly features.
• Aptos is gaining momentum for institutional-grade solutions like tokenization and payments, contributing to a recent price surge of 71%.
Figure 1 – Sector Price Performance Since Election Day

Source: Artemis, 21Shares
Given the proliferation of Layer 1s (L1s), it invites a closer examination of how the industry reached this point.
• Each L1 tackled the blockchain trilemma differently. While Bitcoin and Ethereum prioritized decentralization and security, later iterations focused on optimizing scalability.
• Ethereum’s first-mover advantage cemented the EVM as the standard for blockchain platforms, driving widespread adoption. However, its limitations spurred innovation, leading to the development of new virtual machines such as Solana’s SVM.
Despite these differences, each L1 plays a critical role in the on-chain ecosystem, tailored to unique use cases based on their architecture and features outlined in Figure 2 below.
Figure 2 – Technical Breakdown of Layer 1 Landscape

Source: Artemis, 21Shares
Below, we outline the unique strengths of each network, highlighting how they address various use cases in the order of their launch.
Ethereum – July 2015
The leading platform for decentralized applications (dApps) and a pioneer in smart-contract technology, as the first blockchain to introduce smart contracts.
• Ethereum laid the foundation for dApps and DeFi, commanding the highest liquidity with a Total Value Locked (TVL) of $60B.
• Its focus on decentralization and security, with more than 1M validators, makes it a trusted platform for tokenized government securities, totaling over $1.5B in assets.
• Ethereum hosts over 4,000 dApps, including prominent DeFi platforms like Uniswap and Aave, leveraging its unmatched network effects as the most widely adopted blockchain. While Layer 2 solutions enhance speed and efficiency, they have also introduced fragmentation, leading to reduced revenue.
Cardano – September 2017
The platform sets itself apart with a rigorous, research-driven approach to blockchain development.
• Introduced formal verification for smart contracts and enhanced Ethereum’s Proof-of-Stake (PoS) with Delegated Proof of Stake (DPoS), democratizing transaction validation.
• Collaborates with governments like Ethiopia to deploy Atala PRISM, enabling digital IDs that improve access to education and financial infrastructure in underserved regions. The network also promoted a transparent and efficient aid distribution system.
• Cardano’s growth has been hindered by slow development, a lack of EVM compatibility, and the absence of on-chain governance, resulting in a modest $456M TVL. Recent upgrades like the Chang Hard Fork foster a community-driven network, while the BitcoinOS integration will boost cross-chain utility by facilitating ADA-powered Bitcoin transactions.
Solana – March 2020
The network prioritized scalability powered by their innovative dual consensus model combining Proof of History (PoH) and PoS. With the ability to process nearly 3,000 transactions per second (TPS), Solana stands as one of the fastest blockchains available.
• This month, Solana’s DEX trading volume exceeded Ethereum’s by $40B, fueled by its efficient, low-cost blockchain and propelled by a dynamic DeFi ecosystem rich in retail-driven activity. This surge in trading volume has been a key driver behind the growth in Solana’s TVL, now reaching $8.3B.
• Solana powers decentralized physical infrastructure networks (DePIN) like Helium (broadband), Hivemapper (mapping), and Render (3D rendering), which demand high-speed, low-cost transactions at scale. Solana’s fast and efficient blockchain provides the necessary infrastructure for these applications to operate smoothly and cost-effectively.
• For Solana to deepen its integration with traditional finance—supported by PayPal’s PYUSD, which processes $30B, along with partnerships with Visa and Shopify—it must address ongoing network reliability issues, especially as its network experienced downtime once this year and multiple times over the past three years. The Firedancer validator client, capable of over 1M TPS on testnet, is positioned to reduce outages and enhance reliability, solidifying Solana’s role as a top solution.
Avalanche – September 2020
An EVM-compatible blockchain characterized by its subnet architecture, which enables customizable, permissioned networks connected to the Avalanche mainnet.
• Avalanche’s scalable subnet architecture enables customizable, permissioned networks with flexible gas fees, data privacy, and validator incentives. The Avalanche9000 upgrade enhances this with shared liquidity, lower validator costs, and full customizability, including geo-restrictions, making it ideal for tailored enterprise blockchain solutions.
• Avalanche’s Evergreen Subnets have attracted major TradFi players, including Franklin Templeton, which tokenized its $420M government money fund, as well as Citibank and Wellington Management exploring financial applications.
• Avalanche supports a wide range of industries, from Deloitte’s federal disaster reimbursement platform—designed to improve claim speed and transparency—to gaming projects like Shrapnel, which is built the GUNZ subnet. Its EVM compatibility and robust ecosystem pushed its TVL past $1B.
The Open Network (TON) – September 2021
A high-throughput blockchain designed for seamless user onboarding, TON aims to deliver a Web3 WeChat-like experience. Its strategic partnership with Telegram, which boasts 900M monthly active users, positions it as a key driver of mainstream blockchain adoption.
• TON’s Mini Apps act as a gateway to its on-chain ecosystem, leveraging projects like Hamster Kombat, which peaked at nearly 300M users, to drive retail adoption. However, its $300M TVL reflects a nascent financial ecosystem focused on simpler, retail-friendly use cases, leaving it comparatively underdeveloped in DeFi.
• Processing nearly 28M transactions this month, TON is strongly positioned to drive blockchain-based payments. Its recent USDT integration, surpassing $1B in supply within just seven months, further reinforces its potential in this space.
• Despite recent setbacks at Telegram, which operates independently from TON, the network’s growth this year underscores its strong potential. With scalable infrastructure and a vast addressable market, TON is well-positioned to onboard the next wave of users.
Aptos – October 2022
A high-performance blockchain leveraging the Move programming language, which was developed by Meta for their Diem project. Move prioritizes security and scalability, making it a strong contender for institutional use cases.
• Parallel processing enables sub-second settlement times and a theoretical throughput of 160K TPS, ensuring the performance needed for enterprise-grade applications.
• Aptos, led by ex-executives of Meta’s Diem project, is bringing institutions on-chain. Its credibility is bolstered by partnerships with TradFi giants like Microsoft, Franklin Templeton, and NBC Universal, alongside institutional-grade use cases such as Ondo’s tokenization platform. Alongside a growing DeFi ecosystem, which we’ll explore in detail later, these efforts have propelled its TVL to nearly $1B.
• Aptos streamlines Web3 access with keyless accounts, passwordless authentication, and transaction previews. Its support for emerging markets includes cost-efficient devices like the Jambo Phone, preloaded with blockchain tools. By combining advanced scalability with user-first design, Aptos is well-positioned for this cycle.
Sui – May 2023
Aptos’ twin is also a high-performance blockchain designed to deliver Web2-like simplicity to Web3. Also built on the Move programming language, it focuses on consumer-facing applications rather than institutional use cases.
• Sui caters to retail users with innovations like SuiPlay0X1, a gaming device bridging Web3 and traditional gaming. This focus has positioned Sui as a leader in consumer-facing dApps.
• Sui pairs sub-second finality and parallel processing with intuitive features like zkLogin for wallet creation via Google or Face ID, gasless interactions covered by apps, and QR-based payments with zkSend. By combining scalability with a user-friendly experience, Sui is primed to drive retail adoption and bridge the gap between Web2 and Web3, onboarding the next generation of crypto users.
• The recent launch of its Ethereum bridge and USDC support has significantly boosted Sui’s DeFi ecosystem, driving its TVL beyond $1.5B. This growth aligns with Sui’s recent ATH, just shy of $4.
We’ve just highlighted each blockchain’s unique features and selling points; now, let’s examine how these translate into real on-chain activity. We’ll assess key metrics like active addresses, decentralized exchange (DEX) trading volume, fees generated, and TVL to provide a clearer picture of each network’s performance.
Daily Active Addresses
Figure 3 – Daily Active Addresses on Smart-Contract Platforms in 2024

Source: Artemis, 21Shares
As shown in Figure 3 above, Solana emerged as a forerunner in user engagement, boasting the largest user base of 6.5M users driven by its trifecta of low fees, rapid transactions, and a user-friendly interface. A perfect storm for the memecoin frenzy that swept through the network this year, with more than 3.5M tokens launched on the memecoin factory pump.fun alone. Furthermore, Solana has become the preferred platform for the latest crypto trends, including tokens tied to AI-powered agents and DePIN protocols, as discussed earlier.
Similarly, Aptos has shown impressive user growth compared to other L1 blockchains like Avalanche, driven by its expanding DeFi ecosystem. Key developments fueling momentum include Blackrock’s BUIDL product expansion, the deployment of Tether’s USDT and Circle’s USDC on the network, and the upcoming integration of sBTC by Stacks. Together, these advancements are driving increased user enthusiasm and engagement across the network.
Ethereum, however, remains a formidable player, having effectively shifted a significant portion of its activity to L2 scaling solutions. This has resulted in almost 90% of transactions now occurring on L2s rather than the mainnet, underscoring the growing importance of scaling solutions as the execution layer for the legacy network. Despite this, L2s solutions have dramatically expanded Ethereum’s capabilities, achieving a 26-fold increase in throughput —382 transactions per second compared to 14 on the base layer—and attracting a user base of 2.6M, more than seven times Ethereum’s mainnet average of 350K users.
Decentralized Exchange Volume
Figure 4 – Decentralized Exchange Trading Volume on Smart-Contract Platforms in 2024

Source: Artemis, 21Shares
From a broader perspective, Ethereum and Solana dominate exchange activity, fueled by their thriving DeFi ecosystems. Ethereum has long maintained its top position, with the largest DeFi ecosystem boasting nearly $60B in TVL. Its financial applications have demonstrated remarkable resilience, withstanding multiple market challenges since 2020. In addition, Ethereum has been contributing almost 50% of all decentralized exchange (DEX) volume through the first three quarters of the year, until Solana flipped the script, as illustrated in Figure 4.
In fact, Solana has recently outpaced Ethereum across multiple metrics. For example, Solana’s DEX trading volume exceeded Ethereum’s by $40B in November, while its weekly DEX trading volume eclipsed Ethereum and all its Layer 2s combined during the final week of October. Additionally, three out of the top ten revenue-generating applications now operate on the Solana network. Notably, the Solana-based DEX Radyium generated $29B in trading volume over the last week, a 45% difference compared to Uniswap’s $20B. Furthermore, Solana-based platforms now account for three of the top ten DEXs, commanding over 40% of the total 24-hour trading volume across the entire crypto ecosystem.
Finally, while TON currently reports lower DEX volume and an underdeveloped DeFi ecosystem, its focus on simpler use cases has kept its TVL relatively modest. However, the upcoming Curve integration is expected to drive significant growth by enhancing stablecoin liquidity. Additionally, TON recently launched the testnet version of its bridging solution, enabling native Bitcoin transfers to its network. This breakthrough positions TON to tap into a vastly larger market, leveraging the $1.3T in dormant BTC.
Fees Generated
Figure 5 – Fees Generated by Smart-Contract Platforms in 2024

Source: Artemis, 21Shares
TON stands out among emerging platforms with its substantial network fees, driven by Telegram’s expansive Mini App ecosystem. This goes beyond crypto applications, integrating traditional services like ride-hailing and e-commerce, where TON-based assets are used for payments. Additionally, Telegram-centric offerings such as competitively priced global eSIMs, VPN solutions, and decentralized storage broaden its appeal, particularly to non-crypto-native users. All in all, this places TON as the third-highest fee-generating network compared to the other networks, which can be seen in Figure 8.
Alternatively, Solana has established itself as a fee-generating powerhouse, as depicted above in, Figure 5 with many leading dApps leveraging its high-speed, cost-effective blockchain. For example, the no-code memecoin creator platform Pump.fun has generated $220M in fees and attracted 150K users. Moreover, Solana-based protocols account for 50% of the top 15 fee-generating applications across all blockchains. Notably, trading bots Photon and BonkBot earn a combined $75M monthly, while Radium and staking provider Jito contribute $300M, collectively. This positioned Solana to currently generate 110% of Ethereum’s real economic value.
Finally, Ethereum’s recent Dencun upgrade led to a 90% reduction in L2 transaction costs. The upgrade introduced blobspace, an efficient data storage mechanism for L2 solutions. As this new system gains traction and approaches capacity, L2 transaction costs will gradually increase. This trend, already becoming apparent as shown below in Figure 6, suggests a potential resurgence in Ethereum’s mainnet revenue in the coming months.
Figure 6 – Ethereum Average Blob Count Per Block

Source: Dune Analytics, 21Shares
Total Value Locked
To recap, TVL serves as a crucial metric for financial ecosystems in the crypto space, analogous to assets under management in traditional finance.
Figure 7 – Total Value Locked in Smart-Contract Platforms in 2024

Source: Artemis, 21Shares
Ethereum, as the pioneer of DeFi, unsurprisingly maintains the largest TVL among all networks. However, the landscape is evolving rapidly.
Solana has emerged as a significant player, now commanding nearly 10% of DeFi’s TVL. This growth can be attributed to its seamless integration with traditional finance, expanding tokenization sector, and proliferation of payment-related use cases, as well as the surging maturity of its DeFi ecosystem.
Meanwhile, Avalanche continues to hold a substantial TVL, primarily due to its innovative subnet model that empowers businesses to create customizable networks with unprecedented control and flexibility. Consequently, Avalanche has become a hub for tokenization projects and institutional financial applications, both live and in development, as its network design effectively meets the business and privacy needs essential for TradFi.
In conclusion, these metrics provide a comprehensive view of the current standing and performance of various layer-1 blockchains. As seen in Figure 8, these platforms illustrate the diversity in blockchain usage patterns and provide insight into how each chain is positioned to compete in the landscape of blockchain-based applications. We believe there will not be “one chain to rule them all” and instead we will see a multi-chain future where certain chains are used over others for specific use cases.
Figure 8 – Summary of Key Metrics Across Smart-Contract Platforms

Source: Artemis, 21Shares
What’s happening this week?

Research Newsletter
Each week the 21Shares Research team will publish our data-driven insights into the crypto asset world through this newsletter. Please direct any comments, questions, and words of feedback to research@21shares.com
Disclaimer
The information provided does not constitute a prospectus or other offering material and does not contain or constitute an offer to sell or a solicitation of any offer to buy securities in any jurisdiction. Some of the information published herein may contain forward-looking statements. Readers are cautioned that any such forward-looking statements are not guarantees of future performance and involve risks and uncertainties and that actual results may differ materially from those in the forward-looking statements as a result of various factors. The information contained herein may not be considered as economic, legal, tax or other advice and users are cautioned to base investment decisions or other decisions solely on the content hereof.
Du kanske gillar
-

Thinking of buying your first Bitcoin? Read these 5 tips first
-


Primer: Injective, infrastructure for global finance
-

Bitcoin is resilient despite the Middle East war
-


Svenska investerare — 21Shares Nasdaq Stockholm-sortiment har just blivit starkare
-


UK looking to lift the retail ban on crypto ETPs
-

21Shares noterarar fem nya krypto-ETPer Nasdaq Stockholm
Nyheter
BlackRocks Bitcoin ETF genererar nu mer intäkter än deras S&P 500 ETF
Publicerad
1 timme sedanden
6 juli, 2025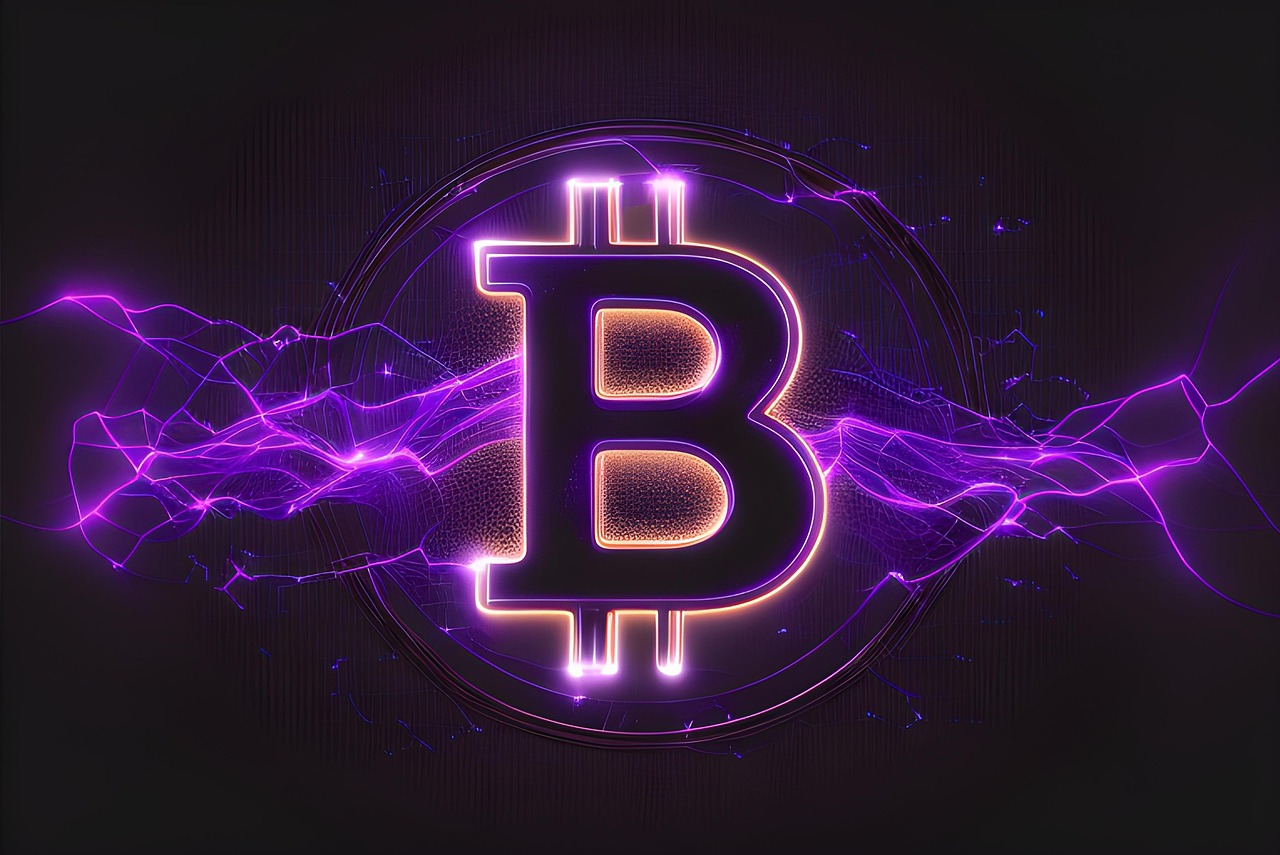
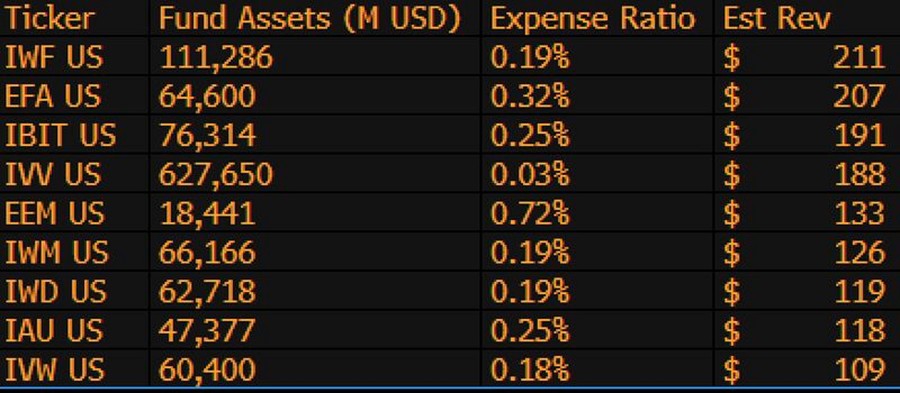
BlackRocks spot Bitcoin ETF (IBIT) genererar nu ~187,2 miljoner dollar i årliga avgifter, enligt Bloomberg. Det är mer än de ~187,1 miljoner dollar i årliga avgifter som deras Core S&P 500 ETF (IVV) drar in, trots att IVV är nästan 9 gånger större, med 624 miljarder dollar i tillgångar jämfört med IBITs 75 miljarder dollar.
Med en kostnadskvot på 0,25 % har IBIT mycket snabbt blivit en seriös inkomstkälla för världens största kapitalförvaltare.
IBIT är nu den tredje mest intäktsgenererande ETFen för BlackRock som har mer än 1 000 ETFer, och är bara 9 miljarder dollar ifrån (och ett praktiskt taget hinder) att vara nummer 1. Bara ännu en galen statistik för en 1,5 år gammal ETF. Här är topp 10-listan för Blackrock/iShares.
Nyheter
Hur investerar jag i amerikanska småbolag med en ETF?
Publicerad
2 timmar sedanden
6 juli, 2025
Det är välkänt att företag med mindre börsvärden genererar högre avkastning på lång sikt. Men de kommer också med högre risker som investerare bör hantera effektivt. Diversifiering av investeringar med ETFer är det säkraste alternativet för en oberoende investerare att närma sig amerikanska småbolag.
Det finns i huvudsak tre index tillgängliga för att investera med ETF:er i småbolag i USA. Denna investeringsguide för småbolagsaktier i USA hjälper dig att navigera mellan särdragen hos Russell 2000®, MSCI USA Small Cap, S&P SmallCap 600 och ETF:erna som spårar dem. Det gör att du kan hitta de mest lämpliga ETFerna för amerikanska småbolag för dig genom att rangordna dem enligt dina preferenser.
Vi har identifierat olika index för amerikanska småbolag som spåras av 15 olika börshandlade fonder. Den årliga förvaltningskostnaden för dessa ETFer ligger mellan 0,14 och 0,49 procent.
De största US Small Cap ETF efter fondstorlek i EUR
| 1 | SPDR Russell 2000 US Small Cap UCITS ETF | 2,580 m |
| 2 | iShares S&P SmallCap 600 UCITS ETF | 1,531 m |
| 3 | iShares MSCI USA Small Cap ESG Enhanced UCITS ETF (Acc) | 1,451 m |
De billigaste US Small Cap ETF efter totalkostnadskvot
| 1 | Invesco S&P SmallCap 600 UCITS ETF A | 0.14% |
| 2 | JPMorgan BetaBuilders US Small Cap Equity UCITS ETF USD (acc) | 0.14% |
| 3 | JPMorgan BetaBuilders US Small Cap Equity UCITS ETF USD (dist) | 0.14% |
Olika index för amerikanska småbolag
Metoder för de viktigaste indexen
| MSCI USA Small Cap | Russell 2000® | S&P SmallCap 600 | |
| Antal ETFer | 0 | 5 | 2 |
| Antal aktier | 2,000 | 600 | |
| Investeringsuniversum | MSCI USA Investable Market Index: ca. 2 400 amerikanska företag | Russell 3000®-index: 3 000 amerikanska företag | S&P 1500® Composite index: ca. 1 500 amerikanska företag |
| Indexombalansering | Kvartalsvis | Årsvis | Kvartalsvis |
| Urvalskriterier | De minsta företagen (cirka 14 procent av det fria börsvärdet justerat) i MSCI USA Investable Market Index | Ca. 2 000 av de minsta företagen från Russell 3000®-index (rankad efter totalt marknadsvärde) | De 600 minsta företagen från S&P 1500® Composite-index |
| Index weighting | Market cap (free float) | Market cap (free float) | Market cap (free float) |
Russell 2000®-index
Russell 2000®-indexet spårar ca. 2 000 av de minsta företagen (mätt som totalt börsvärde) från det underliggande Russell 3000®-indexet, som består av de största 3 000 amerikanska företagen. Russell 2000®-indexet representerar ca. 10 procent av det totala börsvärdet för Russell 3000®-index. Aktierna som passerar urvalsskärmen viktas av deras marknadsvärde på fritt flytande nivå.
Metodik för Russell 2000®
Ca. 2000 småbolagsaktier från USA
- Indexomräkning sker årligen. Undantag: tillägg på grund av nya börsintroduktioner, som sker kvartalsvis
- Underliggande index har krav för inkludering såsom lägsta börsvärde, stängningskurs, fritt flytande, plats för handel med majoriteten av ett företags aktier
- Aktieurval baseras på totalt börsvärde
- Urvalskriterier: ca. 2 000 minsta aktier från Russell 3000®-indexet ingår
- Index viktat med fritt flytande marknadsvärde
S&P SmallCap 600-index
S&P SmallCap 600-indexet inkluderar 600 amerikanska småbolagsaktier från det underliggande S&P 1500® Composite-indexet. Företag måste ha ett ojusterat börsvärde på 600 miljoner till 2,4 miljarder USD för att ingå i indexet. Aktierna som passerar urvalsskärmen viktas av deras marknadsvärde på free float nivå.
Metodik för S&P SmallCap 600
- 600 småbolagsaktier från USA
- Indexombalansering sker kvartalsvis
- Indexet har minimikriterier för likviditet, free float och finansiell bärkraft (positiv vinst under det senaste året och kvartalet)
- Urvalskriterier: 600 minsta företag från det underliggande S&P 1500® Composite-indexet med ett ojusterat börsvärde på 600 miljoner till 2,4 miljarder USD
- Index viktat med fritt flytande marknadsvärde
En jämförelse av ETFer för amerikanska småbolag
Förutom avkastning finns det ytterligare viktiga faktorer att tänka på när du väljer en ETF för amerikanska småbolag. För att ge ett bra beslutsunderlag hittar du en lista över alla ETFer för amerikanska småbolag med information om kortnamn, kostnad, utdelningspolicy, fondens hemvist och replikeringsmetod.
För ytterligare information om respektive börshandlad fond, klicka på kortnamnet i tabellen nedan.
| Namn ISIN | Kortnamn | Avgift % | Utdelnings- policy | Hemvist | Replikerings- metod |
| SPDR Russell 2000 US Small Cap UCITS ETF IE00BJ38QD84 | ZPRR | 0.30% | Ackumulerande | Irland | Optimerad sampling |
| iShares S&P SmallCap 600 UCITS ETF IE00B2QWCY14 | IUS3 | 0.30% | Utdelande | Irland | Optimerad sampling |
| iShares MSCI USA Small Cap ESG Enhanced UCITS ETF (Acc) IE00B3VWM098 | SXRG | 0.43% | Ackumulerande | Irland | Optimerad sampling |
| Xtrackers Russell 2000 UCITS ETF 1C IE00BJZ2DD79 | XRS2 | 0.30% | Ackumulerande | Irland | Fysisk replikering |
| SPDR MSCI USA Small Cap Value Weighted UCITS ETF IE00BSPLC413 | ZPRV | 0.30% | Ackumulerande | Irland | Optimerad sampling |
| CSIF (IE) MSCI USA Small Cap ESG Leaders Blue UCITS ETF B USD IE00BMDX0L03 | CSY8 | 0.20% | Ackumulerande | Irland | Fysisk replikering |
| Amundi Russell 2000 UCITS ETF EUR (C) LU1681038672 | RS2K | 0.35% | Ackumulerande | Luxemburg | Ofinansierad swap |
| JPMorgan BetaBuilders US Small Cap Equity UCITS ETF USD (dist) IE0001O84583 | BBSD | 0.14% | Utdelande | Irland | Fysisk replikering |
| Amundi S&P SmallCap 600 ESG UCITS ETF Dist IE000XLJ2JQ9 | MWON | 0.35% | Utdelande | Irland | Fysisk replikering |
| Invesco Russell 2000 UCITS ETF Acc IE00B60SX402 | SC0K | 0.25% | Ackumulerande | Irland | Ofinansierad swap |
| L&G Russell 2000 US Small Cap Quality UCITS ETF IE00B3CNHJ55 | ETLZ | 0.30% | Ackumulerande | Irland | Optimerad sampling |
| Invesco S&P SmallCap 600 UCITS ETF A IE00BH3YZ803 | SMLK | 0.14% | Ackumulerande | Irland | Ofinansierad swap |
| Amundi Russell 2000 UCITS ETF USD LU1681038839 | RS2U | 0.35% | Ackumulerande | Luxemburg | Ofinansierad swap |
| JPMorgan BetaBuilders US Small Cap Equity UCITS ETF USD (acc) IE000JNKVS10 | JPSC | 0.14% | Ackumulerande | Irland | Fysisk replikering |
| VanEck Morningstar US SMID Moat UCITS ETF A IE000SBU19F7 | SMTV | 0.49% | Ackumulerande | Irland | Fysisk replikering |
Nyheter
EMEE ETF är en aktivt förvaltad ETF med fokus på emerging markets
Publicerad
3 timmar sedanden
6 juli, 2025
iShares Emerging Markets Equity Enhanced Active UCITS ETF USD (Acc) (EMEE ETF) med ISIN IE000OVF8Q66, är en aktivt förvaltad börshandlad fond.
Den börshandlade fonden investerar minst 70 procent i aktier från tillväxtmarknader över hela världen. Upp till 30 procent av tillgångarna kan placeras i private equity-instrument, värdepapper med fast ränta med investment grade-rating och penningmarknadsinstrument. Värdepapper väljs utifrån hållbarhetskriterier och en kvantitativ investeringsmodell.
Den börshandlade fondens TER (total cost ratio) uppgår till 0,30 % p.a. iShares Emerging Markets Equity Enhanced Active UCITS ETF USD (Acc) är den enda ETF som följer iShares Emerging Markets Equity Enhanced Active-index. ETFen replikerar det underliggande indexets prestanda genom fullständig replikering (köper alla indexbeståndsdelar). Utdelningarna i ETFen ackumuleras och återinvesteras.
Denna ETF lanserades den 31 juli 2024 och har sin hemvist i Irland.
Varför EMEE?
Fonden förvaltas aktivt och använder kvantitativa modeller som ägs av investeringsförvaltaren för att uppnå en systematisk, regelbaserad strategi för aktieurval på tillväxtmarknader.
Modellerna väljer aktier från ett brett universum av aktier och rangordnar dem brett enligt tre kategorier: företagsfundament, marknadssentiment och makroekonomiska teman.
Fonden har kategoriserats som en artikel 8-fond enligt SFDR.
Investeringsmål
Fonden förvaltas aktivt och strävar efter att uppnå långsiktig kapitaltillväxt på din investering, med hänvisning till MSCI Emerging Markets Index (”Riktmärket”) för avkastning.
Handla EMEE ETF
iShares Emerging Markets Equity Enhanced Active UCITS ETF USD (Acc) (EMEE ETF) är en europeisk börshandlad fond. Denna fond handlas på flera olika börser, till exempel Deutsche Boerse Xetra och London Stock Exchange.
Det betyder att det går att handla andelar i denna ETF genom de flesta svenska banker och Internetmäklare, till exempel DEGIRO, Nordnet, Aktieinvest och Avanza.
Börsnoteringar
| Börs | Valuta | Kortnamn |
| Euronext Amsterdam | USD | EMEE |
| XETRA | EUR | EMEE |
| London Stock Exchange | GBP | EMEE |
Största innehav
| Kortnamn | Namn | Sektor | Vikt (%) | ISIN | Market Currency |
| USD | USD CASH | Cash and/or Derivatives | 11.99 | – | USD |
| 2330 | TAIWAN SEMICONDUCTOR MANUFACTURING | Informationsteknologi | 9.13 | TW0002330008 | TWD |
| ISTUSAD | BLK ICS US TREAS AGENCY DIS | Cash and/or Derivatives | 4.84 | IE00B3YQRB45 | USD |
| 700 | TENCENT HOLDINGS LTD | Kommunikationstjänster | 4.78 | KYG875721634 | HKD |
| 005930 | SAMSUNG ELECTRONICS LTD | Informationsteknologi | 4.08 | KR7005930003 | KRW |
| IKSA | ISHARES MSCI SAUDI ARABIA CAPPED | Finans | 3.79 | IE00BYYR0489 | USD |
| 9988 | ALIBABA GROUP HOLDING LTD | Sällanköpsvaror | 2.15 | KYG017191142 | HKD |
| MSIFT | CASH COLLATERAL USD MSIFT | Cash and/or Derivatives | 1.59 | – | USD |
| 939 | CHINA CONSTRUCTION BANK CORP H | Finans | 1.50 | CNE1000002H1 | HKD |
| 3690 | MEITUAN | Sällanköpsvaror | 1.26 | KYG596691041 | HKD |
Innehav kan komma att förändras

BlackRocks Bitcoin ETF genererar nu mer intäkter än deras S&P 500 ETF

Hur investerar jag i amerikanska småbolag med en ETF?

EMEE ETF är en aktivt förvaltad ETF med fokus på emerging markets

HANetf utökar sitt utbud av försvars-ETFer med fokus på Indo-Stillahavsområdet’

OP7U ETF investerar i stora amerikanska företag

De bästa ETFer som investerar i europeiska utdelningsaktier

YieldMax® lanserar sin andra produkt för europeiska investerare

Big News for Nuclear Energy—What It Means for Investors

3EDS ETN ger tre gånger den negativa avkastningen på flyg- och försvarsindustrin

Svenska investerare — 21Shares Nasdaq Stockholm-sortiment har just blivit starkare
Populära
-

 Nyheter2 veckor sedan
De bästa ETFer som investerar i europeiska utdelningsaktier
-

 Nyheter3 veckor sedan
YieldMax® lanserar sin andra produkt för europeiska investerare
-
 Nyheter3 veckor sedan
Big News for Nuclear Energy—What It Means for Investors
-

 Nyheter3 veckor sedan
3EDS ETN ger tre gånger den negativa avkastningen på flyg- och försvarsindustrin
-

 Nyheter2 veckor sedan
Svenska investerare — 21Shares Nasdaq Stockholm-sortiment har just blivit starkare
-

 Nyheter2 veckor sedan
Nordea Asset Management lanserar nya ETFer på Xetra
-

 Nyheter4 veckor sedan
HANetfs VD Hector McNeil kommenterar FCAs kryptonyheter
-
 Nyheter1 vecka sedan
12 000 artiklar om börshandlade fonder


