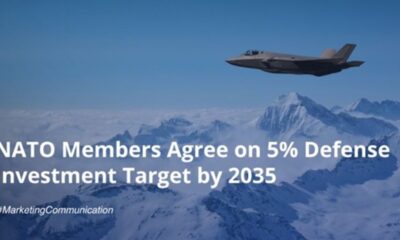
- HANetf ändrar indexet för Future of European Defence UCITS ETF (ticker: 8RMY) för att klassificera den som SFDR Artikel 8, vilket ger exponering mot försvar. [1]
- ETFen fokuserar på europeiska NATO-medlemmars försvars- och cyberförsvarsutgifter och kommer att exkludera kontroversiella vapen – vilket breddar investerarbasen i hela Europa.
- Ändringen har gjorts för att möta europeiska investerares efterfrågan.
- HANetf erbjuder det bredaste utbudet av försvars-ETFer i Europa, som spänner över globala, europeiska och Indo-Stillahavsområdets exponeringar; deras globala försvars-ETF (ASWC) lanserades i juli 2023 och har sedan dess ackumulerat 3,13 miljarder dollar i förvaltat kapital. [2]
När du investerar i ETFer är ditt kapital i riskzonen. Digitala tillgångar kan vara mycket volatila.
HANetf, Europas första och ledande white-label UCITS ETF och ETC-plattform, [3] är glada att kunna meddela sin avsikt att ändra det underliggande indexet för Future of European Defence UCITS ETF (ticker: 8RMY) för att positionera fonden för Artikel 8-klassificering enligt Sustainable Finance Disclosure Regulation (SFDR). Detta skulle göra ARMY till den enda försvars-ETFen i Europa med denna status.
ETFen kommer att flytta från VettaFi Future of Defence Ex US Index till VettaFi European Future of Defence Screened Index. Ändringen syftar till att anpassa 8RMY till investerares önskan att få tillgång till det europeiska försvarstemat på ett ansvarsfullt sätt, utan att späda ut fondens kärnexponering. Det nya indexet begränsar behörigheten till företag med huvudkontor i europeiska NATO-länder och fokuserar portföljen på Europas försvarsindustriella bas.
Det nya indexet introducerar strikta undantag som täcker kontroversiella vapen och lägger till ytterligare ansvarskriterier, samtidigt som den välkända intäktsscreeningen och aktietaken bibehålls för att ge renodlad, diversifierad exponering mot det europeiska försvarstemat.
Dessa förbättringar är också avsedda att göra 8RMY mer tillgängligt för investerare i delar av Europa där ägandet av produkter med exponering mot kontroversiella vapen har begränsats. ARMY strävar efter att erbjuda en tydligare väg för investerare som söker försvarsexponering i linje med lokala policyer och preferenser.
Europa genomför en flerårig modernisering av sin försvarskapacitet, fyller på lager, skalar upp utrustningsupphandling och återuppbygger kapaciteten. 8RMY strävar efter att återspegla detta strukturella investeringstema samtidigt som vi höjer ribban för hur exponering levereras. Vi tror att 8RMY kommer att vara ett mycket effektivt verktyg för att hjälpa investerare att stödja den strategiskt viktiga europeiska försvarssektorn och göra det möjligt för det bredaste utbudet av investerare att göra det. Sedan vi lanserade 8RMY och NATO har vi fått feedback från en grupp investerare som behövde fler screeningar för att kunna investera.
HANetf har en gedigen meritlista inom försvarstema, efter att ha lanserat Future of Defence UCITS ETF (ticker: ASWC) i juli 2023, nu på 3,13 miljarder AUM. [4] Den fondens ramverk för NATO/NATO-allierade behörighet utformades för att hjälpa investerare att anpassa försvarsexponering till sina värderingar, med erkännande av att NATO enligt lag är en defensiv allians. Den planerade 8RMY-övergången bygger på denna erfarenhet.
Hector McNeil, medgrundare och VD för HANetf, kommenterade: ”Vi är mycket glada över att ta detta steg för att anpassa vår 8RMY ETF till SFDR artikel 8. Detta representerar ytterligare en viktig milstolpe i utvecklingen av försvarsinvesteringar i Europa. Investerare inser i allt högre grad att säkerhet och hållbarhet inte är motstridiga krafter – de är sammanlänkade. En välutrustad och ansvarsfullt styrd försvarssektor är avgörande för att upprätthålla fred, stabilitet och rättsstatsprincipen.
”Genom att anta ett mer fokuserat, granskat index strävar vi efter att ge investerare förtroende för att deras kapital stöder Europas legitima försvarskapacitet samtidigt som de följer robusta ansvarsstandarder. Viktigt är att dessa förbättringar också gör ETFen mer tillgänglig för investerare i regioner där exponering mot vissa försvarsrelaterade aktiviteter tidigare har begränsats, vilket breddar möjligheten att delta i Europas försvarsmodernisering.
”HANetf fortsätter att leda innovationen inom detta område och erbjuder produkter som inte bara fångar kraftfulla långsiktiga investeringsteman utan också återspeglar de europeiska investerarnas värderingar och regulatoriska förväntningar. Vi vill erbjuda europeiska investerare ett utmärkt och kurerat verktyg för att strategiskt stödja den europeiska försvarssektorn. Vi anser också att det är viktigt att vi som en renodlad europeisk leverantör erbjuder en ETF som inte kan påverkas av geopolitik utanför Europa.”
Handla ASWJ ETF
Future of Defence Indo-Pacific ex-China UCITS ETF (ticker: ASWJ) är en europeisk börshandlad fond. Denna fond handlas på flera olika börser, till exempel Deutsche Boerse Xetra och Euronext Paris. Av den anledningen förekommer olika kortnamn på samma börshandlade fond.
Det betyder att det går att handla andelar i denna ETF genom de flesta svenska banker och Internetmäklare, till exempel Nordnet, SAVR, DEGIRO och Avanza.
Handla 8RMY ETF
Future of European Defence UCITS ETF (ticker: 8RMY) är en europeisk börshandlad fond. Denna fond handlas på flera olika börser, till exempel Deutsche Boerse Xetra och Euronext Paris. Av den anledningen förekommer olika kortnamn på samma börshandlade fond.
Det betyder att det går att handla andelar i denna ETF genom de flesta svenska banker och Internetmäklare, till exempel Nordnet, SAVR, DEGIRO och Avanza.
Handla ASWC ETF
HANetf Future of Defence UCITS ETF (ASWC ETF) är en europeisk börshandlad fond. Denna fond handlas på flera olika börser, till exempel Deutsche Boerse Xetra och London Stock Exchange. Av den anledningen förekommer olika kortnamn på samma börshandlade fond.
Det betyder att det går att handla andelar i denna ETF genom de flesta svenska banker och Internetmäklare, till exempel Nordnet, SAVR, DEGIRO och Avanza.
[1] Hållbarhetsdokumentet kommer att finnas tillgängligt på webbplatsen inom kort.
[2] Bredaste sortiment som visas i ETF-databasen per den 21 oktober 2025. AUM kommer från HANetf och Bloomberg per den 15 oktober 2025.
[3] Som visas i ETF-databasen.


![HANetf ändrar indexet för Future of European Defence UCITS ETF (ticker: 8RMY) för att klassificera den som SFDR Artikel 8, vilket ger exponering mot försvar. [1]](https://media.etfmarknaden.se/2025/10/8RMY-ETF.jpg)


![HANetf ändrar indexet för Future of European Defence UCITS ETF (ticker: 8RMY) för att klassificera den som SFDR Artikel 8, vilket ger exponering mot försvar. [1]](https://media.etfmarknaden.se/2025/10/8RMY-ETF-80x80.jpg)


 Nyheter4 veckor sedan

 Nyheter2 veckor sedan
 Nyheter3 veckor sedan
 Nyheter4 veckor sedan
 Nyheter4 veckor sedan