
Nyheter
Market Snapshot: Gold’s Resilience Defies Risk-On Rally

Gold held steady in May near $3,200/oz despite strong equity markets, while gold miners gained 3%, aided by solid Q1 results—even as rising gold prices added to production costs.
Monthly gold market and economic insights from Imaru Casanova, Portfolio Manager, featuring her unique views on mining and gold’s portfolio benefits.
Market Snapshot: Gold’s Resilience Defies Risk-On Rally
In May 2025, gold demonstrated notable resilience, holding firm around the $3,200 per ounce range1 despite a broad rebound in global equity markets and the resurgence of the “risk-on” trade. Market optimism was primarily driven by a temporary easing of trade tensions and signals that trade negotiations could be moving in the right direction. The S&P 500 jumped 6% in May2, yet gold managed to close the month unchanged from the end of April. As of 11 June, gold is up 91.55% over the past five years3. Investors should keep in mind that past performance is not a reliable indicator of future results, and that investment in gold is subject to risks, including volatility and the risk of investing in natural resources.
Gold’s ability to maintain its value in the face of rising stock indexes and improving investor sentiment reflects lingering concerns over macroeconomic instability, including unresolved trade tensions, high sovereign debt levels and geopolitical flashpoints. Gold’s resilience was particularly impressive considering investment demand, as tracked by the holdings of global gold bullion ETFs, declined in May, down 0.77%4. This reaffirms our view that other centers of demand, most notably global central banks, continue to provide support for the gold price in the current environment.
Unlike investor interest, which seems to surge and fade depending on evolving financial market conditions and global macro-economic developments, the official sector’s gold buying appears anchored to a long-term commitment to diversify its reserves and is supported by gold’s role as an inflation hedge and strong performance in times of crisis. Gold closed as high as $3,431 on May 6, and as low as $3,177 on May 14, ending the month at $3,289.35 per ounce—effectively unchanged from April’s close of $3,288.715.
Earnings Season Highlights Operational Discipline in Gold Miners
The gold miners, as represented by the NYSE Arca Gold Miners Index (GDMNTR), delivered a respectable performance in May, rising 3.02%6. This gain came despite gold’s flat performance and a strong rebound in broader equity markets. Investors should be mindful that it is not possible to
invest in indices, and the past performance is not a reliable indicator for future performance. May marked the peak of the Q1 reporting season for gold miners, with operating and financial results that generally exceeded expectations across the sector—likely contributing to the equity’s relatively strong performance.
The market seems to be very focused on gold miners’ ability to meet their targets, particularly around production costs. Consistently meeting or beating production and costs targets could continue to improve investor sentiment toward gold mining stocks and support a re-rating of the sector, lifting valuation metrics to levels more in line with historical multiples.
Margin Pressures: Unpacking the Drivers of Rising Mining Costs
The market’s obsession with costs is justifiable. Investors might own gold stocks to benefit from their leverage to the gold price in a rising gold price environment, but, if at the same time, costs were also to increase, margin expansion would be compromised. During a recent podcast, we were asked an important question: why do production costs tend to increase when the gold price is increasing? Let’s examine some of the main reasons.
- Royalties – Gold mines across the world are subject to royalties. Most governments collect a portion of the profits of a gold mine that operates in their country in the form of royalties. In some cases, these royalties operate on a sliding scale, so that the higher the gold price, the higher the royalty rate. In addition, royalties can be the result of financing arrangements or a legacy from previous ownership structures. In any case, as the gold price increases, companies face larger royalty expenses, which are included in the cost of production.
- Profit sharing – Gold mining operations around the world have also established profit sharing agreements with their employees. The higher the gold price, the more profits generated, and the larger the profit-sharing costs to the company.
- Inflation – Higher gold prices can coincide with higher levels of inflation. This inflation can be widespread, affecting all sectors of the economy, and likely contributing to demand for gold. Or it can be sector specific inflation, caused by a higher commodity price environment which leads to increased demand and competition among miners for labor, equipment, consumables, energy and services as industry activity picks up. In either case, inflationary pressures contribute to higher costs of production.
- Foreign currency appreciation – A higher gold price can contribute to the appreciation of the currencies of countries that produce it, especially if gold production is a significant part of their economy. Stronger local currencies result in higher U.S. dollar costs for gold miners, as a large portion of production costs is denominated in the local currency.
- Lower grade – As the gold price increases, companies may decide to mine and process lower grade (i.e., lower concentration of gold per tonne of rock) portions of the gold deposit. Production of lower grade material may become economic at higher gold prices, and companies may choose to extract this material and maximize production and revenues over the life of the mine. Although more gold will be mined, it is more costly to produce gold from lower grade material, so unit costs of production will also go up in that scenario.
- Higher sustaining and exploration expenditures – Higher free cash flow because of higher gold prices allows companies to spend more in maintaining and expanding their operations. Exploration activities may pick up, and sustaining capital expenditures may be accelerated or forced to play catch up after previous years’ deferrals.
Outlook: Rising Gold Prices, Stable Costs, Stronger Valuations
Gold companies are currently producing gold at an average all-in sustaining cost (AISC) of approximately $1,600 per ounce, translating into an average margin of more than $1,600 per ounce at today’s gold spot prices, a record for this industry.
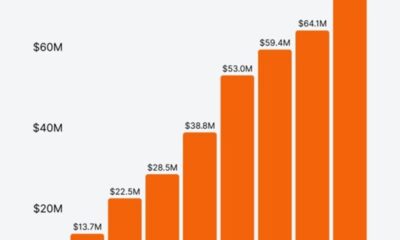
Take Alamos Gold. While gold prices have more than doubled since 2014, the company’s AISC have remained relatively stable—supporting record margins today.
Gold Price vs. Alamos Gold AISC: A Decade of Expanding Margins
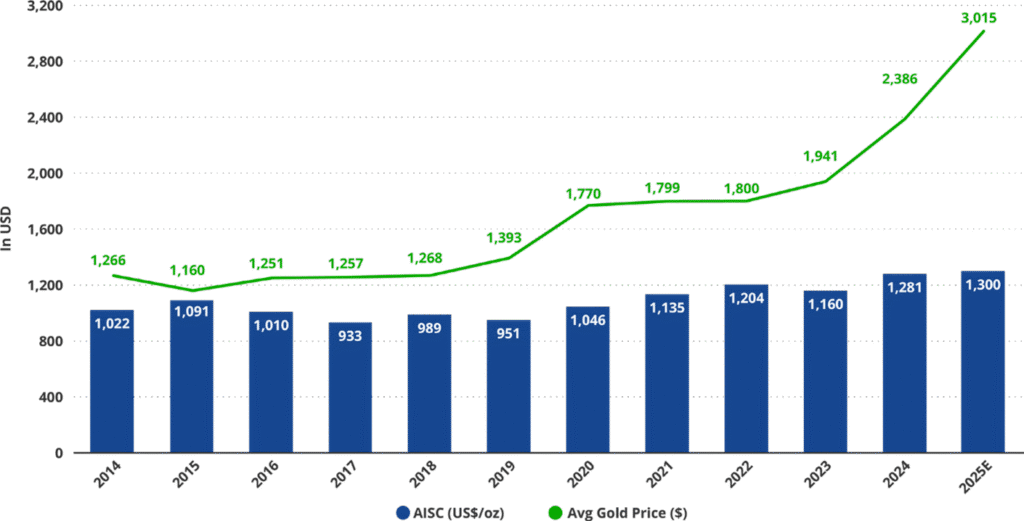
Source: Bloomberg, Datastream, ICE Benchmark Administration, World Gold Council, and Alamos Gold (2025E value is based on guidance for 2025, which is between $1,250 and $1,300/oz). Average Gold Price is represented by LBMA Gold Price PM and priced per troy ounce. Total consolidated all-in sustaining costs include corporate and administrative and share based compensation expenses.
While costs could continue to increase going forward, we don’t expect costs to explode to the point where margin erosion is of significant concern. Although companies cannot control cost increases coming from factors such as those listed in the first four points above, they can continue to look for ways to optimize their operations and increase productivity to offset some of those cost pressures and help contain costs. Our positive outlook for gold is accompanied by our projection that gold miners’ margins could continue to expand in a rising gold price environment, supporting higher valuations for the gold equity space.
To receive more Gold Investing insights, sign up to our newsletter.
1 World Gold Council. (11.06.2025)
2 Bloomberg data. (11.06.2025)
3 World Gold Council. (11.06.2025)
4 World Gold Council. (11.06.2025)
5 World Gold Council. (11.06.2025)
6 FT. (11.06.2025)


QDEV ETF investerar i utdelningsaristokrater från utvecklade länder

SNPE ETF köper de 100 största aktierna i USA

Två nya ETFer från SPDR på Xetra i dag

Den verkliga halveringen

XBHE ETF ger exponering mot korta företagsobligationer

Septembers utdelning i XACT Norden Högutdelande

HANetf kommenterar mötet mellan Kina, Ryssland och Nordkorea vid militärparad

USBG ETF köper statsobligationer och hedgar dem i dollar

IncomeShares fondflöden nådde en ny rekordnivå i augusti

HANetf kommenterar Norges avtal om krigsfartyg med Storbritannien
-
 Nyheter4 veckor sedan
Septembers utdelning i XACT Norden Högutdelande
-
 Nyheter4 veckor sedan
HANetf kommenterar mötet mellan Kina, Ryssland och Nordkorea vid militärparad
-
 Nyheter4 veckor sedan
USBG ETF köper statsobligationer och hedgar dem i dollar
-
 Nyheter4 veckor sedan
IncomeShares fondflöden nådde en ny rekordnivå i augusti
-
 Nyheter4 veckor sedan
HANetf kommenterar Norges avtal om krigsfartyg med Storbritannien
-
 Nyheter4 veckor sedan
September är extremt
-

 Nyheter4 veckor sedan
JEIA ETF satsar på amerikanska aktier och använder en derivatstrategi för att öka avkastningen
-

 Nyheter4 veckor sedan
IncomeShares ETPer – totalavkastning sedan noteringen