Följ oss

Nyheter

How are long-term BTC holders affected by the recent decline?

Publicerad

den

In this week’s newsletter, 21Shares explain Bitcoin’s recent price movements, Ethereum’s upcoming upgrade inching closer to mainnet, and how Polygon is leaping towards asset tokenization while helping consumers combat AI-generated fake news.

In this week’s newsletter, 21Shares explain Bitcoin’s recent price movements, Ethereum’s upcoming upgrade inching closer to mainnet, and how Polygon is leaping towards asset tokenization while helping consumers combat AI-generated fake news.

Bitcoin: Navigating a Cooling Market Amidst Unchanged Fundamentals

Despite investors capitalizing on profits at a rate reminiscent of late 2021, Bitcoin’s fundamentals stand resilient. To contextualize the price movements, with Bitcoin surging nearly 150% from the November 2022 lows and around 90% since the ETF-led speculation in October 2023, it’s reasonable to expect a cashing in on this rally. Although both short-term holders have been selling their holdings post the January 11th approval, the selling pressure, as indicated by transfers to exchanges in Figure 1, has started to stabilize. Nevertheless, a potential headwind lies in GBTC outflows. Particularly, investors who engaged in an arbitrage trade by purchasing GBTC in 2023 to leverage the fund’s discounted value, estimated at around $3 billion, are expected to be liquidating their positions. Further, the FTX estate divested most of its GBTC holdings, valued at approximately $1 billion, adding more color to the recent persistent outflows.

Figure 1: Short-Term Holders Transfer Activity to Exchanges
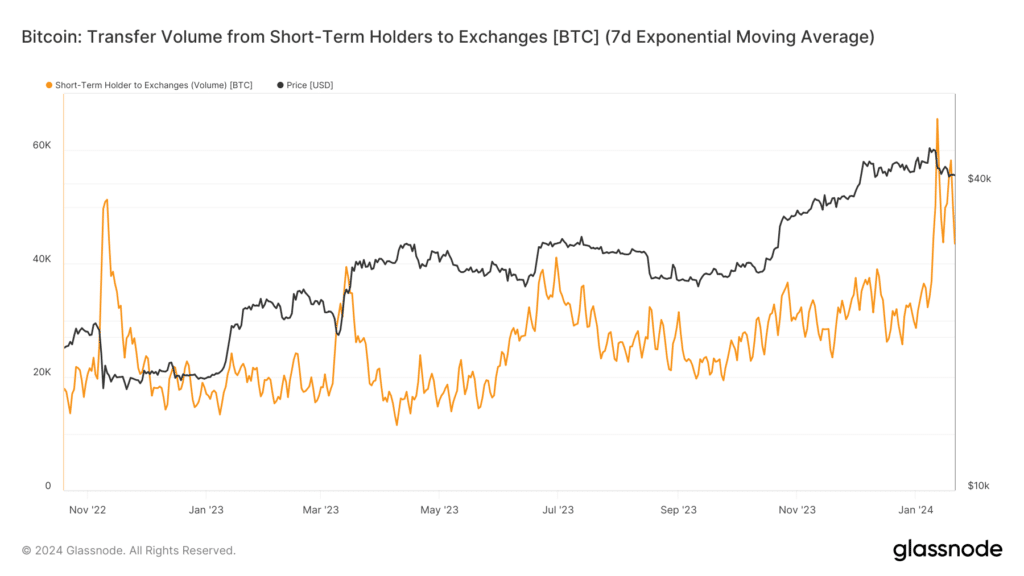
Source: Glassnode

With the attainment of this historic milestone, it becomes imperative to examine Bitcoin’s fundamentals to gauge the network’s overall health. The surge in new active addresses since January 11 indicates investors’ anticipation for the upcoming April 2024 halving event. Furthermore, the network is transitioning into a new phase marked by the emergence of diverse scaling solutions aimed at overcoming its limitations. This evolution enhances Bitcoin’s competitiveness among smart-contract platforms and heightens user excitement. A notable example is the upcoming Nakamoto upgrade by Stacks, scheduled around the halving. This upgrade will introduce sBTC, a derivative of Bitcoin with smart-contract functionality, that will enable interaction on top of its unique DeFi ecosystem. Additionally, the upgrade aims to reduce the network’s settlement time from 10 minutes to five seconds, providing a more streamlined user experience on top of the Bitcoin blockchain.

Ultimately, as Bitcoin’s hash rate maintains its upward trajectory, signaling sustained resilience for the network, and is complemented by the increasing number of whales highlighted in Figure 2—representing investors holding more than 1,000 BTC—a clearer picture unfolds. It is evident that long-term holders and steadfast believers in Bitcoin remain unfazed by the recent developments.

Figure 2: Large Holders’ Balance
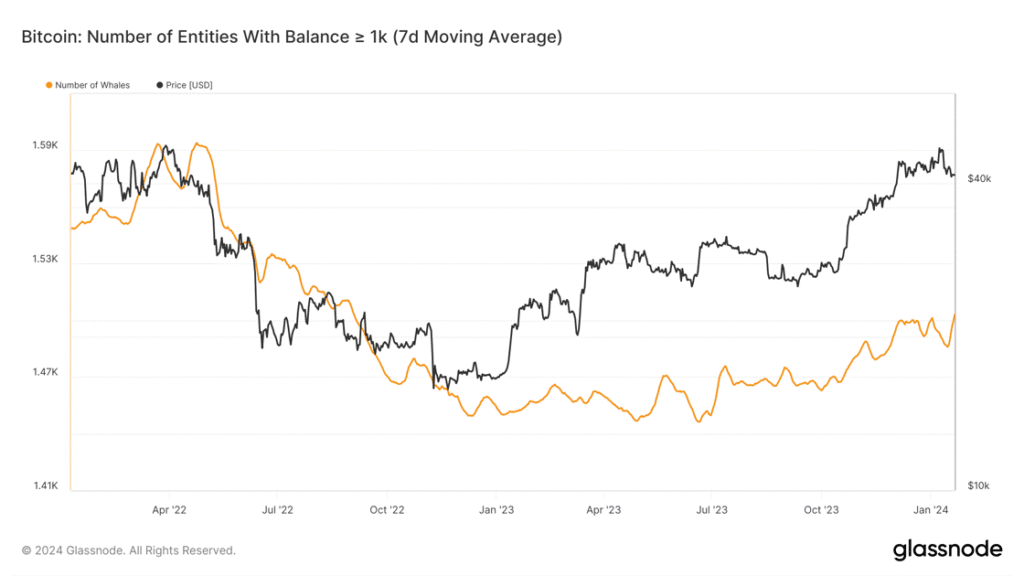
Source: Glassnode

Ethereum Clears the First Hurdle Towards its New Upgrade

Dubbed Dencun, the upcoming network upgrade aims to slash gas fees for Ethereum’s scaling solutions by nearly 90%. This will be achieved through the introduction of data blobs, a novel data container that efficiently carries substantial amounts of data at a lower verification cost. This innovation is poised to significantly reduce settlement costs for rollup networks such as Arbitrum and Optimism. Despite a minor glitch in the first upgrade trial where the Prysm validator client software failed to sync data correctly due to a bug, the diverse client ecosystem maintained the network’s resilience, with Prysm accounting for less than 40% of all Ethereum nodes.

With the successful completion of the current upgrade, the path is now paved for two additional trial runs on January 30 and February 7, leading to the expected mainnet deployment in late March. This upgrade is pivotal, standing out as a key driver of excitement around Ethereum and its extensive ecosystem of scaling solutions, as evidenced by the network’s surging daily transactions reaching a multi-year high (see Figure 3). The upgrade, combined with speculating the approval of a Spot Ethereum ETF in the U.S. and its potential impact on ETH’s performance, is poised to generate momentum for the second-largest cryptocurrency by market cap, solidifying its market position.

Figure 3: Daily Transactions on Ethereum
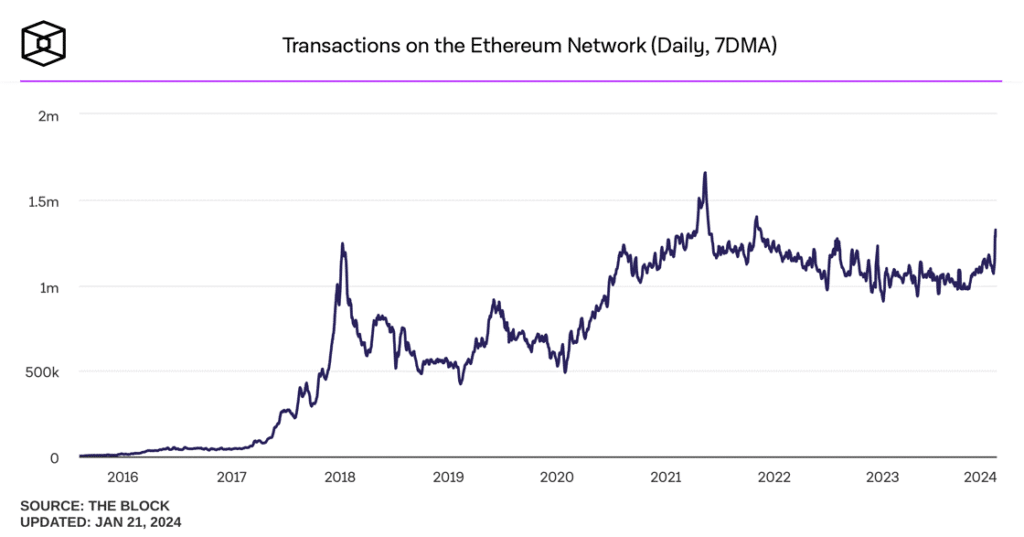
Source: The Block

Polygon Advances Tokenization while Showcasing Blockchain’s Influence Beyond Financial Applications

Polygon’s Chain Developers Kit, introduced last year, has attracted protocols aiming to cater to the growing institutional appetite for tokenization. Libre is one of these protocols, introduced on January 10, with Hamilton Lane and Brevan Howard as the first consumers. Going live this quarter, Libre is an institution-focused protocol offering compliant issuance and automated lifecycle management of alternative investments. Moreover, Polygon Labs joined the Tokenized Asset Coalition aiming at bringing $1 trillion in assets on-chain. These initiatives focusing on accelerating the adoption of tokenized assets show the active role Polygon is aiming to play across the tokenized market, which we at 21Shares expect to grow to $10 trillion by 2030.

Beyond the financial use cases that crypto is misperceived to exclusively fulfill, Polygon also announced “Verify” in partnership with Fox Corporation. Verify is a blockchain-based content verification platform that aims to empower media companies to register their content and grant artificial intelligence (AI) platforms the right to use them so that end-users can easily verify the origin of a piece of content. This use case of blockchain technology is of utmost importance with the rapid rise of AI across different disciplines. AI-generated content may be used in bad faith to make a rumor believable, for example. Fake news can be detrimental in the age of AI. Verify is another example of how Polygon is trying to break the barrier and showcase blockchain’s value proposition beyond finance.

This Week’s Calendar

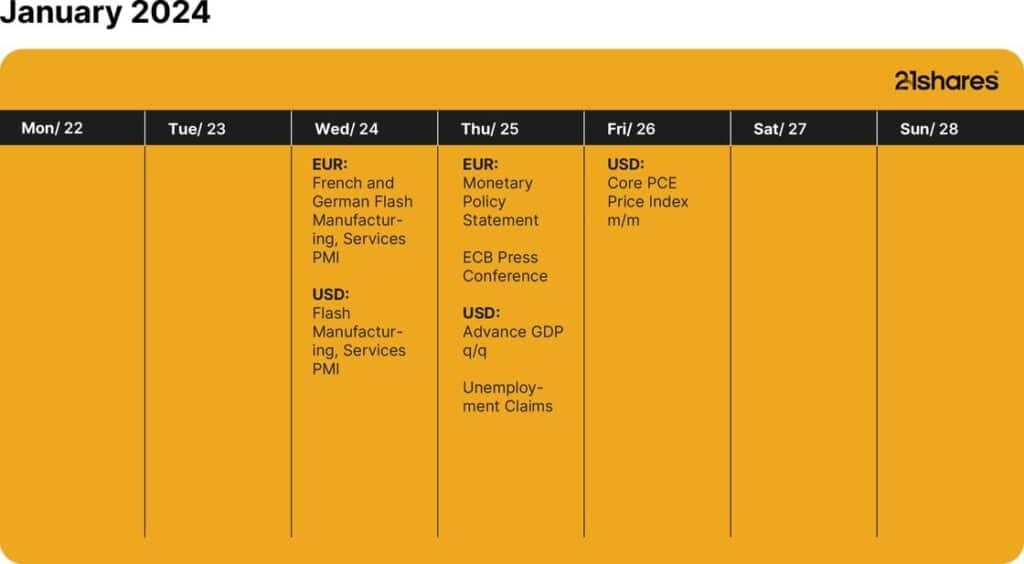
Source: Forex Factory

Research Newsletter

Each week the 21Shares Research team will publish our data-driven insights into the crypto asset world through this newsletter. Please direct any comments, questions, and words of feedback to research@21shares.com

Disclaimer

The information provided does not constitute a prospectus or other offering material and does not contain or constitute an offer to sell or a solicitation of any offer to buy securities in any jurisdiction. Some of the information published herein may contain forward-looking statements. Readers are cautioned that any such forward-looking statements are not guarantees of future performance and involve risks and uncertainties and that actual results may differ materially from those in the forward-looking statements as a result of various factors. The information contained herein may not be considered as economic, legal, tax or other advice and users are cautioned to base investment decisions or other decisions solely on the content hereof.

Fortsätt läsa
Annons
Klicka för att kommentera

Skriv en kommentar

Din e-postadress kommer inte publiceras. Obligatoriska fält är märkta *

Nyheter

De bästa lågvolatilitets ETFer på marknaden

Publicerad

den

Aktier med låg volatilitet tenderar att ge en överavkastning jämfört med den risk som tas. Denna forskningsbaserade observation kallas lågvolatilitetsfaktorn vilket gynnat uppkomsten av lågvolatilitets ETFer.

Aktier med låg volatilitet tenderar att ge en överavkastning jämfört med den risk som tas. Denna forskningsbaserade observation kallas lågvolatilitetsfaktorn vilket gynnat uppkomsten av lågvolatilitets ETFer.

Det finns olika möjliga förklaringar till detta: Till exempel kan aktier med låg volatilitet uppfattas som mindre givande av investerare då de är förknippade med mindre risk. En annan teori tyder på att investerare generellt överskattar sin förmåga att prognostisera. För särskilt volatila aktier finns en större oenighet mellan investerare, vilket bör leda till högre volatilitet och lägre avkastning.

Denna faktorstrategi kan även implementeras med hjälp av ett index. I den här investeringsguiden hittar du alla tillgängliga globala ETF:er med låg volatilitet. För närvarande finns det fem index som spåras av åtta olika ETFer tillgängliga. Den årliga förvaltningskostnaden för dessa börshandlade fonder ligger på mellan 0,25 och 0,30 procent.

En jämförelse av olika lågvolatilitets ETFer

Förutom avkastning finns det ytterligare viktiga faktorer att tänka på när du väljer lågvolatilitets-ETFer. För att ge ett bra beslutsunderlag hittar du en lista över olika lågvolatilitets -ETFer med information om kortnamn, kostnad, utdelningspolicy, fondens hemvist och replikeringsmetod.

För ytterligare information om respektive börshandlad fond, klicka på kortnamnet i tabellen nedan.

Namn
ISIN
KortnamnAvgift %Utdelnings-
policy
HemvistReplikerings-
metod
iShares Edge MSCI World Minimum Volatility UCITS ETF USD (Acc)
IE00B8FHGS14
IQQ00.30% p.a.AckumulerandeIrlandOptimerad sampling
iShares Edge MSCI World Minimum Volatility ESG UCITS ETF (Acc)
IE00BKVL7778
MVEW0.30% p.a.AckumulerandeIrlandOptimerad sampling
Xtrackers MSCI World Minimum Volatility UCITS ETF 1C
IE00BL25JN58
XDEB0.25% p.a.AckumulerandeIrlandOptimerad sampling
CSIF (IE) MSCI World ESG Leaders Minimum Volatility Blue UCITS ETF B USD
IE00BMDX0M10
CSY90.25% p.a.AckumulerandeIrlandFysisk replikering
iShares Edge MSCI World Minimum Volatility UCITS ETF USD (Dist)
IE00BMCZLJ20
UEEH0.30% p.a.UtdelandeIrlandOptimerad sampling
Xtrackers MSCI World Minimum Volatility ESG UCITS ETF 1C
IE0008YN0OY8
XWEB0.25% p.a.AckumulerandeIrlandFysisk replikering
Invesco Quantitative Strategies Global Equity Low Volatility Low Carbon UCITS ETF Acc
IE000N42HDP2
LVLC0.25% p.a.AckumulerandeIrlandFysisk replikering
XACT Norden Högutdelande (UCITS ETF)
SE0009778954
XACTHDIV0,3%UtdelandeSverigeFysisk replikering

Fortsätt läsa

Nyheter

WMMS ETF ETF en globalfond för värdeaktier

Publicerad

den

Amundi MSCI World IMI Value Screened Factor UCITS ETF UCITS ETF Acc (WMMS ETF) med ISIN IE000AZV0AS3, försöker spåra MSCI World IMI Value Select ESG Low Carbon Target-index. MSCI World IMI Value Select ESG Low Carbon Target-index spårar aktier från utvecklade länder över hela världen som väljs ut enligt värdefaktorstrategin och ESG-kriterier (miljö, social och företagsstyrning). Indexet har som mål att minska utsläppen av växthusgaser och ett förbättrat ESG-poäng jämfört med jämförelseindex. Jämförelseindexet är MSCI World IMI.

Amundi MSCI World IMI Value Screened Factor UCITS ETF UCITS ETF Acc (WMMS ETF) med ISIN IE000AZV0AS3, försöker spåra MSCI World IMI Value Select ESG Low Carbon Target-index. MSCI World IMI Value Select ESG Low Carbon Target-index spårar aktier från utvecklade länder över hela världen som väljs ut enligt värdefaktorstrategin och ESG-kriterier (miljö, social och företagsstyrning). Indexet har som mål att minska utsläppen av växthusgaser och ett förbättrat ESG-poäng jämfört med jämförelseindex. Jämförelseindexet är MSCI World IMI.

Den börshandlade fondens TER (total cost ratio) uppgår till 0,25 % p.a. Amundi MSCI World IMI Value Screened Factor UCITS ETF UCITS ETF Acc är den enda ETF som följer MSCI World IMI Value Select ESG Low Carbon Target-index. ETFen replikerar det underliggande indexets prestanda genom fullständig replikering (köper alla indexbeståndsdelar). Utdelningarna i ETF:n ackumuleras och återinvesteras.

Denna ETF lanserades den 30 oktober 2024 och har sin hemvist i Irland.

Investeringsmål

Amundi MSCI World IMI Value Screened Factor UCITS ETF Acc försöker replikera, så nära som möjligt, oavsett om trenden är stigande eller fallande, resultatet för MSCI World IMI Value Select ESG Low Carbon Target Index (”Indexet”). Delfondens mål är att uppnå en tracking error-nivå för delfonden och dess index som normalt inte överstiger 1 %

Handla WMMS ETF

Amundi MSCI World IMI Value Screened Factor UCITS ETF UCITS ETF Acc (WMMS ETF) är en europeisk börshandlad fond. Denna fond handlas på Deutsche Boerse Xetra.

Det betyder att det går att handla andelar i denna ETF genom de flesta svenska banker och Internetmäklare, till exempel DEGIRONordnet, Aktieinvest och Avanza.

Börsnoteringar

BörsValutaKortnamn
XETRAEURWMMS
XETRAGBPWMMT

Största innehav

Denna fond använder fysisk replikering för att spåra indexets prestanda.

NamnValutaVikt %Sektor
CISCO SYSTEMS INCUSD2.74 %Information Technology
INTL BUSINESS MACHINES CORPUSD2.66 %Information Technology
JOHNSON & JOHNSONUSD2.50 %Health Care
VERIZON COMMUNICATIONS INCUSD2.35 %Communication Services
COMCAST CORP-CLASS AUSD2.30 %Communication Services
AT&T INCUSD2.21 %Communication Services
APPLE INCUSD2.18 %Information Technology
MICROSOFT CORPUSD2.04 %Information Technology
NVIDIA CORPUSD1.90 %Information Technology
CITIGROUP INCUSD1.77 %Financials

Innehav kan komma att förändras

Fortsätt läsa

Nyheter

The Investment Case for TLT (Long-Dated Treasury Bonds)

Publicerad

den

The iShares 20+ Year Treasury Bond ETF (TLT) holds US government bonds that mature in 20 years or more. Since peaking in March 2020 at $179.90 per share, TLT’s price is still down roughly 50%. Most of that drop happened as US inflation – and then interest rates – rose to multi-decade highs. But with inflation now below 3%, potential interest rate cuts ahead, and an interesting chart setup, the investment case for TLT could be building.

The iShares 20+ Year Treasury Bond ETF (TLT) holds US government bonds that mature in 20 years or more. Since peaking in March 2020 at $179.90 per share, TLT’s price is still down roughly 50%. Most of that drop happened as US inflation – and then interest rates – rose to multi-decade highs. But with inflation now below 3%, potential interest rate cuts ahead, and an interesting chart setup, the investment case for TLT could be building.

What is TLT?

The iShares 20+ Year Treasury Bond ETF (TLT) is an exchange-traded fund (ETF) that trades on the US stock market. The fund holds “long-dated” US government bonds with maturities of 20 years or more. By holding a basket of them, TLT reflects how investors generally value this part of the bond market.

Each bond in TLT is a 20-plus year loan to the US government. The investor lends money, and in return receives fixed interest payments (coupons) each year. The government sets the coupon rate when it issues (creates) a new bond, and that rate never changes. After issuance, the bond can trade on the bond market, where its price may move up or down.

What affects the value of long-dated US Treasury bonds (and TLT)?

All else being equal, long-dated Treasury bonds tend to be more volatile than shorter-dated ones. Interest rates and inflation expectations are the two main levers that can move their prices – and hence the price of TLT.

Interest rates: When rates rise, newly issued bonds pay higher coupons. Older bonds in TLT can then look relatively less attractive, so their prices may fall. When rates fall, it’s the opposite: new bonds pay lower coupons, so older bonds look “better” and may rise in price. Because TLT only holds long-dated bonds, its price tends to react more to interest rate changes than short-term bond funds. Rate shifts tend to have a bigger impact on long-dated bonds because their fixed coupons extend far into the future. Even a small change in yields can make those older coupons look much better – or much worse – for a very long time.

Inflation expectations: When investors expect higher inflation in the future, the fixed coupons (and principal) in TLT can look less valuable in today’s money. That perception can push bond prices down as investors sell bonds. And when investors think future inflation will be lower, the same coupons can look more valuable today, which may support bond prices. Because TLT’s bonds mature further into the future, inflation has more time to erode their interest and principal repayments. That’s why long-dated bonds are usually more sensitive to inflation than shorter-dated ones.

The chart below compares the price of TLT (orange) with US interest rates (black) and US inflation (blue). It’s not an exact science, but TLT has tended to move opposite to both of them since the ETF launched in 2003.

Other factors can also play a role. The US government regularly issues (creates) new bonds, and if supply goes up, prices can fall. On the demand side, big buyers like pension funds, insurance companies, or foreign central banks can move the market. Credit risk perception is also key. Investors usually see Treasuries as very low risk, but not “risk-free”. So if they lose confidence in the US government’s repayment ability, it could hurt bond prices.

The investment case for TLT today

We’ve explained how lower interest rates and lower inflation might be a better environment for long-dated US treasury bonds. As explained below, there are reasons to believe we could be moving into that environment now.

The US Federal Reserve (Fed) essentially has two jobs, and it’s a constant balancing act between the two:

  1. Keep inflation down (by raising interest rates to slow the economy).
  2. Keep employment high (by lowering interest rates to speed up the economy).

US inflation peaked above 9% in June 2022, and it’s been trending lower ever since. Inflation isn’t very low yet (2.9% CPI as of August) – but it’s low enough for the Fed to focus more on job number two. Factor in a slowing economy, and the Fed is more likely to cut interest rates from here to boost employment numbers.

The chart below shows the US unemployment rate in orange. It’s now at 4.3% (August) – the highest unemployment rate since November 2021. In the past, unemployment rose gradually at first, before eventually breaking much higher. If that pattern repeats, we could see a bigger spike in unemployment.

Not only is the unemployment rate rising, but the number of new job openings is dropping, too. US nonfarm payrolls (new jobs excluding farming, private households, non-profits, and the military) showed that the US economy added just 22,000 new jobs in August.

And to make matters worse, the government also revised its earlier estimates down. The adjustment meant the US added around 911,000 fewer jobs in the year through March 2025 than first reported.

AI could also factor into these numbers. After all, companies are rolling out AI tech to improve productivity – and that puts pressure on the “human” job market. AI can also make goods and services cheaper to produce, which is inherently disinflationary (the opposite of inflation).

This setup could give the Fed more ammo for bigger rate cuts in the future. Throw in lower inflation, and we could see a solid backdrop for TLT.

The technical picture for TLT

Not many assets are trading near 20-year lows. But as the chart below shows, TLT is trading near technical “support” from the early 2000s (orange). Also note that TLT recently broke above a downward sloping trendline that’s been in play since December 2021. This may signal that selling pressure is easing, and buyers are stepping in.

The chart below shows Bollinger Bands around TLT’s price. Here, the middle band is TLT’s 20-month average price, and each red or green candle represents one month of price movement for TLT.

The further the outer bands are from the middle band, the more volatile TLT’s price, according to the indicator. At this point, the Bollinger Bands are pinching together – a sign of relatively low volatility for TLT. Volatility tends to be “mean reverting” – meaning it usually cycles from periods of lower volatility to higher volatility. If the bands now start to widen, and the price trends higher, we could see a sustained rally for TLT.

The next chart zooms into the weekly timeframe, where each red or green candle represents one week of price movement for TLT. In this case, the Bollinger band width represents the volatility of TLT around its 20-week moving average. The blue line underneath it shows the width of the Bollinger Bands – lower is narrower, and less volatility.

Last month, the Bollinger Bands reached their narrowest level since September 2018. In other words, TLT’s volatility reached its lowest level in seven years, according to the indicator. Now notice how the bands started expanding this month – from that very low volatility base. This suggests TLT could see more volatility going into the end of 2025. Keep in mind that volatility is direction neutral.

Risks

The investment case for TLT depends heavily on inflation staying low and the Fed being willing to cut rates. If inflation rises again, TLT may fall further. Heavy government borrowing could also pressure Treasuries if investors demand more compensation to buy the debt. And if the economy holds up better than expected, the Fed might not need to cut rates.

How IncomeShares ties in

The IncomeShares 20+ Year Treasury Options ETP holds TLT and sells call options on it.

• Selling calls generates option premiums that aim to provide monthly income.

• Exposure to TLT keeps the ETP linked to bond price moves.

• If TLT rises too far, gains may be capped to the strike price.

• If TLT falls, the option income may help cushion part of the drop.

Key takeaways

• TLT holds US government bonds due in 20+ years, which are typically more sensitive to interest rates than short-term bonds.

• After years of losses, inflation is lower, yields are higher, and economic data points to a slowdown – but risks remain.

• The IncomeShares TLT Options ETP aims to generate monthly income by selling calls, while keeping some exposure to TLT.

Follow IncomeShares EU for more insights.

Your capital is at risk if you invest. You could lose all your investment. Please see the full risk warning here.

Fortsätt läsa

Populära