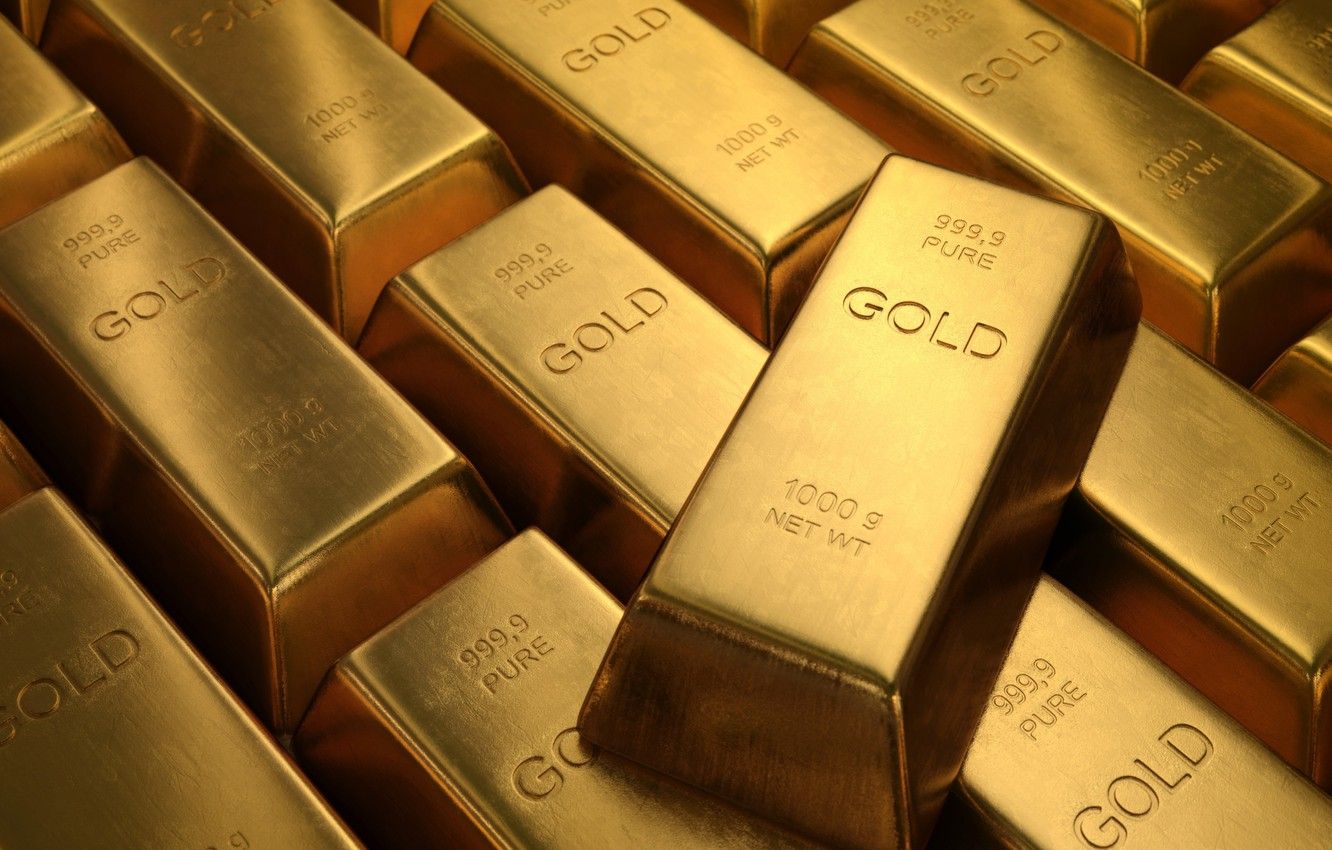
Guldfonderna såg utflöden på två procent i februari, detta för att guldpriset föll och räntorna steg. De globala guldfonderna tappade 84,7 ton (-4,6 miljarder dollar, -2,0% AUM) i februari 2021, vilket markerade utflöden för tredje gången på fyra månader och den sjunde sämsta historiska månatliga innehavsförlusten. Globala tillgångar under förvaltning (AUM) uppgår nu till 3 681 ton (207 miljarder US-dollar), nivåer som senast sågs i juni 2020, då guldpriset var nära slutet av februari i slutet av 1 743 US $ / oz.
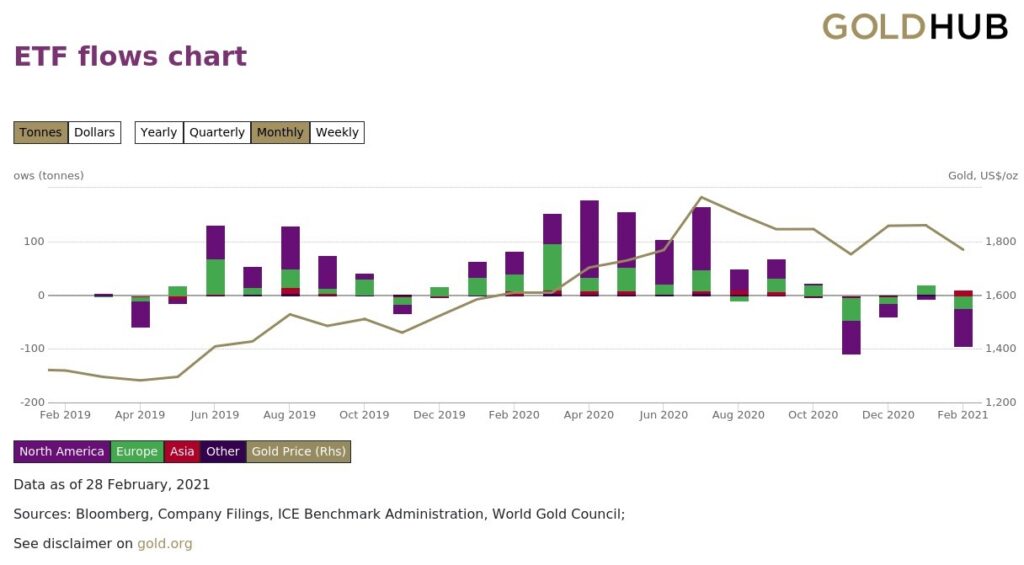
Uppgifter per den 28 februari 2021
Källor: Bloomberg, Company Filings, ICE Benchmark Administration, World Gold Council
Regional översikt
På regional nivå drevs utflöden främst av nordamerikanska fonder -71,2 ton (4,1 miljarder US dollar, -3,4%), främst från de största fonderna, i motsats till lågpris-guld-ETF: er som upplevde nettoinflöden – vilket tyder kanske på ökat strategiskt köp mitt i momentum försäljning. Europeiska fonder såg utflöden på -23,8 ton (1,1 miljarder USD, -1,1%), främst från brittiska fonder. Fonder i andra regioner hade mindre utflöden på -0,3 ton (27 miljoner US-dollar, -0,7%). Den enda ljuspunkten var Asien, med ett betydande inflöde på 10,6 ton (596 miljoner US-dollar, + 8,4%), främst till kinesiska och indiska börsnoterade fonder. I Kina använde investerare guldåterbetalningen, liksom den första återbetalningen av marknaden i CSI 300 sedan september, för att lägga till ETF-innehav. Prisrabatten i Kina blev också positiv under årets två första månader och markerade ökad efterfrågan.
Prisutveckling och handelsvolymer
Guld i amerikanska dollar hade sin största månadsminskning på fyra år (-6,5%) och slutade på 1 743 US $ / oz. Ur ett prestationsperspektiv är detta en ovanlig start på året. Under de senaste två decennierna har januari / februari vanligtvis varit den starkaste tvåmånadersperioden under året.2 Det finns liknande säsongsvariationer i guld-ETF-flöden; de ser generellt sett sitt starkaste inflöde under årets första kvartal.
Handelsvolymerna för guld sjönk med 12% under februari till 166 miljarder dollar per dag, under genomsnittet för 2020 på 183 miljarder dollar. Detta drevs främst av en minskning med 30% av COMEX terminshandel. Den långa nettopositioneringen, efter den senaste rapporten om Commotment of Traders (COT) för COMEX-terminer i guld, sjönk till 675 ton, under den genomsnittliga nettolångnivån för 2020 på 871 ton och den lägsta nivån sedan juni 2019.
Räntorna påverkar guldpriserna….
Under det senaste året eller så har WGC betonat att lägre räntor resulterade i en minskning av alternativkostnaden att äga guld. Omvänt, när räntorna stiger, blir avkastningen på obligationer mer attraktiv och skapar motvind för guldpriset. Detta har varit fallet de senaste månaderna som diskuterats i en ny blogg, guld rör sig med priser. WGCs kortfristiga guldprestationsmodell validerar detta perspektiv. Gulds känslighet för räntor har ökat mer än fyrfaldigt under det senaste året, och enbart ränteförändringen förklarar upp till 40% av guldets resultat under samma period.
Trots deras betydande relativa ökning är den totala nominella räntan dock historiskt låg och realräntorna på utvecklade marknader förblir negativa. WGCs analys visar att guld fortfarande kan prestera bra när räntorna är under 2% i reala termer, långt under deras nuvarande nivå.
… Men inflationsförväntningar och positionering av ”reflation” kommer i framkant
Medan högre nominella räntor kan skapa motvind för guld, kan högre inflation delvis kompensera deras effekt. När COVID-19-vaccinerna rullar ut och den monetära och finanspolitiska stimulansen fortsätter tror vi att den fortsatta ökningen av risktillgångar delvis drivs av en förväntan från investerare om att centralbanker och regeringar kommer att fortsätta att stödja globala marknader. Eftersom risktillgångar fortsätter att klättra är det troligt att investerare går bort från säkringar och diversifierare som obligationer och guld på jakt efter tillgångar som kan dra nytta av en högre korrelation till aktiemarknaderna.
Inflationsförväntningarna verkar emellertid öka och en råvaruledd ’reflation’ verkar ha börjat. Bredbaserade råvaror har visat styrka, vilket ofta inträffar när marknader går in i inflationstider. På året ökade oljan med mer än 25% och koppar med 17%. Virkespriserna har mer än fördubblats under de senaste fyra månaderna, vilket tyder på att investerare förväntar sig en ”reflation” av tillgångar. Inflationsåtgärder som konsumentprisindex förväntas stiga meningsfullt de närmaste månaderna. En del av detta är en funktion av att oljepriserna stiger så kraftigt från förra årets nivåer, men även andra mått är blinkande tecken på inflation. Nyligen nådde brytningsnivåerna för Treasury / TIPS, ett mått som mäter skillnaden mellan obligationer och realobligationer, 2,4%, en nivå som senast sågs för 10 år sedan.
Guld har hittills försenat råvarurallyt Detta är dock inte ovanligt. Historiskt sett har guld tenderat att underprestera en råvaruledd reflationsperiod under de första sex månaderna men har i allmänhet överträffat de efterföljande sex till 36 månaderna. Detta beror på att råvaror är närmare kopplade till konsumentkorgar och, när de stiger, matar inflationen högre. När förväntningarna ökar letar investerare ofta efter säkringar för att skydda mot den potentiella högre inflationen som historiskt sett har gynnat guld.
Penningpolitiken är redo att förbli tillmötesgående
Centralbanker över hela världen fortsätter att föreslå att de kommer att göra vad som behövs för att stödja ekonomin och hålla styrräntorna under överskådlig framtid. På måndag fördubblade Australien sina obligationslån för att stimulera den senaste tidens höjning av räntorna, och fokus ligger fortfarande på Europeiska centralbanken, som har sagt att undvika onödig höjning av räntorna. Indiens centralbank beslutade nyligen att fortsätta den tillmötesgående hållningen ”så länge det är nödvändigt”. Amerikanska centralbankens ordförande, Jerome Powell, har angett att räntorna i USA skulle hållas låga för att ge fortsatt stöd för en ekonomisk återhämtning även när inflationen tappar högre och ekonomin förbättras.
As April winds down, markets remain on edge, with escalating tariffs and renewed trade tensions keeping volatility in focus. In this summary of our full-length newsletter, we spotlight gold and gold equities, both of which have surged to record levels. We also take a step back from the day-to-day noise in crypto to explore the broader shifts in the regulatory landscape in our latest Whitepaper and present Celestia in detail. Finally, we assess how Moat indexes have held up and evolved amid the turbulence.
Gold & Gold mining equities tend to shine during stress periods
Source: VanEck, World Gold Council.
Gold has attracted renewed interest from investors amid concerns about inflation, currency volatility, and overall market uncertainty. Gold mining companies have recently reported improved profit margins and cash generation, with some initiating share buybacks and maintaining relatively strong balance sheets. Despite these developments, many continue to trade below their historical valuation averages.
While historical trends indicate that gold and gold mining equities have outperformed during certain periods of market stress, these patterns may not repeat under different economic conditions. Performance can be influenced by a range of factors including interest rates, central bank policy, geopolitical developments, and investor sentiment.
⚖️ Whitepaper Highlights: How New Crypto Regulations May Shape the Future
Cryptocurrencies are entering a new era. With the re-election of Donald Trump and the implementation of the European Union’s Markets in Crypto-Assets (MiCA) regulation, digital assets are moving into a landscape defined not just by innovation, but also by regulatory clarity.
MiCA’s structured and transparent approach aims to promote legitimacy, safeguard investors, and enhance trust in digital asset markets across Europe. It could also serve as a blueprint for other jurisdictions looking to regulate crypto effectively.
Most blockchains, like Ethereum or Bitcoin, are monolithic which means they perform all major functions (consensus, data availability, and execution) on a single layer. This design ensures security but according to new modular networks, limits scalability and flexibility.
The modular blockchain thesis, which Celestia is leading, proposes separation of layers and respective responsibilities in the network.
Note: This article in not accessible to our UK readers.
🌊 Riding the Gold Wave
Chasing the Vein: Fund Flows into Gold Miners
Source: Mining.com. Data as of 21 March 2025. Note: Data covers 493 funds with combined assets under management of $62 billion.
U.S. equity markets experienced significant declines during the month of March. Meanwhile, spot gold price recorded new all-time highs, surpassing the $3,000 per ounce mark on 14 March and closing at a record price of $3123.57 on March 31, a 9.30% ($265.73) monthly gain. As of 31 March, gold prices have risen by 93.61% over the past five years (1). Investors should keep in mind that past performance is not representative of future results.
The gold miners, as represented by the NYSE Arca Gold Miners Index (GDMNTR), outperformed significantly, up 15.51% during March (2). This gain reflects both their operational leverage to rising gold prices and market perceptions of relative value. However, gold miners can also be subject to heightened volatility, operational risks, and sensitivity to commodity price swings.
While gold and gold equities may serve as diversifiers in a portfolio due to their historically low correlations with many asset classes, investors should remain mindful of the inherent risks, including price volatility, currency movements, and shifts in investor sentiment that can lead to rapid reversals in performance.
Market turbulence in March weighed on stocks. The Moat Index was not immune to the market turmoil, as it declined along with the broad U.S. equity market ending the month lower. However, the Moat Index showed resilience relative to the S&P 500—thanks in part to defensive sector resilience and underweight exposure to mega-caps.
At the same time, the SMID Moat Index lagged small and mid-caps in March. Smaller U.S. stocks were also impacted by global trade tensions and economic growth concerns with the broad small- and mid-cap benchmarks falling during the month. However, year-to-date, the SMID Moat Index remains ahead of the broader small- and mid-cap markets.
(1) Source: World Gold Council, ICE Data Services, FactSet Research Systems Inc.
(2) Source: Financial Times.
IMPORTANT INFORMATION
This is marketing communication. Please refer to the prospectus of the UCITS and to the KID/KIID before making any final investment decisions. These documents are available in English and the KIDs/KIIDs in local languages and can be obtained free of charge at www.vaneck.com, from VanEck Asset Management B.V. (the “Management Company”) or, where applicable, from the relevant appointed facility agent for your country.
For investors in Switzerland: VanEck Switzerland AG, with registered office in Genferstrasse 21, 8002 Zurich, Switzerland, has been appointed as distributor of VanEck´s products in Switzerland by the Management Company. A copy of the latest prospectus, the Articles, the Key Information Document, the annual report and semi-annual report can be found on our website www.vaneck.com or can be obtained free of charge from the representative in Switzerland: Zeidler Regulatory Services (Switzerland) AG, Neudtadtgasse 1a, 8400 Winterthur, Switzerland. Swiss paying agent: Helvetische Bank AG, Seefeldstrasse 215, CH-8008 Zürich.
For investors in the UK: This is a marketing communication targeted to FCA regulated financial intermediaries. Retail clients should not rely on any of the information provided and should seek assistance from a financial intermediary for all investment guidance and advice. VanEck Securities UK Limited (FRN: 1002854) is an Appointed Representative of Sturgeon Ventures LLP (FRN: 452811), which is authorised and regulated by the Financial Conduct Authority (FCA) in the UK, to distribute VanEck´s products to FCA regulated firms such as financial intermediaries and Wealth Managers.
This information originates from VanEck (Europe) GmbH, which is authorized as an EEA investment firm under MiFID under the Markets in Financial Instruments Directive (“MiFiD). VanEck (Europe) GmbH has its registered address at Kreuznacher Str. 30, 60486 Frankfurt, Germany, and has been appointed as distributor of VanEck products in Europe by the Management Company. The Management Company is incorporated under Dutch law and registered with the Dutch Authority for the Financial Markets (AFM).
This material is only intended for general and preliminary information and shall not be construed as investment, legal or tax advice. VanEck (Europe) GmbH and its associated and affiliated companies (together “VanEck”) assume no liability with regards to any investment, divestment or retention decision on the basis of this information. The views and opinions expressed are those of the author(s) but not necessarily those of VanEck. Opinions are current as of the publication date and are subject to change with market conditions. Information provided by third party sources is believed to be reliable and have not been independently verified for accuracy or completeness and cannot be guaranteed.
Morningstar® Wide Moat Focus IndexSM, Morningstar® US Sustainability Moat Focus Index, Morningstar® US Small-Mid Cap Moat Focus IndexSM, and Morningstar® Global Wide Moat Focus IndexSM are trademarks or service marks of Morningstar, Inc. and have been licensed for use for certain purposes by VanEck. VanEck’s ETFs are not sponsored, endorsed, sold or promoted by Morningstar, and Morningstar makes no representation regarding the advisability of investing in the ETFs. Morningstar bears no liability with respect to the ETFs or any securities.
Effective December 15, 2023, the carbon risk rating screen was removed from the Morningstar® US Sustainability Moat Focus Index. Effective December 17, 2021, the Morningstar® Wide Moat Focus IndexTM was replaced with the Morningstar® US Sustainability Moat Focus Index. Effective June 20, 2016, Morningstar implemented several changes to the Morningstar® Wide Moat Focus Index construction rules. Among other changes, the index increased its constituent count from 20 stocks to at least 40 stocks and modified its rebalance and reconstitution methodology. These changes may result in more diversified exposure, lower turnover, and longer holding periods for index constituents than under the rules in effect prior to that date.
NYSE Arca Gold Miners Index is a service mark of ICE Data Indices, LLC or its affiliates (“ICE Data”) and has been licensed for use by VanEck UCITSETF plc (the “Fund”) in connection with the ETF. Neither the Fund nor the ETF is sponsored, endorsed, sold or promoted by ICE Data. ICE Data makes no representations or warranties regarding the Fund or the ETF or the ability of the NYSE Arca Gold Miners Index to track general stock market performance. ICE DATA MAKES NO EXPRESS OR IMPLIED WARRANTIES, AND HEREBY EXPRESSLY DISCLAIMS ALL WARRANTIES OF MERCHANTABILITY OR FITNESS FOR A PARTICULAR PURPOSE WITH RESPECT TO THE NYSE ARCA GOLD MINERS INDEX OR ANY DATA INCLUDED THEREIN. IN NO EVENT SHALL ICE DATA HAVE ANY LIABILITY FOR ANY SPECIAL, PUNITIVE, INDIRECT, OR CONSEQUENTIAL DAMAGES (INCLUDING LOST PROFITS), EVEN IF NOTIFIED OF THE POSSIBILITY OF SUCH DAMAGES. ICE Data Indices, LLC and its affiliates (“ICE Data”) indices and related information, the name “ICE Data”, and related trademarks, are intellectual property licensed from ICE Data, and may not be copied, used, or distributed without ICE Data’s prior written approval. The Fund has not been passed on as to its legality or suitability, and is not regulated, issued, endorsed’ sold, guaranteed, or promoted by ICE Data.
It is not possible to invest directly in an index.
Investing is subject to risk, including the possible loss of principal. Investors must buy and sell units of the UCITS on the secondary market via an intermediary (e.g. a broker) and cannot usually be sold directly back to the UCITS. Brokerage fees may incur. The buying price may exceed, or the selling price may be lower than the current net asset value. The indicative net asset value (iNAV) of the UCITS is available on Bloomberg. The Management Company may terminate the marketing of the UCITS in one or more jurisdictions. The summary of the investor rights is available in English at: complaints-procedure.pdf (vaneck.com). For any unfamiliar technical terms, please refer to ETF Glossary | VanEck.
No part of this material may be reproduced in any form, or referred to in any other publication, without express written permission of VanEck.
BBVA Acción Eurostoxx 50 ETF FI Cotizado Armonizado (BBVAE ETF) med ISIN ES0105321030, strävar efter att spåra EURO STOXX® 50-index. EURO STOXX® 50-indexet följer de 50 största företagen i euroområdet.
Den börshandlade fondens TER (total cost ratio) uppgår till 0,20 % p.a. ETFen replikerar resultatet av det underliggande indexet genom full replikering (köper alla indexbeståndsdelar). Utdelningarna i ETFen delas ut till investerarna (halvårsvis).
BBVA Acción Eurostoxx 50 ETF FI Cotizado Armonizado har tillgångar på 133 miljoner euro under förvaltning. Denna ETF lanserades den 3 oktober 2006 och har sin hemvist i Spanien.
Beskrivning BBVA Acción Eurostoxx 50 ETF FI Cotizado Armonizado
Med BBVA Acción Eurostoxx 50 ETF FI Cotizado Armonizado deltar investerare i ökningen av värdet på aktierna i de 50 största konglomeraten i euroområdet (euroområdet). Euro Stoxx 50-indexet inkluderar aktier från 8 länder i euroområdet: Belgien, Finland, Frankrike, Tyskland, Irland, Italien, Nederländerna och Spanien.
Explore Dogecoin’s impact on crypto, turning internet memes into cultural and financial assets.
𝕋𝕚𝕞𝕖 ℂ𝕠𝕕𝕖𝕤:
00:00 – Intro
00:27 – Where do Memes come from?
03:13 – What are some of the first Memes you remember?
10:28 – Do these things have value?
14:04 – The different types of cryptocurrencies
17:20 – How did Dogecoin start?
24:26 – What is some of the utility?
28:36 – How does it fit into the portfolio?
30:38 – Final thoughts
Research Newsletter
Each week the 21Shares Research team will publish our data-driven insights into the crypto asset world through this newsletter. Please direct any comments, questions, and words of feedback to research@21shares.com
Disclaimer
The information provided does not constitute a prospectus or other offering material and does not contain or constitute an offer to sell or a solicitation of any offer to buy securities in any jurisdiction. Some of the information published herein may contain forward-looking statements. Readers are cautioned that any such forward-looking statements are not guarantees of future performance and involve risks and uncertainties and that actual results may differ materially from those in the forward-looking statements as a result of various factors. The information contained herein may not be considered as economic, legal, tax or other advice and users are cautioned to base investment decisions or other decisions solely on the content hereof.
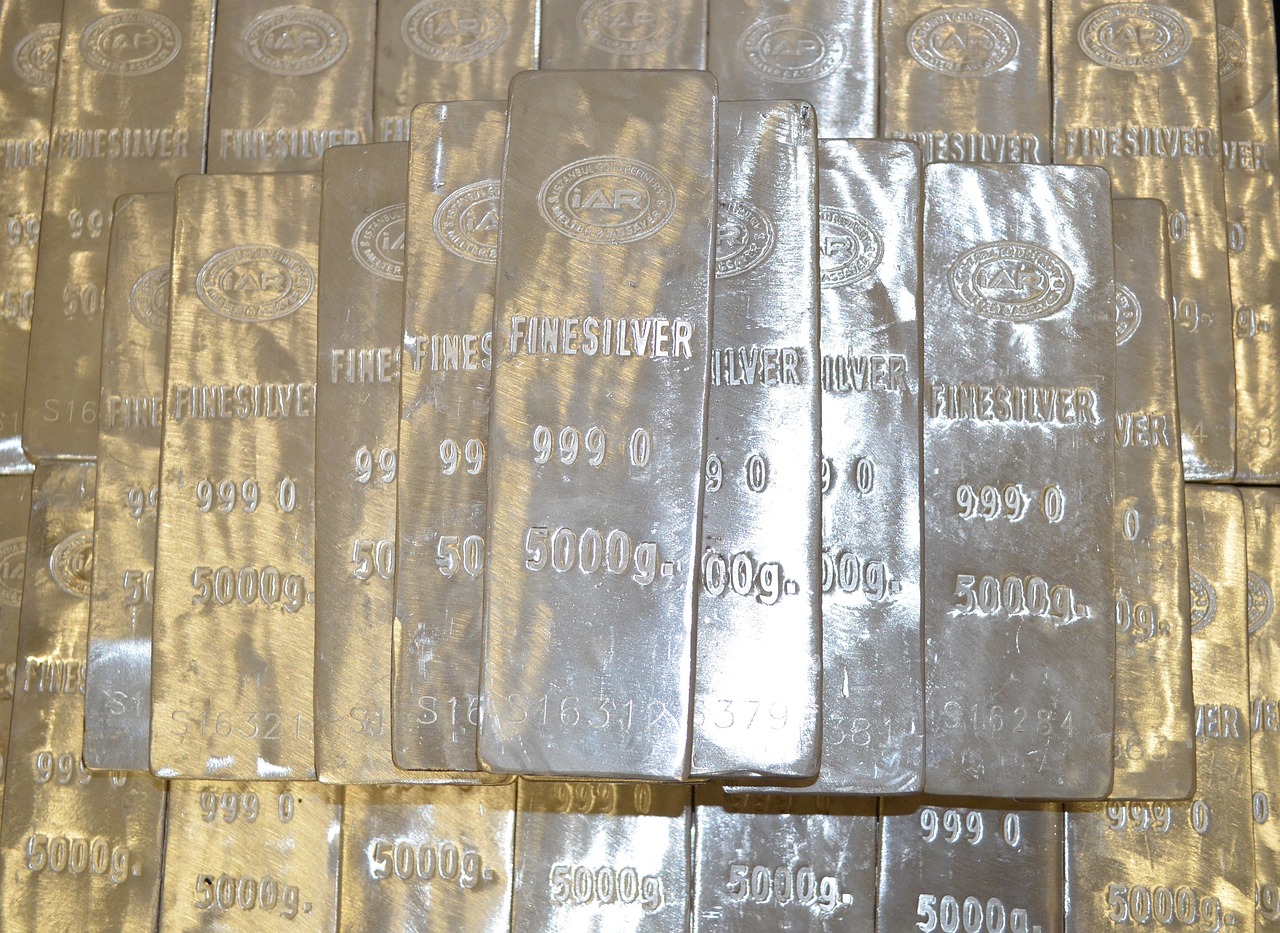