Nyheter
ETFmarknaden i Europa firar sitt 24-årsjubileum med tillgångar på två biljoner USD
Publicerad
1 vecka sedanden
ETFGI, ett ledande oberoende forsknings- och konsultföretag som täcker trender i det globala ETF-ekosystemet, rapporterar att ETFmarknaden i Europa firar sitt 24-årsjubileum med rekordtillgångar på nästan 2 biljoner US-dollar. De första europanoterade ETF:erna gjorde sin debut den 11 april 2000. Dessa två ETFer var baserade på Euro Stoxx 50– och Stoxx Europe 50-indexen, och de var noterade på Deutsche Boerse i Tyskland.
Tillgångar som investerats i ETF-branschen i Europa nådde rekordhöga 1,96 biljoner USD i slutet av mars. Under mars samlade ETF-branschen i Europa nettoinflöden på 11,02 miljarder USD, vilket ger årets nettoinflöden till 49,52 miljarder USD, enligt ETFGIs mars 2024 europeiska ETFer och ETPers industrilandskapsrapport, den månatliga rapporten som är en del av en årlig betald forskningsprenumerationstjänst. (Alla dollarvärden i USD om inget annat anges.)
Höjdpunkter
- Tillgångar som investerats på ETFmarknaden i Europa nådde ett rekord på 1,96 Tn i slutet av mars och slog det tidigare rekordet på 1,90 Tn i slutet av februari 2024.
- Tillgångarna ökade med 7,8 % YTD 2024, från 1,82 Tn USD i slutet av 2023 till 1,96 Tn USD.
- Nettoinflöden på 11,02 miljarder USD i mars 2024.
- YTD nettoinflöden på 49,52 miljarder USD är tredje högsta någonsin efter YTD nettoinflöden på 59,30 miljarder USD 2021 och YTD nettoinflöden på 49,73 miljarder USD 2022.
- Artonde månaden med på varandra följande nettoinflöden.
”S&P 500-indexet ökade med 3,22 % i mars och är upp 10,56 % YTD 2024. De utvecklade marknaderna exklusive det amerikanska indexet ökade med 3,62 % i mars och steg 5,26 % YTD 2024. Spanien (upp 10,72 %) och Italien (upp 6,34 %) såg de största ökningarna bland de utvecklade marknaderna i mars. Emerging markets-indexet ökade med 1,50 % under mars och steg 2,08 % YTD 2024. Peru (upp 10,27 %) och Columbia (upp 8,19 %) såg de största ökningarna bland tillväxtmarknaderna i mars”, enligt Deborah Fuhr, managing partner, grundare och ägare av ETFGI.
Tillgångstillväxt i ETF-branschen i slutet av mars
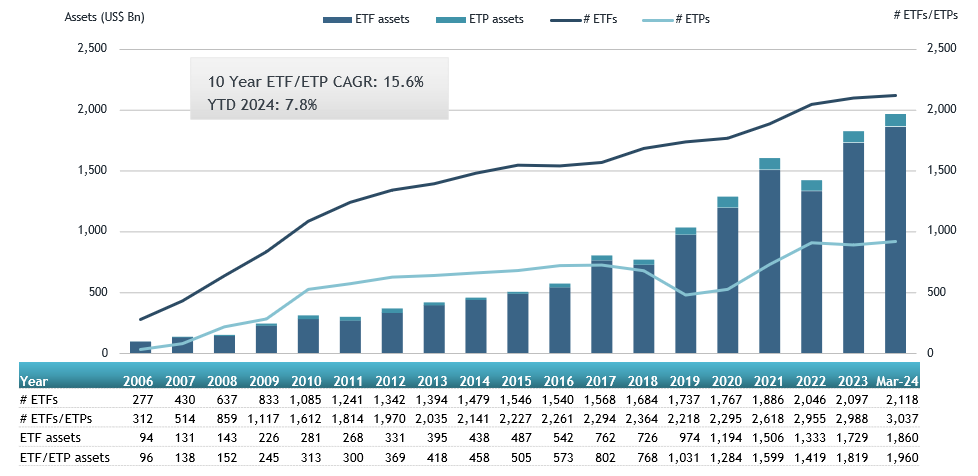
Källa: ETFGI
I slutet av mars hade ETFmarknaden i Europa 3 037 produkter, med 12 209 noteringar, tillgångar på $1,96 Tn, från 99 leverantörer listade på 29 börser i 24 länder.
Under mars samlade ETFer nettoinflöden till 11,02 miljarder USD. Aktie-ETFer samlade nettoinflöden på 9,81 miljarder USD under mars, vilket förde YTD nettoinflöden till 39,30 miljarder USD, högre än 19,38 miljarder USD i nettoinflöden av eget kapital YTD 2023. Ränte-ETFer rapporterade nettoinflöden på 719,00 USD YTD under 1 mars, vilket gav 25 USD nettoinflöden. miljarder, lägre än 15,49 miljarder USD i nettoinflöden YTD år 2023. Råvaru-ETFer rapporterade nettoutflöden på 75,35 miljoner USD under mars, vilket förde YTD nettoutflöden till 2,32 miljarder USD, lägre än 1,67 miljarder USD i nettoinflöden YTD 2023. på 670,27 miljoner USD under månaden, vilket samlade ett nettoinflöde för året i Europa på 2,33 miljarder USD, högre än 2,17 miljarder USD i nettoinflöden YTD 2023.
Betydande inflöden kan tillskrivas de 20 bästa ETFerna av nya nettotillgångar, som samlat in 9,63 miljarder USD under mars. iShares Core S&P 500 UCITS ETF – Acc (CSSPX SW) samlade in 918,91 miljoner USD, det största enskilda nettoinflödet.
Topp 20 ETFer efter nettoinflöden i mars 2024: Europa
Namn | Kortnamn | Assets ($ Mn) Mar-24 | NNA ($ Mn) YTD-24 | NNA ($ Mn) Mar-24 |
iShares Core S&P 500 UCITS ETF – Acc | CSSPX SW | 84,308.60 | 4,744.81 | 918.91 |
UBS ETF (LU) MSCI United Kingdom UCITS ETF (GBP) A-acc – Acc | UKGBPB SW | 2,485.72 | 653.33 | 753.94 |
Invesco MSCI USA ESG Universal Screened UCITS ETF – Acc | ESGU LN | 2,188.25 | 792.66 | 741.48 |
Xtrackers II EUR Overnight Rate Swap UCITS ETF – 1C – Acc | XEON GY | 7,281.96 | 2,089.43 | 596.35 |
HSBC S&P 500 UCITS ETF | HSPX LN | 6,756.08 | 661.46 | 562.23 |
iShares MSCI EM ESG Enhanced UCITS ETF | EEDM LN | 5,000.88 | 886.95 | 556.22 |
Vanguard FTSE All-World UCITS ETF | VWRD LN | 24,771.34 | 1,410.78 | 545.51 |
Invesco S&P 500 UCITS ETF – Acc | SPXS LN | 25,176.99 | 939.08 | 497.72 |
iShares MSCI ACWI UCITS ETF – Acc | ISAC LN | 12,806.01 | 1,453.06 | 469.35 |
iShares USD Treasury Bond 0-1yr UCITS ETF | IBTU LN | 14,990.95 | 1,433.49 | 431.07 |
iShares € High Yield Corp Bond UCITS ETF | IHYG LN | 7,694.75 | 1,427.77 | 413.53 |
SPDR S&P 500 UCITS ETF | SPY5 GY | 12,491.17 | 3,418.58 | 388.74 |
iShares Core MSCI World UCITS ETF – Acc | IWDA LN | 75,051.88 | 3,236.70 | 382.75 |
Amundi Bloomberg Equal-weight Commodity ex-Agriculture UCITS ETF – Acc | COMO FP | 1,668.95 | 367.30 | 378.26 |
iShares STOXX Europe Small 200 UCITS ETF (DE) | SCXPEX GY | 916.86 | 401.43 | 357.42 |
Amundi MSCI Japan UCITS ETF – Acc | LCUJ GY | 4,400.85 | 158.96 | 343.86 |
UBS ETF (CH) – MSCI Switzerland (CHF) A-dis – Acc | SWICHA SW | 1,126.17 | 354.69 | 335.87 |
SPDR MSCI World UCITS ETF – Acc | SPPW GY | 5,653.51 | 715.38 | 324.95 |
Amundi S&P 500 Climate Net Zero Ambition PAB UCITS ETF | ZPA5 GY | 3,965.66 | 925.46 | 320.42 |
JPMorgan US Research Enhanced Index Equity ESG UCITS ETF – Acc | JREU LN | 7,047.30 | 1,230.55 | 315.09 |
Källa ETFGI
De 10 bästa ETPerna av nya nettotillgångar samlade ihop 1,69 miljarder USD under mars. WisdomTree Physical Silver – Acc (PHAG LN) samlade in 832,90 miljoner USD, det största enskilda nettoinflödet.
Topp 10 ETPer efter nettoinflöden i mars 2024: Europa
Namn | Kortnamn | Assets ($ Mn) Mar-24 | NNA ($ Mn) YTD-24 | NNA ($ Mn) Mar-24 |
WisdomTree Physical Silver – Acc | PHAG LN | 2,057.21 | 793.35 | 832.90 |
iShares Physical Silver ETC – Acc | SSLN LN | 785.65 | 254.30 | 245.97 |
Xtrackers IE Physical Gold ETC Securities – Acc | XGDU LN | 3,640.08 | 231.87 | 167.72 |
AMUNDI PHYSICAL GOLD ETC (C) – Acc | GOLD FP | 4,575.61 | 307.29 | 127.12 |
Xtrackers Physical Gold ETC (EUR) – Acc | XAD5 GY | 2,202.38 | 92.10 | 80.28 |
WisdomTree Copper – Acc | COPA LN | 1,667.78 | 337.85 | 68.51 |
Xtrackers Physical Gold Euro Hedged ETC – Acc | XAD1 GY | 1,335.65 | 5.06 | 50.49 |
SG ETC FTSE MIB -3x Daily Short Collateralized – Acc | MIB3S IM | 33.07 | 88.10 | 40.49 |
21Shares Toncoin Staking ETP | TONN SW | 40.81 | 39.94 | 39.94 |
Invesco Physical Gold ETC – EUR Hdg Acc | SGLE IM | 564.18 | 59.65 | 33.11 |
Källa: ETFGI
Investerare har tenderat att investera i Equity ETFs under mars.
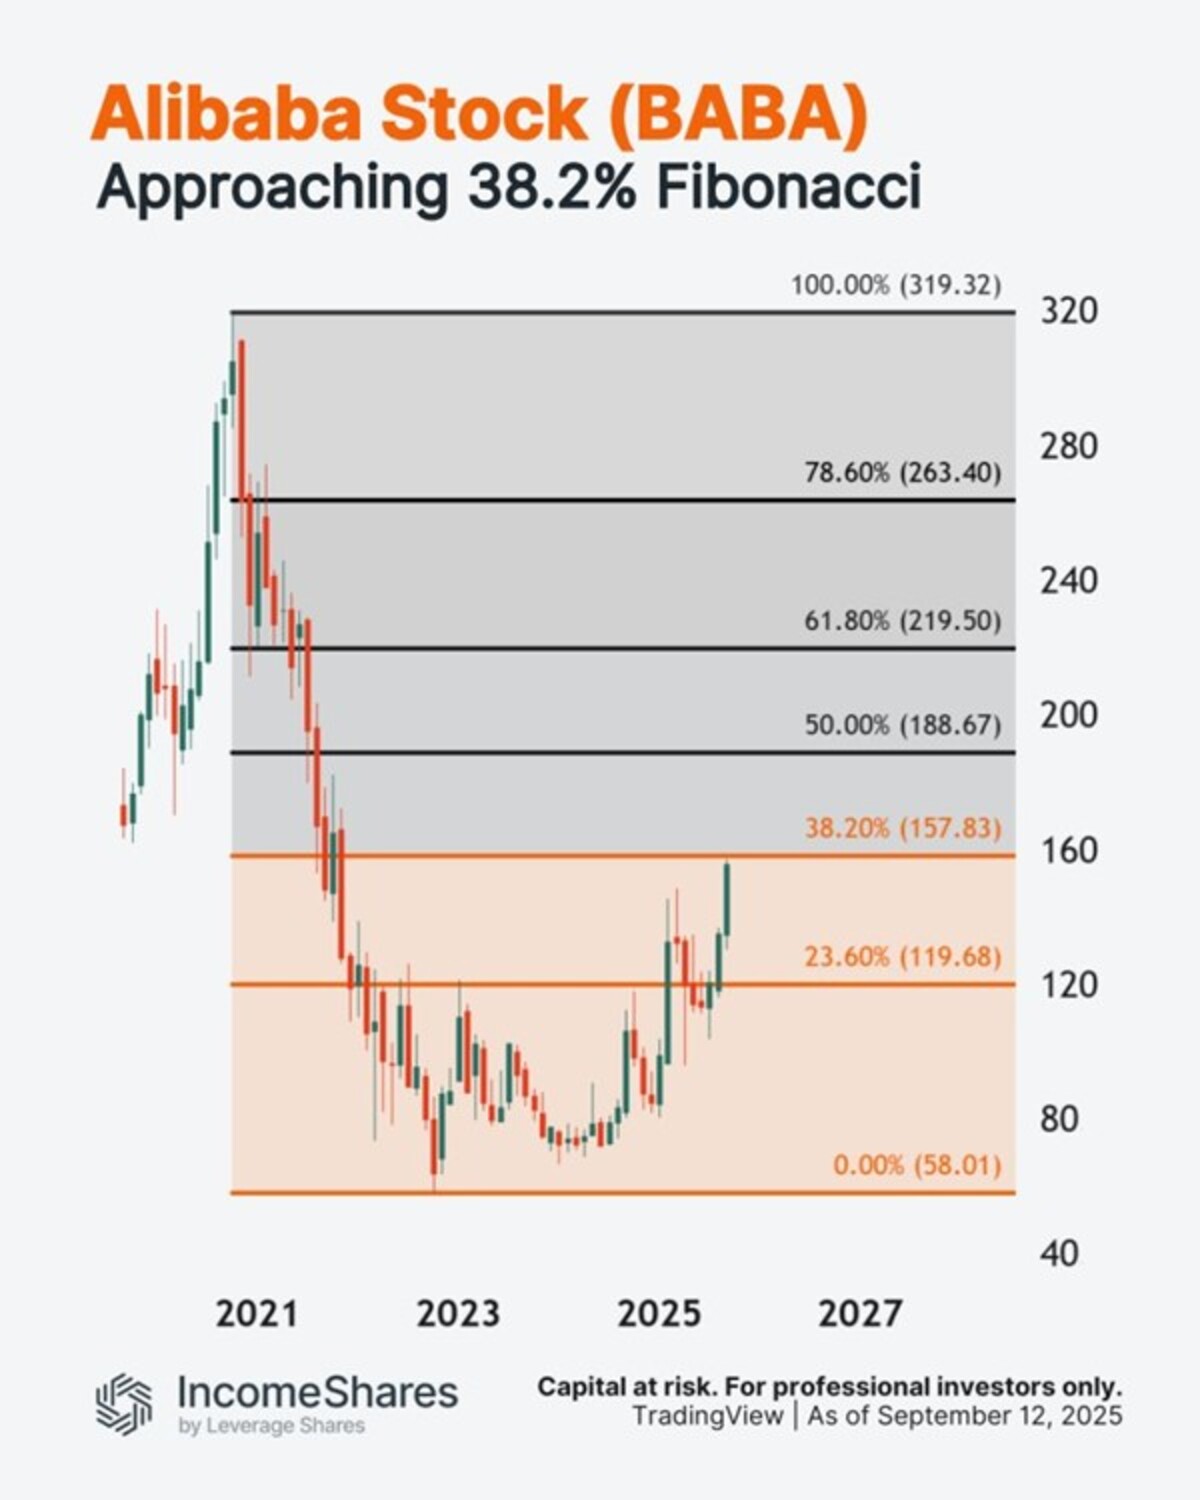
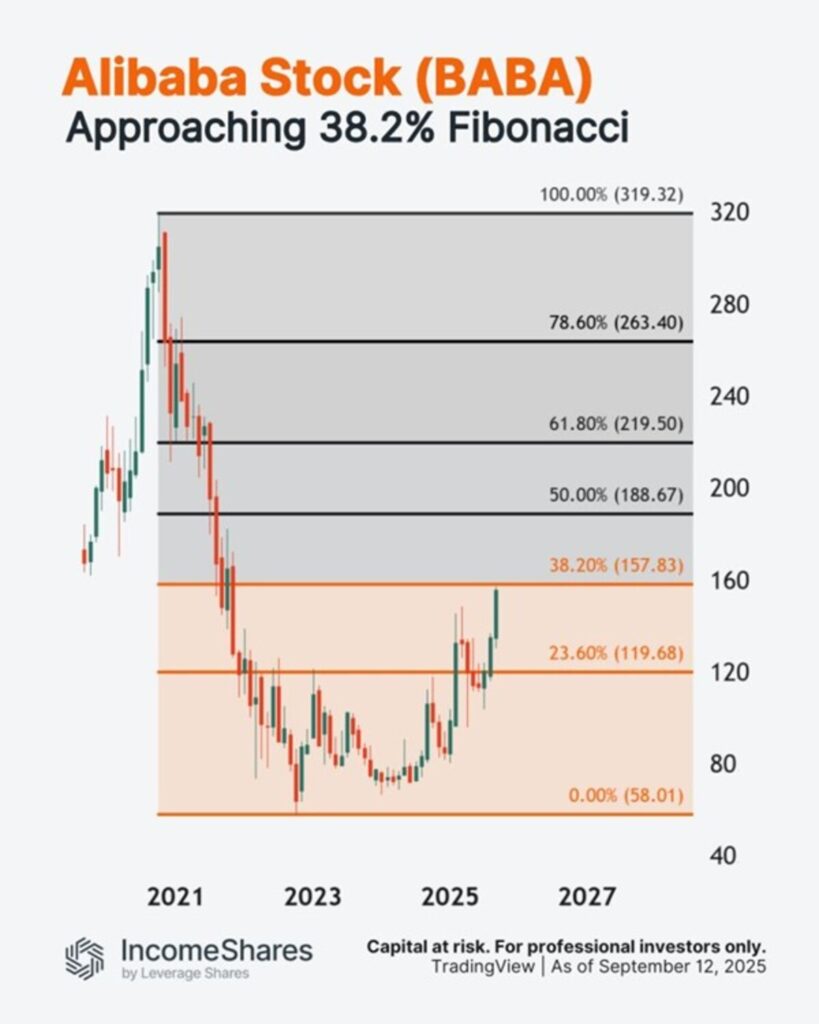
Du kanske gillar
Nyheter
Navigating Macro Headwinds, On-Chain Optics, and The Rise of Runes
Publicerad
45 minuter sedanden
24 april, 2024• Bitcoin Weathers Macroeconomic Storm
• Heightened User Activity, Soaring Transaction Fees, While Miners Sell Less
• Runes Protocol and Bitcoin’s Ever-Growing Ecosystem
Navigating Macro Headwinds, On-Chain Optics, and The Rise of Runes
This newsletter will be a Bitcoin-centric edition as we dissect the impact of recent macroeconomic events on Bitcoin’s price, followed up with an on-chain analysis of the network’s behavior post-halving. Additionally, we’ll explore some of the exciting innovations emerging within the Bitcoin ecosystem that were timed following the latest halving.
Bitcoin Weathers Macroeconomic Storm
The past two weeks have presented a challenging market environment for the crypto industry. As mentioned in our last newsletter, rising inflation in the U.S. remains, as evidenced by the higher-than-expected CPI print on April 9. Additionally, escalating conflict in the Middle East poses a significant threat to regional stability and added stress on the U.S. The potential of wider involvement from additional militant groups such as Lebanon’s Hezbollah, coupled with Iran’s control of a crucial maritime passage for commodity trading, the Strait of Hormuz, raise concerns about potential energy price hikes, steepening inflationary pressures and their effect on various asset classes.
Bitcoin initially reacted negatively to these events, experiencing an 8.22% drop in the immediate aftermath. Despite the 24/7 nature of crypto markets, which could have amplified the initial price shocks, Bitcoin’s underlying resilience shines through upon closer inspection. The S&P 500 fell by 2.03% on the market reopening last Monday and continues to tumble, while Bitcoin has recovered over 3.28% since the drawdowns, evidenced in Figure 1. This suggests a potentially more robust response to geopolitical turmoil compared to traditional assets, which is unsurprising given Bitcoin’s narrative as a flight to safety.
Figure 1: Bitcoin vs. Gold Price Performance Amid Geopolitical Tension
Source: TradingView
Examining Bitcoin’s market data, we see clear evidence that the futures market played a significant role in the initial price drops, which were attributed to the macroeconomic events of the last few weeks. A significant spike in long liquidations on the day of the attack, at $168M, suggests that some leveraged traders exited their positions, as shown below in Figure 2. Additionally, the high open interest at $35B leading up to the CPI print was followed by a recent $5B cool-off, indicating a correction in the futures market, reflected in the consolidation of the Bitcoin price.
Figure 2: Bitcoin Futures Long Liquidations, Short-Term and Long-Term Holder Supply
Source: Glassnode
Importantly, the spot market paints a more optimistic picture. In the last 10 days, which includes last week’s turbulence, long-term holders displayed minimal selling activity. Their holdings decreased by only 0.05%, while short-term holders continued to accumulate BTC, increasing their holdings by 0.5%. Notably, “Accumulation Addresses,” characterized by having no outbound transactions, holding more than 10 BTC, and not being affiliated with centralized exchanges or miners, have capitalized on the recent market dip. They currently hold over 3.17M BTC, accumulating over $2.3B since the CPI print, as evidenced below by Figure 3.
Figure 3 – Total Balance in Accumulation Addresses
Source: Glassnode
Further bolstering the positive outlook, the 90-day due diligence period for U.S. spot Bitcoin ETFs has now concluded. According to Bloomberg, over 100 fund managers have disclosed their ownership of these products, signifying the growing institutional appetite for Bitcoin exposure, adding another layer of support to the asset class.
Heightened Activity, Soaring Transaction Fees, While Miners Sell Less
In the world of Bitcoin, transactions get logged onto a whiteboard-like structure, divided into cells called “blockspace,” where each cell represents a limited amount of space. Transaction fees play a crucial role in managing limited block space on the Bitcoin network. Users who pay higher fees get their transactions prioritized for confirmation within these blocks. This ensures smoother operation by preventing congestion and disincentivizing low-value spam transactions. Additionally, transaction fees serve as an important security measure. They incentivize miners to dedicate significant computing power to validate transactions and secure the network. Without these fees, mining might become less profitable, potentially jeopardizing network security.
Finally, transaction fees are at the core of Bitcoin’s economic sustainability as the mining reward gets halved every 210,000 blocks, transaction fees step up to fill the gap and pump miners’ revenue. We can already see the early innings of transaction fees rising against the issuance or block rewards since the launch of Ordinals in 2023, as shown in the chart below.
Figure 4 – Bitcoin Miners Revenue Breakdown
Source: 21co on Dune
It is no surprise that Bitcoin network activity has been high this year, with the amount of active addresses hovering between 700K and 1 million since January, up until the halving event. On-chain data reveals a lower-than-expected drop in active addresses following the halving, with transaction fees reaching new highs. While active addresses did experience a significant drop (43%) on April 19, falling from over 893K to 500K, they have already recovered 70K since then. Historically, the halving typically leads to a smaller decrease in active addresses (3-9%). This larger drop could indicate that rising fees are pricing some users out of the market for now, but as we’ll cover later, there are certain solutions being worked on to help alleviate this issue.
That said, transaction fees soared up to $128 on April 20, breaking $78M, tripling the previous all-time high, and making up 75% of Bitcoin miner revenue, as shown in Figure 4. The spike was primarily due to Ordinal-like inscriptions which have recently seen a spike thanks to Runes protocol, which we’ll delve deeper into in the last section. In line with this, the burgeoning Bitcoin ecosystem, expedited by Rune, has not only pushed Bitcoin out of its comfort zone unlocking new use cases, but also its transaction fees to surpass Ethereum’s since May 2023, as seen in Figure 5.
Figure 5 – BTC vs ETH fees (2 Years)
Source: Glassnode
The growth in transaction fees is appreciated even further, especially when we examine miner behavior following the halving event. Miners are now less motivated to immediately liquidate their freshly acquired BTC, as they can capitalize on an additional revenue stream apart from block rewards.
Let’s zoom in on miner activity after the halving. About 50 BTC were sold on centralized exchanges on April 20, which doesn’t compare to the sell-off of March 5 when approximately 1,154 BTC were sent to exchanges, pulling the asset to ~$64K, down from ~$68K, as shown in the chart below. The recent sale also doesn’t compare to the 307 BTC sold on the day following the previous halving in May 2020, when the asset was trading just below $9K.
Figure 6 – Transfer Volume from Bitcoin Miners to Exchanges in BTC (YTD)
Source: Glassnode
The rising importance of Ordinal inscription, akin to non fungible tokens (NFTs), can be seen with Bitcoin generating $475M in real NFT sales versus Ethereum, which helps miners rake in more revenue and become sustainable. That said, the growing adoption of the Runes protocol is expected to drive even more activity toward the miners over the coming months.
Runes Protocol and Bitcoin’s Evergrowing Ecosystem
To recap, Runes streamlines the creation and management of fungible tokens on top of Bitcoin. It addresses the inefficiencies of the BRC20 standard, which have burdened the Bitcoin blockchain due to its inefficient data handling approach. That said, Runes achieves this in two key ways. Firstly, it optimizes transaction fees by consolidating multiple Unspent Transaction Output (UTXO) transactions into one bundle, leveraging Bitcoin’s accounting UTXO model. Additionally, it utilizes Bitcoin’s script, OP_Return, to inscribe data directly onto the blockchain, which serves to assign and transfer Runes balances within the network’s UTXOs. By minimizing data usage to 80 bytes, compared to BRC20’s 4MB, Runes prevents unnecessary bloat on the Bitcoin blockchain.
Ultimately, Runes presents an innovation aimed at bolstering Bitcoin’s security budget, offering miners an alternative revenue source to reduce their dependence on Bitcoin’s subsidized rewards over the long term. In fact, miners have earned about 1,500 BTC, valued at close to $100M in less than three days of trading activity, as seen below in Figure 7. To that end, Runes has garnered widespread support from the outset, with multiple Tier 2 exchanges such as OKX and Gate.io already announcing the listing of early collections like UNCOMMON.GOODS and MEME.ECONOMICS, which were among the first collections minted. Additionally, Binance appears to be hinting at support for meme tokens like Wizard and Pups, which were also among the first tokens to migrate from the BRC20 to the Runes standard. Meanwhile, NFT platforms like Magic Eden and Bitcoin-focused wallet provider Unisat are also joining the trend to capitalize on Runes’ growing popularity.
Figure 7: Fees Paid by Users to Mint Tokens Using the New Runes Protocol
Source: CryptoKoryo on Dune
Following the pattern of past hype cycles, we anticipate that the initial excitement surrounding Runes will gradually subside, followed by a surge of heightened activity in the long run. This trend is often observed because the initial wave of interest tends to be on meme tokens, which can be quickly deployed and attract the masses’ attention, but often don’t add substantial value. However, as time progresses, sophisticated primitives like exchanges, automated market makers, and other DeFi lego blocks will begin emerging. These advancements will bolster Bitcoin’s capabilities at the application layer, streamlining the process of token trading on the Bitcoin network, much like ERC20/ERC721 did for Ethereum. In fact, when considering Bitcoin’s untapped market potential to establish its own fungible market ecosystem compared to other smart contract platforms, it becomes evident that there is substantial room for growth for this new generation of tokens, as illustrated in Figure 8 below.
Figure 8: The Market Opportunity for Bitcoin’s Fungible Tokens Ecosystem
Source: FranklinTempleton
That said, Ordinals and Runes aren’t the only source of excitement pushing the boundaries of Bitcoin. For one, Bitcoin’s scaling solution Stacks began the first phase of its Nakamoto upgrade, called the instantiation stage, on April 22, while its final phase is expected to culminate by the end of May. As part of the upgrade, Stacks will introduce faster block processing times, enabling transactions to be finalized in under 5 seconds, a significant improvement from Bitcoin’s average of 10-30 minutes. Additionally, Stacks will leverage Bitcoin’s robust security guarantees, making transaction reversals on the Stacks network as challenging as those on the Bitcoin network. Furthermore, the upgrade will introduce a 1:1 BTC-backed asset (sBTC), enhancing the utility of Bitcoin by enabling its use across a diverse ecosystem of financial and gaming applications built on top of the scaling solution. The growing excitement surrounding its upgrade has pushed the total valued locked on the network to its highest point last week, reaching $170M.
On the other hand, there is a growing ecosystem of scaling solutions emerging on the back of BitVM, released last year. Standing for Bitcoin Virtual machine, this primitive is an operating system that allows for native smart-contract functionality on top of Bitcoin. It does so by introducing what’s known as a two-party provider verifier model that allows for complex computation to be executed off-chain, which can then be challenged on top of Bitcoin using fraud proofs, akin to how Arbitrum and Optimism function. To put it simply, BitVM enables Bitcoin to host more complex applications, which is giving birth to an embryonic L2 landscape, including Chainway, BitLayer, and Bob, amongst others, aiming to alleviate the issue of rising transaction costs. However, we will be closely monitoring this emerging sector, as there are numerous projects attempting to exploit the unprecedented enthusiasm for Bitcoin to launch potentially fraudulent protocols.
Bookmarks
Have you read our latest report, The Bitcoin Halving and Beyond? Click here to get a digital copy.
This Week’s Calendar
Source: Forex Factory, 21Shares
Research Newsletter
Each week the 21Shares Research team will publish our data-driven insights into the crypto asset world through this newsletter. Please direct any comments, questions, and words of feedback to research@21shares.com
Disclaimer
The information provided does not constitute a prospectus or other offering material and does not contain or constitute an offer to sell or a solicitation of any offer to buy securities in any jurisdiction. Some of the information published herein may contain forward-looking statements. Readers are cautioned that any such forward-looking statements are not guarantees of future performance and involve risks and uncertainties and that actual results may differ materially from those in the forward-looking statements as a result of various factors. The information contained herein may not be considered as economic, legal, tax or other advice and users are cautioned to base investment decisions or other decisions solely on the content hereof.
Nyheter
WisdomTree utökar sortimentet med US Quality Growth UCITS ETF (QGRW)
Publicerad
2 timmar sedanden
24 april, 2024WisdomTree har igår lanserat WisdomTree US Quality Growth UCITS ETF (QGRW). QGRW strävar efter att spåra pris- och avkastningsutvecklingen, före avgifter och utgifter, för WisdomTree US Quality Growth UCITS Index (”Indexet”) och har en total kostnadskvot (TER) på 0,33 %. QGRW, som idag är noterat på Börse Xetra och Borsa Italiana, kommer att noteras på Londonbörsen den 24 april 2024.
Det proprietära indexet är utformat för att spåra resultatet för amerikanska storbolag med stark kvalitet (t.ex. hög lönsamhet) och tillväxtegenskaper som uppfyller WisdomTrees ESG-kriterier (miljö, social och styrning).
WisdomTrees tillvägagångssätt syftar till att ge högre uppåtdeltagande på tjurmarknader och generera positiv överavkastning över en hel marknadscykel. Tillväxtfaktorn syftar till att fånga företag som upplever tillväxt i försäljning, realiserade intäkter och förväntade intäkter, ofta inklusive disruptiva företag och tekniska jättar, vilket möjliggör större deltagande uppåt. Kvalitetsfaktorn ger stabilitet till en portfölj och hjälper till att filtrera bort de mest olönsamma, mycket spekulativa och lågkvalitativa namnen. Denna kombination positionerar WisdomTree US Quality Growth UCITS ETF som en strategisk, långsiktig aktielösning för investerare som letar efter genomtänkt exponering mot tillväxtsegmentet på den amerikanska aktiemarknaden utan att offra kvaliteten på sin portfölj.
Pierre Debru, chef för Quantitative Research & Multi Asset Solutions, WisdomTree, sa: ”Tillväxt tenderar att fånga störande och växande företag, vilket leder till högre allokering till tekniska jättar, men historisk avkastning tyder på att investeringar i tillväxtaktier utan filter kan vara en förlora spel på lång sikt. Att tillämpa en kvalitetsskärm på tillväxtaktier kan hjälpa till att säkerställa att portföljbolagen är sunda och kan leverera resultat över tid. Tillväxtaktier av hög kvalitet har historiskt sett varit bättre på att hjälpa investerare att klara avdrag än en ren tillväxtallokering utan att offra förmågan att delta i marknadsåterhämtning. Den nya ETF:n är ett alternativ till tillväxtstrategier som Nasdaq 100, eftersom den tar ett mer holistiskt tillvägagångssätt för portföljkonstruktion istället för att enbart fokusera på marknadsvärde för beståndsdelar eller deras börsnotering.”
Europeiska investerare kan nu få tillgång till QGRW, som redan är en tillgänglig strategi i USA, som initialt lanserades 2022. WisdomTree US Quality Growth UCITS ETF kommer att ansluta sig till WisdomTrees sortiment av 360 miljoner USD av Quality Growth ETFer.
Genom WisdomTree US Quality Growth UCITS ETF kan investerare fortsätta att dra nytta av WisdomTrees stilkonsekventa, transparenta och systematiska investeringsprocess med rötter i akademiskt driven forskning.
Alexis Marinof, Europachef, WisdomTree, tillade: ”Sedan WisdomTree grundades har vi fokuserat på att lansera differentierade och mervärdesinvesteringslösningar för våra kunder. Kärnan i vår aktiefilosofi är tron att kvalitetsaktier bör vara hörnstenen i varje aktieportfölj. De är avgörande för att bygga motståndskraftiga portföljer som kan hjälpa investerare att bygga upp välstånd på lång sikt och navigera i de oundvikliga stormarna. Vi vet att investerare positionerar portföljer för att dra nytta av de kommande räntesänkningarna i USA, vilket förväntas bli en positiv katalysator för tillväxtorienterade amerikanska aktier. Men som vi har sett de senaste åren utlovas ingenting på finansmarknaderna. Så, genom att fokusera på kvalitet snarare än börsvärde, kan investerare dra nytta av ett mer robust tillvägagångssätt än marknadsvärdevägda tillväxtfonder, utan att offra avkastningen på uppåtgående marknader.”
ETF information
Namn | Avgift | Börs | Valuta | Kortnamn | ISIN |
WisdomTree US Quality Growth UCITS ETF – USD Acc | 0.33% | London Stock Exchange | USD | QGRW | IE000YGEAK03 |
WisdomTree US Quality Growth UCITS ETF – USD Acc | 0.33% | London Stock Exchange | GBx | QGRP | IE000YGEAK03 |
WisdomTree US Quality Growth UCITS ETF – USD Acc | 0.33% | Borsa Italiana | EUR | QGRW | IE000YGEAK03 |
WisdomTree US Quality Growth UCITS ETF – USD Acc | 0.33% | Börse Xetra | EUR | QGRW | IE000YGEAK03 |
iShares Core MSCI Japan IMI UCITS ETF USD (Dist) (SJPD ETF) med ISIN IE00BFM15T99, försöker följa MSCI Japan IMI-index. MSCI Japan IMI-index spårar aktier från Japan. Den täcker värdepapper över stora, medelstora och små företagssegment.
Den börshandlade fondens TER (total cost ratio) uppgår till 0,12 % p.a. iShares Core MSCI Japan IMI UCITS ETF USD (Dist) är den billigaste ETF som följer MSCI Japan IMI-index. Denna ETF replikerar det underliggande indexets prestanda genom samplingsteknik (köper ett urval av de mest relevanta indexbeståndsdelarna). Utdelningarna i ETFen delas ut till investerarna (halvårsvis).
iShares Core MSCI Japan IMI UCITS ETF USD (Dist) har tillgångar på 174 miljoner euro under förvaltning. Denna ETF lanserades den 6 december 2018 och har sin hemvist i Irland.
Varför SJPD?
- Exponering mot aktiemarknaden i den tredje största globala ekonomin
- Hela marknadsexponeringen innebär att man inte går miste om potentiella tillväxtöverraskningar från ofta förbisedda mindre företag
- Använd i kärnan av en portfölj för att söka långsiktig tillväxt
Investeringsmål
Fonden strävar efter att följa resultatet för ett index som består av japanska stora, medelstora och småbolag.
Handla SJPD ETF
iShares Core MSCI Japan IMI UCITS ETF USD (Dist) (SJPD ETF) är en börshandlad fond (ETF) som handlas på Euronext Amsterdam.
Euronext Amsterdam är en marknad som få svenska banker och nätmäklare erbjuder access till, men DEGIRO gör det.
Börsnoteringar
Börs | Valuta | Kortnamn |
gettex | EUR | 36B2 |
Euronext Amsterdam | USD | SJPD |
Största innehav
Kortnamn | Namn | Sektor | Vikt(%) | ISIN | Valuta |
7203 | TOYOTA MOTOR CORP | Sällanköpsvaror | 5,33 | JP3633400001 | JPY |
8035 | TOKYO ELECTRON LTD | Informationsteknologi | 2,49 | JP3571400005 | JPY |
8306 | MITSUBISHI UFJ FINANCIAL GROUP INC | Finans | 2,30 | JP3902900004 | JPY |
6758 | SONY GROUP CORP | Sällanköpsvaror | 2,19 | JP3435000009 | JPY |
6501 | HITACHI LTD | Industri | 1,80 | JP3788600009 | JPY |
6861 | KEYENCE CORP | Informationsteknologi | 1,68 | JP3236200006 | JPY |
8058 | MITSUBISHI CORP | Industri | 1,66 | JP3898400001 | JPY |
4063 | SHIN ETSU CHEMICAL LTD | Materials | 1,57 | JP3371200001 | JPY |
8316 | SUMITOMO MITSUI FINANCIAL GROUP IN | Finans | 1,52 | JP3890350006 | JPY |
6098 | RECRUIT HOLDINGS LTD | Industri | 1,30 | JP3970300004 | JPY |
Innehav kan komma att förändras
Navigating Macro Headwinds, On-Chain Optics, and The Rise of Runes
WisdomTree utökar sortimentet med US Quality Growth UCITS ETF (QGRW)
SJPD ETF köper alla slags japanska aktier
Franklin Templeton lanserar ny fond som följer katolska principer
U.S. Global Investors tar över HANetf Travel
ETFmarknaden i Europa firar sitt 24-årsjubileum med tillgångar på två biljoner USD
De mest populära börshandlade fonderna mars 2024
3 ETF:er du nog inte visste finns
FUIG ETF investerar i hållbara företagsobligationer som följer Parisavtalet
Tillgång till obligationsmarknaden för företagsobligationer från utvecklade marknader
Populära
-
Nyheter3 veckor sedan
De mest populära börshandlade fonderna mars 2024
-
Nyheter4 veckor sedan
3 ETF:er du nog inte visste finns
-
Nyheter3 veckor sedan
FUIG ETF investerar i hållbara företagsobligationer som följer Parisavtalet
-
Nyheter1 vecka sedan
Tillgång till obligationsmarknaden för företagsobligationer från utvecklade marknader
-
Nyheter2 veckor sedan
Försvarsfond når förvaltad volym på 500 MUSD
-
Nyheter3 veckor sedan
Vad händer härnäst för Bitcoin?
-
Nyheter3 veckor sedan
Ny börshandlad fond från Deka ger tillgång till S&P 500-index
-
Nyheter4 veckor sedan
XENIX ETF AWARDS Nordics 2024, Stockholm