
Nyheter
Fundamentals Return to Emerging Markets
Fundamentals Return to Emerging Markets. This past quarter has been one of more twists and turns in macro factors than we can, perhaps, remember. Commodities went from being some of the worst performing and under-held assets in January to the complete opposite in February and March. The Federal Reserve has ”walked back” from its previous more hawkish interest rate projections and, as a result, the U.S. dollar declined dramatically. This has taken the pressure off some of the weaker emerging markets currencies, which have seen impressive rallies. It appears that many emerging markets investors have rushed to sell popular investments in India and China to return to more globally cyclical driven markets, companies that have benefited from the rebound in commodities, and higher beta currencies. This caused significant performance idiosyncrasies among countries in the emerging markets complex in the first quarter.
1Q 2016 EM Equity Strategy Review and Positioning
We believe long-term followers of our strategy will understand that panic followed by euphoria rarely provides a favorable backdrop for outperformance by our highly disciplined all-cap strategy, as both size and growth characteristics tend to be penalized in short periods of panic. Poor quality and cyclical factors, which our strategy generally avoids, tend to outperform everything in the first innings of euphoria. It is important to point out that the cause of our potential underperformance during these short periods is often due to what we do not own (i.e., what we deem to be very large, poor quality cyclical companies) as much as it is indicative of what we do own — you might think of it as partial giveback of our previous outperformance.
Financials and Consumer Staples Provide Boost; Industrials and Tech Detract
During the first quarter of 2016, stock selection in financials and consumer staples aided performance relative to the MSCI Emerging Markets Index1 benchmark, while selection in industrials and information technology detracted. The absence of allocations to the energy and materials sectors also hurt the strategy’s relative performance.
On a country level, China was the main detractor from performance followed by Russia and India. Peru, the Philippines, and Colombia gave the strategy’s relative performance a boost.
1Q Top Performers
The top five performing companies in the strategy came from around the globe. BB Seguridade Participacoes SA2, the insurance arm of Banco do Brasil, the largest Latin America-based bank, as a Brazilian real holding, was helped significantly by the rebound in the Brazilian market during the quarter. It’s a structural growth story. The company continues to display strong execution, in line with our growth thesis. In addition to its improving asset quality, consistent performance, and asset growth, Peruvian financial holding company Credicorp3 benefited from the turnaround in the Peruvian market. This followed the second half of 2015 when uncertainty as to whether the country would be reclassified by MSCI indexers weighed heavily on its stocks. Yes Bank4, a high-quality, private sector Indian bank, benefited from both improving loan growth and widening lending spreads. These have resulted in significant results, as has the bank’s focus on retail, as opposed to commercial, business opportunities. The stock price of Robinsons Retail Holdings5, the Philippines’ second largest multi-format retailer, made up most of its decline from the last quarter after full-year 2015 results came in largely in line with consensus, backing up our growth thesis. Although a global leader and structural growth story in its own right, Taiwan Semiconductor Manufacturing Company6, the undisputed global leader in integrated circuit (IC) manufacturing, also benefitted from cyclical factors in the first quarter. There were earnings upgrades driven by greater short-term visibility and asset utilization from improved traction with key customers. Additionally, there was a multiple lift as investors also favored businesses that benefited from global cyclical tailwinds.
Chinese Stocks Suffer in 2016
Given that Chinese stocks suffered during the quarter, it is perhaps not surprising that four of the five biggest detractors from our strategy’s performance were Chinese. Following a slight change in its business model, Chinese company Boer Power Holdings7, which provides electrical distribution solutions, is facing, in our opinion, increased business risk. The company’s leverage increased as it took on higher levels of accounts receivable. We continue to believe, however, that the company will continue to be a beneficiary of the development of a smarter grid in China. Luxoft Holding8 is a high-end information technology services provider, primarily to the financial services industry, with its programmers largely situated in the ex-Soviet Union countries, which are referred to as Commonwealth of Independent States (CIS). During the quarter, the company reported lower than expected numbers, largely related to the pulling of a key contract by a client. Chinese company Wasion Group Holdings9, like Boer Power Holdings, is in the business of improving the efficiency of power use, an area of activity we still believe displays convincing fundamentals. The company is setting the standard for ”smart” electrical grid meters in the country. During the quarter, however, it suffered from the fallout created by the adjustment and lengthening of payment timelines on certain government contracts. Along with a number of others, JD.com10, one of the Fund’s internet holdings, suffered from the widespread exit from the Chinese market during the quarter, giving back some of its outperformance of the previous year. However, the company continues to reflect, in our opinion, the considerable strength of the growth opportunities in the e-commerce sector in China. CAR Inc11 is the largest auto rental company in China and provides vehicles to U-Car, a partner providing ”Uber-like” chauffeured car services in China. The issues around this company, and its recent poor performance, center on uncertainty surrounding the regulatory environment that has led U-Car to scale back its investment, and thus use fewer CAR Inc vehicles. We are monitoring this situation closely.
We Don’t Respond to Short-Term Macro Events
As we always strive to emphasize, we are fundamentally a bottom-up strategy, first and foremost. However, we do like to give a sense of where the strategy is positioned in terms of country and sector. Please bear in mind that a higher weighting in a country may not necessarily mean extra exposure to that country’s risk, as certain holdings may be negatively correlated to the local currency or positively correlated to local rates.
Because we don’t respond to shorter-term macro events such as oil and Brazilian politics, our weightings do not tend to move as materially as those of many of our peers. We simply don’t speculate on short-term movements or cyclical factors — we invest in well-researched, long-term structural growth businesses at attractive valuations. We maintain that this process and philosophy have historically returned and, we hope, may continue to return, what we consider pleasing long-term performance. However, our long-term performance may be punctuated by short periods when the asset class underperforms for mostly technical reasons.
We continue to be overweight in China, India, and Brazil, while still significantly underweight in South Korea. Taiwan still has a relatively light weighting, although it is home to a couple of our larger positions. South Africa is still also underweight, but less so than in prior years, as weakness in the rand has encouraged us to make further investment in domestically-oriented companies, while outperformance of Naspers12 has also increased our weighting in the country.
Healthcare and Financials Offer Structural Growth Opportunities
By sector, we have maintained the persistent biases that you can expect from our philosophy of structural growth at a reasonable price. Energy and materials are very difficult places for us to find good, persistent growth, while much of the telecommunication and utility sectors are not showing us much growth at all. Consumer staples, a natural area to look for structural growth, has largely proven to be too expensive for our taste in the last few years, and this remains the case.
We remain overweight in healthcare, clearly a long run structural growth industry as consumers in emerging markets dedicate a higher percentage of their increasing disposable income to healthcare spending. Financials remain a large weighting for the strategy, but the investments we choose in this sector are very specific, usually by country, and focus on persistent structural trends such as microfinance, ”banking the unbanked” and specialty insurance.
Emerging Markets Outlook
Experience informs us that this kind of environment rarely persists for more than a quarter or two before rational fundamentals reassert themselves and investments in quality companies with genuinely sustainable operating profitability and attractive valuations reassert their leadership. In a more ”normal” environment, our strategy has historically tended to do quite well in our estimation.
Eyeing Brazil with Interest
We are watching Brazil with great interest. The political situation there remains extremely fluid. The incumbent socialist administration looks increasingly likely to be replaced by a more market friendly, reformist coalition. This expectation has resulted in a sharp recovery in current share prices and the country’s currency. We steadily increased positions throughout last year because valuations became more and more attractive and have been somewhat rewarded for this — only somewhat, because the rebound has been led, so far, by large-cap commodity names such as Petrobras and Vale14, which do not align with our structural growth at a reasonable price (SGARP) philosophy and process.
Lower But Better Growth in China
China began the year with very negative headlines centering on the likelihood of a sharp depreciation of its currency and fears of an imminent debt-fueled crisis. We, on the other hand, continue to expect lower but better growth, monetary and fiscal easing, and a gradually weakening renminbi, but no crisis. Our base case is for modest cyclical recovery in China’s economy in the first half of 2016 that could allow more room for further significant structural reforms, with more emphasis on the supply-side of the economy, rather than attempts simply to ”juice up” demand. We do believe, however, that more credit ”issues” are likely as the tidying up of highly indebted, state owned entities continues. As we regularly remind emerging markets investors, our strategy has very little exposure to the old, smokestack/state-owned enterprise (SOE) complex13, and we continue to favor long-term, structural growth opportunities in environmental services, internet, healthcare, tourism, and insurance.
Performance Led by Technicals in India
India was the other market where we experienced some negative performance over the quarter. Again, we would make the case that this was partly for technical reasons related to positioning. We remain optimistic about the Indian companies in which the strategy is currently invested, despite the country falling out of favor in relative terms.
Accelerating Growth in Peru
After several months facing a challenging scenario with lower commodity prices, the outlook for Peru started to improve. Growth in the country has been accelerating, driven by the mining and infrastructure sector. There is uncertainty regarding the outcome of the presidential election. It seems that the most likely scenario is that former-president Alberto Fujimori will win in the second round. Finally, there seems to be a consensus view that Peru has a big chance of avoiding MSCI reclassification to Frontier Market which could act as an additional driver to Peruvian equities.
Can Colombia Tough Out Low Oil Prices?
Colombia continues to be negatively affected by the low level of oil prices, the uncertain fiscal adjustment, and expectations for the peace process. In our view, the government needs to approve a fiscal reform in order to address some important topics that will allow the country to achieve its fiscal target amid lower prices and low level of reserves. The government is waiting for the completion of the peace process to have the necessary political capital to proceed with an honest fiscal reform (this will be decisive to preserve the sovereign rating). There will likely be some slowdown in activity in 2016 with GDP growth expectations of around 2.7% versus 3.1% in 2015. There are some factors such as the beginning of the 4G mobile technology infrastructure program and the positive reaction of some tradeable sectors to a higher exchange rate that should partially offset the tough scenario for the economy given currently low oil prices.
We Believe Structural Growth is Reliable and Sustainable
In general, we see valuations for our focus list companies, after the recent rally, as fair, without being materially cheap. As we noted at the end of 2015, we are now seeing, as expected, some better economic numbers out of China, which is a notable bright spot. In addition, we would also point out that the growth of our strategy has been structural in nature and, arguably, quite reliable; as such, we expect it to compound over the course of time, with little cyclical risk associated with the world and market volatility we live with today.
Emerging Markets Equity

April 18, 2016
by David Semple, Portfolio Manager
Semple is a veteran of emerging markets (EM) investing, and has more than 25 years of experience. Uniquely informed by having lived and worked in several emerging markets, Semple’s EM expertise includes successfully establishing investment processes and frameworks, leading teams of analysts, and marketing to a global investor base.
Post Disclosure
1 The Morgan Stanley Capital International (MSCI) Emerging Markets Index captures large and mid cap representation across 23 Emerging Markets (EM) countries. With 836 constituents, the index covers approximately 85% of the free float-adjusted market capitalization in each country. This index is unmanaged and does not reflect the payment of transaction costs, advisory fees or expenses that are associated with an investment in specific investment Fund. An index’s performance is not illustrative of a Fund’s performance. Indices are not securities in which investments can be made.
For a complete listing of the holdings in Van Eck Emerging Markets Fund (the ”Fund”) as of 3/31/16, please click on this PDF. Please note that these are not recommendations to buy or sell any security.
2 BB Seguridade Participacoes SA represented 3.2% of the Fund’s net assets as of 3/31/16.
3 Credicorp represented 2.4% of the Fund’s net assets as of 3/31/16.
4 Yes Bank represented 2.4% of the Fund’s net assets as of 3/31/16.
5 Robinsons Retail Holdings represented 2.2% of the Fund’s net assets as of 3/31/16.
6 Taiwan Semiconductor Manufacturing Company represented 2.5% of the Fund’s net assets as of 3/31/16.
7 Boer Power Holdings represented 0.6% of the Fund’s net assets as of 3/31/16.
8 Luxoft Holdings represented 1.6% of the Fund’s net assets as of 3/31/16.
9 Wasion Group Holdings represented 0.7% of the Fund’s net assets as of 3/31/16.
10 JD.com represented 3.1% of the Fund’s net assets as of 3/31/16.
11 CAR Inc represented 1.5% of the Fund’s net assets as of 3/31/16.
12 Naspers represented 3.4% of the Fund’s net assets as of 3/31/16.
13 State-Owned Enterprise (SOE) is a legal entity created by a government with the purpose to partake in commercial activities on the government’s behalf.
14Petrobras and Vale were not held by the Fund as of 3/31/16.
IMPORTANT DISCLOSURE
This content is published in the United States for residents of specified countries. Investors are subject to securities and tax regulations within their applicable jurisdictions that are not addressed on this content. Nothing in this content should be considered a solicitation to buy or an offer to sell shares of any investment in any jurisdiction where the offer or solicitation would be unlawful under the securities laws of such jurisdiction, nor is it intended as investment, tax, financial, or legal advice. Investors should seek such professional advice for their particular situation and jurisdiction.
The views and opinions expressed are those of the speakers and are current as of the posting date. Videos and commentaries are general in nature and should not be construed as investment advice. Opinions are subject to change with market conditions. All performance information is historical and is not a guarantee of future results.
Please note that Van Eck Securities Corporation offers investment portfolios that invest in the asset class(es) mentioned in this commentary. The Emerging Markets Equity strategy is subject to the risks associated with its investments in emerging markets securities, which tend to be more volatile and less liquid than securities traded in developed countries. The Emerging Markets Equity strategy’s investments in foreign securities involve risks related to adverse political and economic developments unique to a country or a region, currency fluctuations or controls, and the possibility of arbitrary action by foreign governments, including the takeover of property without adequate compensation or imposition of prohibitive taxation. The Emerging Markets Equity strategy is subject to risks associated with investments in derivatives, illiquid securities, and small or mid-cap companies. The Emerging Markets Equity strategy is also subject to inflation risk, market risk, non-diversification risk, and leverage risk. Please see the prospectus and summary prospectus for information on these and other risk considerations.
You can obtain more specific information on VanEck strategies by visiting Investment Strategies.
Investing involves risk, including possible loss of principal. An investor should consider investment objectives, risks, charges and expenses of any investment strategy carefully before investing. No part of this material may be reproduced in any form, or referred to in any other publication, without express written permission of Van Eck Securities Corporation.


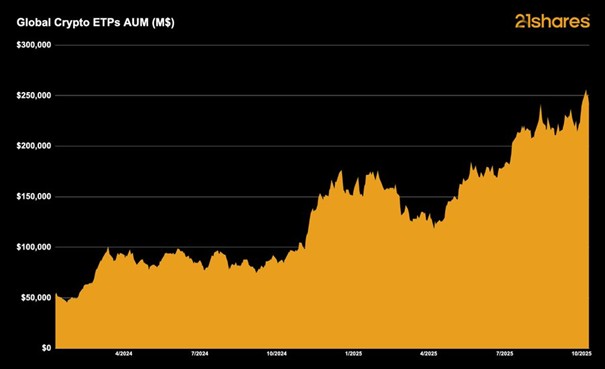
I början av året förutspådde 21shares att krypto-ETPer skulle driva ytterligare institutionell adoption och nå 250 miljarder dollar i förvaltat kapital globalt. Den milstolpen har just nåtts.
Research Newsletter
Each week the 21Shares Research team will publish our data-driven insights into the crypto asset world through this newsletter. Please direct any comments, questions, and words of feedback to research@21shares.com
Disclaimer
The information provided does not constitute a prospectus or other offering material and does not contain or constitute an offer to sell or a solicitation of any offer to buy securities in any jurisdiction. Some of the information published herein may contain forward-looking statements. Readers are cautioned that any such forward-looking statements are not guarantees of future performance and involve risks and uncertainties and that actual results may differ materially from those in the forward-looking statements as a result of various factors. The information contained herein may not be considered as economic, legal, tax or other advice and users are cautioned to base investment decisions or other decisions solely on the content hereof.


Globala krypto-ETPer förvaltade tillgångar når 250 miljarder dollar

YGLD ETP spårar priset på guld och ger en löpande avkastning

Investera i Stacks med en börshandlad produkt

VALOUR FLR SEK följer priset på kryptovalutan FLR
BlackRock utökar sitt utbud av iShares iBonds UCITS ETFer med sex nya lanseringar

HANetf och Infrastructure Capital Advisors samarbetar för att lansera aktivt förvaltad preferensavkastnings-ETF i Europa

IN0A ETF spårar S&P 500 med fokus på företag med höga ESG-betyg

De bästa lågvolatilitets ETFer på marknaden
PLTY ETP utfärdar optioner mot aktier i Palantir
Time in Bitcoin beats timing Bitcoin
-
 Nyheter4 veckor sedan
HANetf och Infrastructure Capital Advisors samarbetar för att lansera aktivt förvaltad preferensavkastnings-ETF i Europa
-
 Nyheter4 veckor sedan
IN0A ETF spårar S&P 500 med fokus på företag med höga ESG-betyg
-
 Nyheter4 veckor sedan
De bästa lågvolatilitets ETFer på marknaden
-

 Nyheter4 veckor sedan
PLTY ETP utfärdar optioner mot aktier i Palantir
-

 Nyheter4 veckor sedan
Time in Bitcoin beats timing Bitcoin
-

 Nyheter4 veckor sedan
HANetf kommenterar kopparuppgången
-

 Nyheter2 veckor sedan
Fokus mot en helt ny börshandlad produkt i september 2025
-

 Nyheter3 veckor sedan
M5TYs senaste utdelningstakt (55 %) belyser covered call-strategins inkomstpotential