
Nyheter
Fallen Angels Retain Their Halos in 2015

Fallen Angels Retain Their Halos in 2015 ETFs is authored by VanEck thought leaders. VanEck is the sponsor of Market Vectors ETFs and is currently among the largest providers of exchange traded funds (ETFs) in the U.S. and worldwide. Market Vectors ETFs empower investors to help build better portfolios with access to compelling investment themes and strategies. Our ETFs span many global asset classes, and are built to be transparent, liquid, and pure-play reflections of target markets.
Authored by Meredith Larson, Product Manager, ETFs
Performance Helped by Higher Credit Quality and Lower Energy Exposure
Fallen angels, corporate high yield bonds that were originally issued with investment grade credit ratings, proved more resilient than the broad high yield bond market in 2015.
Generally characterized by higher average credit quality than the broad high yield bond market, fallen angels outperformed by approximately 1.40%, as measured by the BofA Merrill Lynch US Fallen Angel High Yield Index (-3.24%) versus the BofA Merrill Lynch US High Yield Index (-4.64%). Higher average credit quality, lower average exposure to the energy sector, and higher average credit quality within the energy sector were main factors that helped fallen angels end the year ahead of the broad high yield bond market.
Less Weight in Exploration & Production
While the energy sector allocation among fallen angels increased in 2015 (from 4.3% to 13.3%) as the broad high yield bond market’s decreased (from 13.3% to 10.9%), it was fallen angels’ significantly lower yearend industry weight in exploration and production (E&P) that primarily contributed to outperformance. At 0.48%, fallen angels were less exposed to E&P than the broad high yield bond market, which ended 2015 with 4.89% in E&P, arguably one of the energy sector’s more vulnerable industries to the oil price collapse.
Declining oil and commodity prices had a greater relative impact on fallen angels’ 4Q 2015 performance, as fallen angels underperformed the broad high yield bond market by 74 basis points. While the energy sector grew from fallen angel entrants throughout 2015, none were E&P bonds. Furthermore, the fallen angel universe maintained its higher average credit quality, ending 2015 with 81.6% in BB-rated (below investment grade) bonds versus the broad high yield bond market’s 48.4%.
Sector Biases Drove Fallen Angel Performance in 2015
The main drivers of fallen angels’ performance relative to the broad high yield bond market remained consistent throughout 4Q and 2015. Based on average sector weights:
• Positive Influences
• Energy (underweight)
• Banking (overweight)
• Financial Services (overweight)
• Negative Influences
• Basic Industry (overweight)
• Healthcare (underweight)
• Media (underweight)
Sector Return Attribution (%):
Fallen Angels Relative to the Broad High Yield Bond Market

(Click to enlarge) Source: FactSet. Data as of December 31, 2015. Past performance is no guarantee of future performance. Top and bottom five sector attribution of the BofA Merrill Lynch US Fallen Angel High Yield Index for fallen angels versus the BofA Merrill Lynch US High Yield Index for the broad high yield bond market. Figures are gross of fees, non-transaction based and therefore estimates only. Past performance is not indicative of future results.
Attribution represents the opportunity cost of investment positions in a group relative to the overall benchmark.
While fallen angels had lower average energy exposure in 2015, fallen angel bonds from two energy sector issuers entered the index in January, increasing the allocation to 14.4% versus the broad high yield bond market’s 10.4%, as of January 31, 2016.
What are Fallen Angel Bonds?
Watch this educational video on fallen angel bonds and the investment opportunities they may offer.
”…In a way, fallen angel investing is a contrarian strategy. You’re buying bonds that have crossed over from investment grade to high yield and that have seen a lot more selling than buying in the months leading up to the crossover.”
Learn More About ANGL
Additional resources and information on Market Vectors® Fallen Angel High Yield Bond ETF (ANGL) »


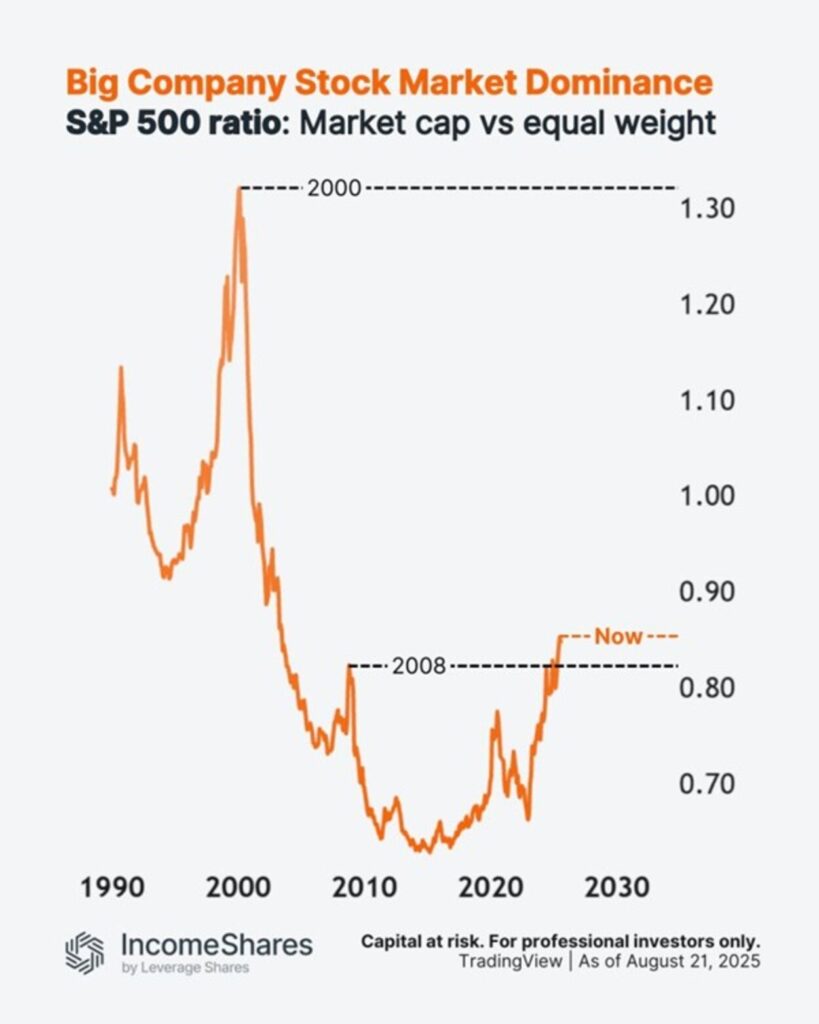
Stora företag dominerar den amerikanska aktiemarknaden mer än 2008 – men mindre än under dotcom-dagarna.
Detta diagram delar S&P 500-indexet (viktat efter börsvärde) med dess likaviktade version.
När kvoten stiger bär större aktier (större börsvärden) indexet mer.
Kvoten är nu högre än 2008 – men mycket lägre än toppen år 2000.
Då var ledarskapet en blandning av teknikjättar som Microsoft, Cisco och Intel, plus tungviktare från gamla ekonomier som General Electric och Walmart.
Idag är ledarskapet mer tekniktungt – med Mag 7-aktierna som utgör över 30 % av S&P 500.
Följ IncomeShares EU för marknadsinsikter.


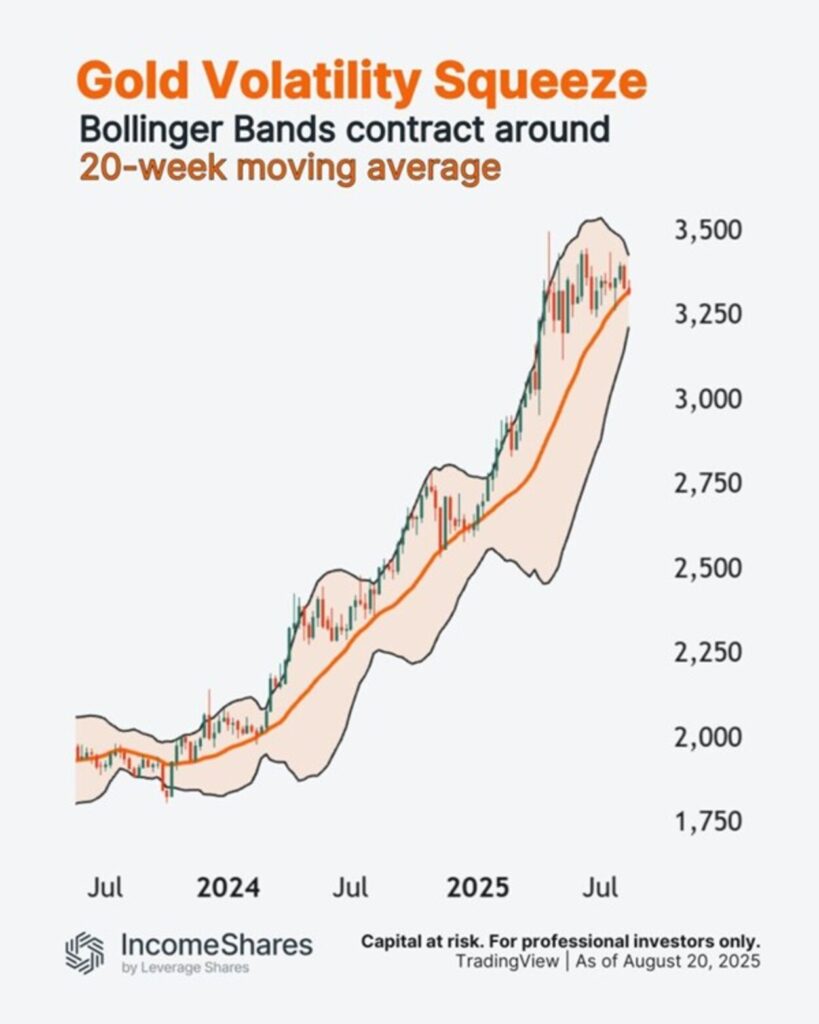
Under hela denna period har guldpriset konsekvent funnit stöd i det mellersta Bollingerbandet – det 20-veckors glidande medelvärdet. Varje gång volatiliteten sjönk, pressades de yttre banden samman, och nästa ben högre följde (när volatiliteten återvände).
Vi ser nu samma upplägg igen.
Trenderna håller i sig tills de inte gör det längre.
IncomeShares Gold+ Yield Options ETP (YGLD) innehar guld och säljer köpoptioner mot det. Strategin syftar till att generera månatliga intäkter från köpoptionerna, samtidigt som man behåller en viss exponering mot guldpriset.
Följ IncomeShares EU för marknadsinsikter.


Stora företag dominerar den amerikanska aktiemarknaden

FESE ETF investerar i hållbara obligationer från emerging markets

Guldpriset har stigit med cirka 70 % under de senaste två åren.

ZINS ETF köper och förvaltar statsobligationer aktivt

Nasdaq Stockholm välkomnar Xtrackers by DWS som ny ETF-leverantör

Vilken ETF för Europas försvarsindustri är bäst?

De börshandlade fonderna som lockade mest i sommarvärmen

Fastställd utdelning i MONTDIV juli 2025

ETFer som ger exponering mot börsintroduktioner

Månadsutdelande ETFer uppdaterad med två börshandlade fonder från AXA
-
 Nyheter4 veckor sedan
Vilken ETF för Europas försvarsindustri är bäst?
-
 Nyheter3 veckor sedan
De börshandlade fonderna som lockade mest i sommarvärmen
-
 Nyheter3 veckor sedan
ETFer som ger exponering mot börsintroduktioner
-
 Nyheter4 veckor sedan
Fastställd utdelning i MONTDIV juli 2025
-
 Nyheter3 veckor sedan
Månadsutdelande ETFer uppdaterad med två börshandlade fonder från AXA
-
 Nyheter4 veckor sedan
Bitcoin + Gold: The power couple for smarter portfolios
-

 Nyheter3 veckor sedan
Bitcoin likes to dance to its own beat, not to tech stock tunes
-

 Nyheter3 veckor sedan
TMX VettaFis Jane Edmondson om nya försvars-ETFer